| Param | Original file | Final file |
|---|---|---|
| Filename | modeM0/AS1T05_143T01_9000005830_42879cztM0_level2.fits | modeM0/AS1T05_143T01_9000005830_42879cztM0_level2_quad_clean.evt |
| Size (bytes) | 366,580,800 | 84,700,800 |
| Size | 349.6 MB | 80.8 MB |
| Events in quadrant A | 3,227,745 | 571,863 |
| Events in quadrant B | 2,545,091 | 597,702 |
| Events in quadrant C | 3,849,508 | 538,039 |
| Events in quadrant D | 3,564,338 | 512,282 |
| Mode M0 | |||
|---|---|---|---|
| Quadrant | BADHDUFLAG | Total packets | Discarded packets |
| A | 0 | 12767 | 2 |
| B | 0 | 11028 | 2 |
| C | 0 | 14622 | 2 |
| D | 0 | 14031 | 2 |
| Mode M9 | |||
|---|---|---|---|
| Quadrant | BADHDUFLAG | Total packets | Discarded packets |
| A | 0 | 20 | 0 |
| B | 0 | 20 | 0 |
| C | 0 | 20 | 0 |
| D | 0 | 20 | 0 |
| Mode SS | |||
|---|---|---|---|
| Quadrant | BADHDUFLAG | Total packets | Discarded packets |
| A | 0 | 100 | 0 |
| B | 0 | 100 | 0 |
| C | 0 | 100 | 0 |
| D | 0 | 100 | 0 |
| Quadrant | Total seconds | Saturated seconds | Saturation percentage |
|---|---|---|---|
| A | 4917 | 182 | 3.701444% |
| B | 4918 | 38 | 0.772672% |
| C | 4918 | 347 | 7.055714% |
| D | 4918 | 227 | 4.615697% |
Noise dominated data is calculated using 1-second bins in cleaned event files. If a bin has >2000 counts, and if more than 50% of those come from <1% of pixels, then it is considered to be noise-dominated and hence unusable.
| Quadrant | # 1 sec bins | Bins with >0 counts | Bins with >2000 counts | High rate bins dominated by noise | Noise dominated (total time) | Noise dominated (detector-on time) | Marked lightcurve |
|---|---|---|---|---|---|---|---|
| A | 6919 | 4918 | 144 | 144 | 2.08% | 2.93% | 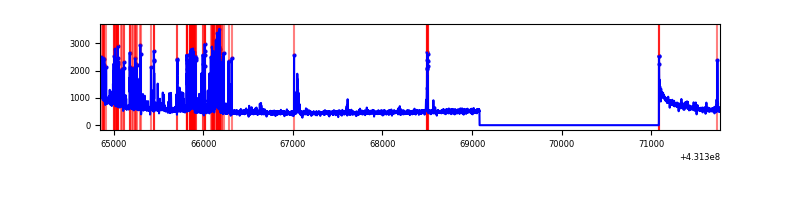 |
| B | 6920 | 4919 | 31 | 31 | 0.45% | 0.63% | 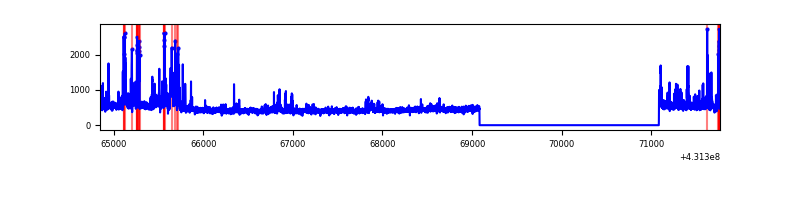 |
| C | 6920 | 4919 | 324 | 324 | 4.68% | 6.59% | 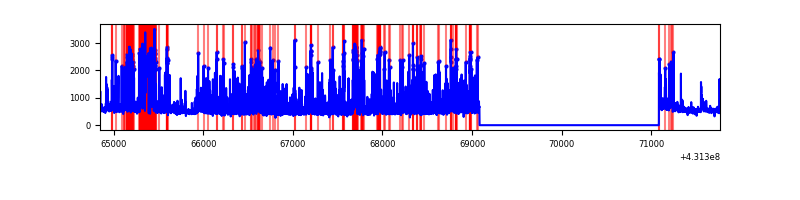 |
| D | 6920 | 4919 | 232 | 232 | 3.35% | 4.72% | 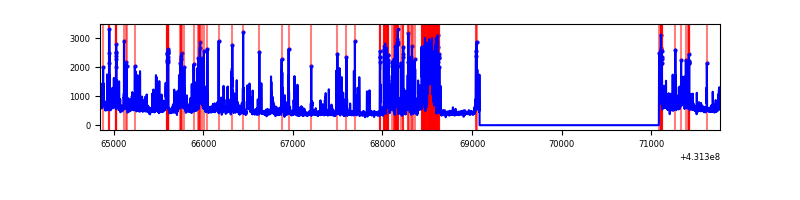 |
Top three noisy pixels from each quadrant. If the there are fewer than three noisy pixels in the level2.evt file, extra rows are filled as -1
| Pixel properties | Quadrant properties | ||||||
|---|---|---|---|---|---|---|---|
| Quadrant | DetID | PixID | Counts | Sigma | Mean | Median | Sigma |
| A | 10 | 83 | 530228 | 4778.43 | 537 | 525 | 110.9 |
| A | 15 | 237 | 528916 | 4766.59 | 537 | 525 | 110.9 |
| A | 13 | 248 | 83859 | 751.75 | 537 | 525 | 110.9 |
| B | 3 | 112 | 173769 | 1676.37 | 545 | 530 | 103.3 |
| B | 0 | 190 | 59620 | 571.79 | 545 | 530 | 103.3 |
| B | 15 | 85 | 56514 | 541.74 | 545 | 530 | 103.3 |
| C | 0 | 207 | 788834 | 6626.32 | 517 | 520 | 119.0 |
| C | 14 | 254 | 592393 | 4975.1 | 517 | 520 | 119.0 |
| C | 12 | 2 | 230601 | 1933.99 | 517 | 520 | 119.0 |
| D | 12 | 6 | 623354 | 4813.53 | 530 | 514 | 129.4 |
| D | 12 | 233 | 205976 | 1587.88 | 530 | 514 | 129.4 |
| D | 1 | 52 | 172328 | 1327.84 | 530 | 514 | 129.4 |
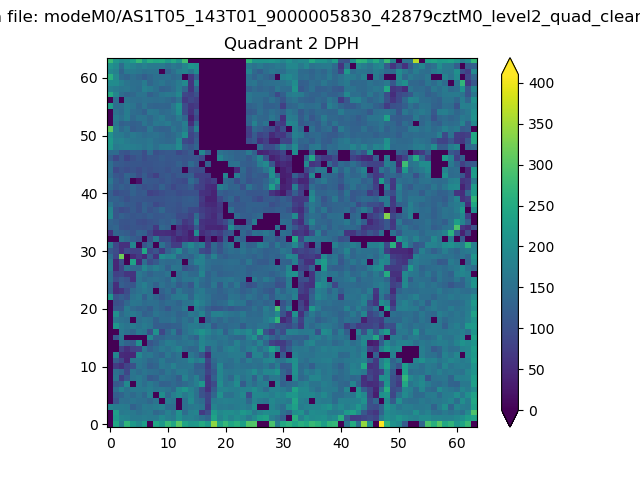
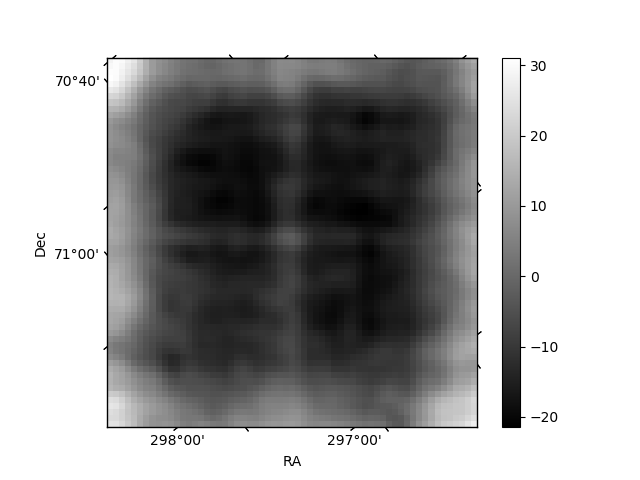
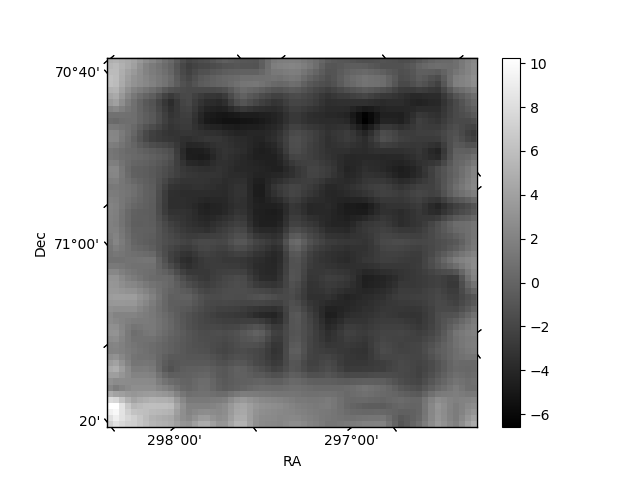
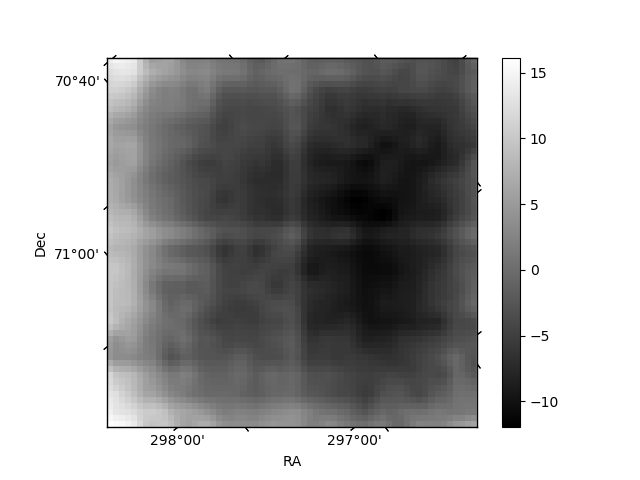
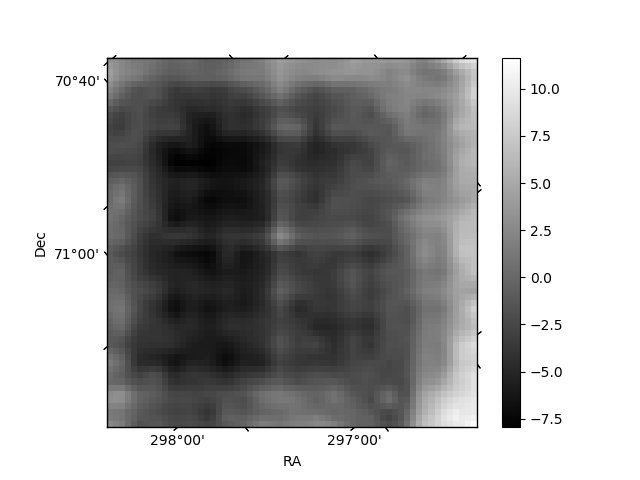
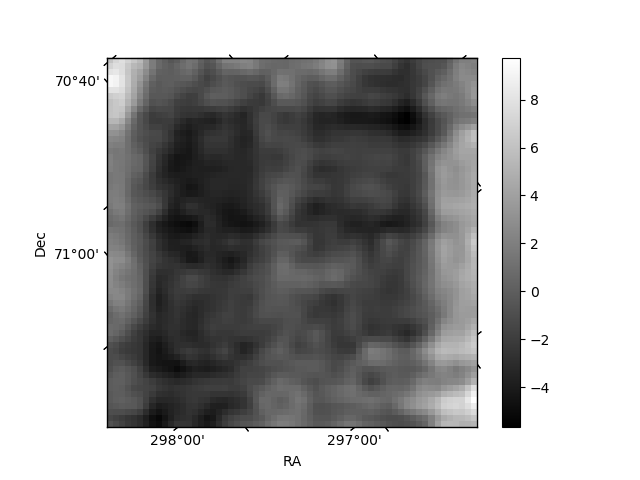
Histogram calculated using DETX and DETY for each event in the final _common_clean file
| Quadrant A | 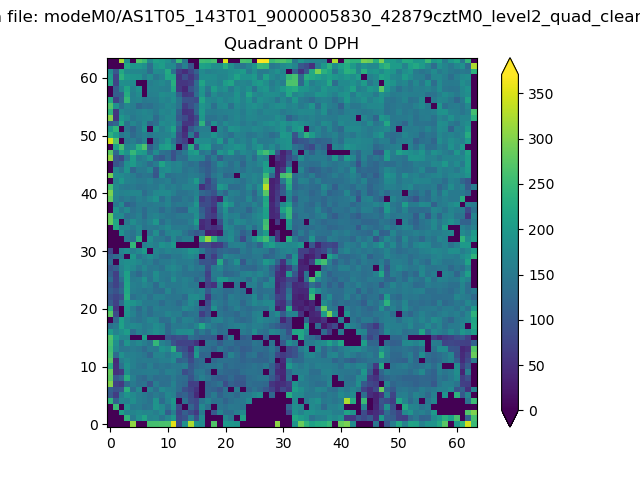 |
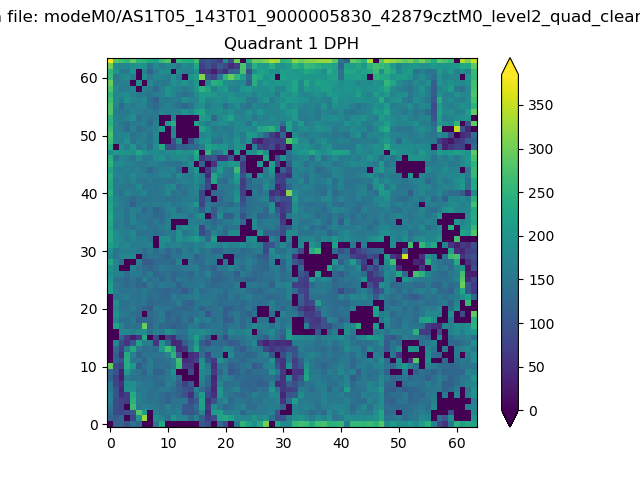 |
Quadrant B |
|---|---|---|---|
| Quadrant D | 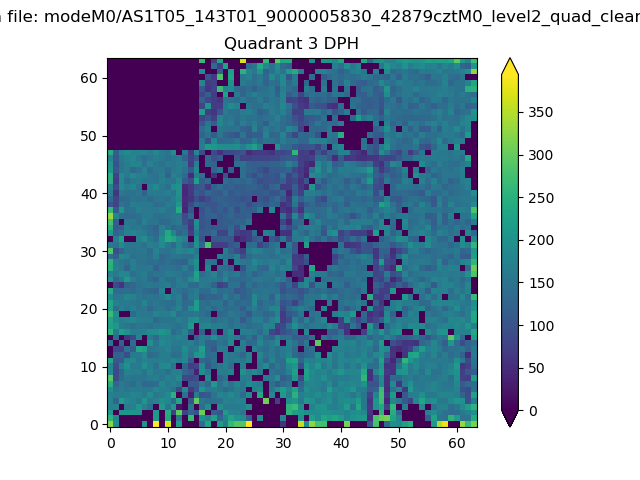 |
 |
Quadrant C |
| Plot type | Count rate plots | Images |
|---|---|---|
| Comparison with Poisson distribution Blue bars denote a histogram of data divided into 1 sec bins. Red curve is a Poisson curve with rate = median count rate of data. |
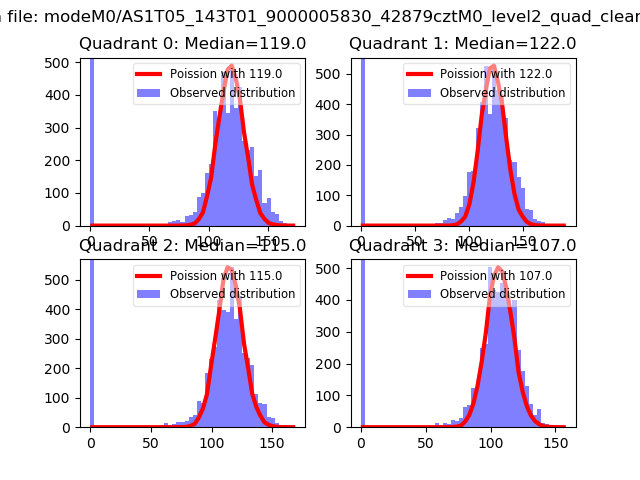 |
 |
| Quadrant-wise count rates Data is divided into 100 sec bins |
 |
|
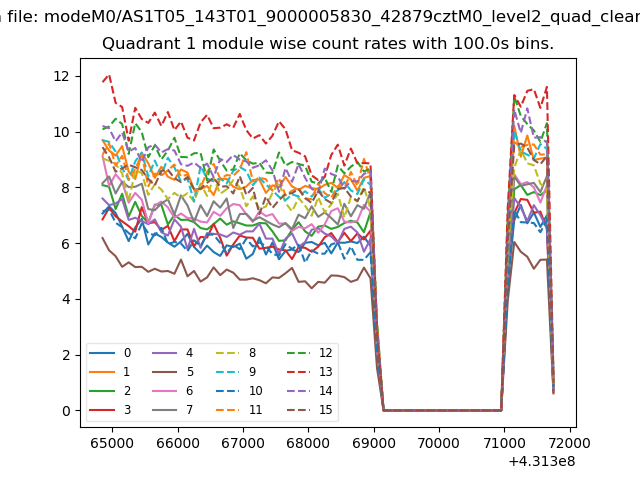
| Module-wise count rates for Quadrant A Data is divided into 100 sec bins |
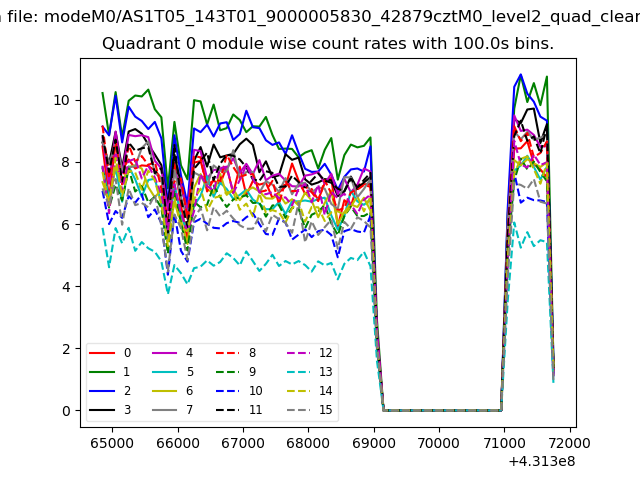 |
 |
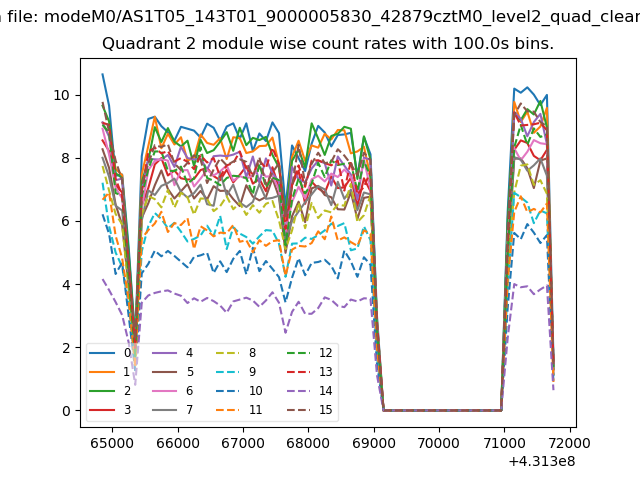
| Module-wise count rates for Quadrant B Data is divided into 100 sec bins |
 |
 |
| Module-wise count rates for Quadrant C Data is divided into 100 sec bins |
 |
 |
| Module-wise count rates for Quadrant D Data is divided into 100 sec bins |
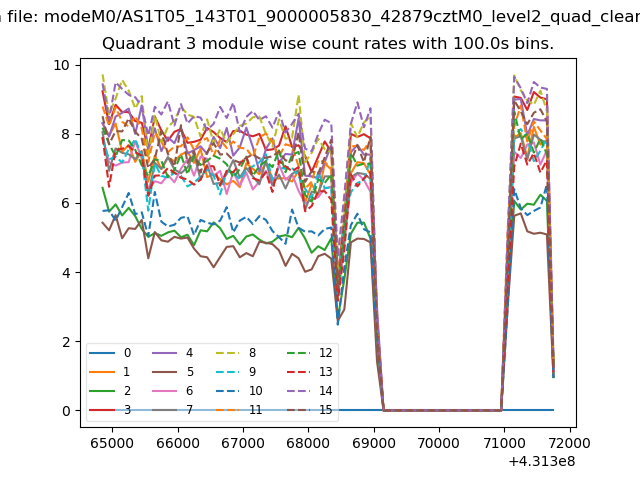 |
 |
| Parameter | Plot |
|---|---|
| CZT HV Monitor | 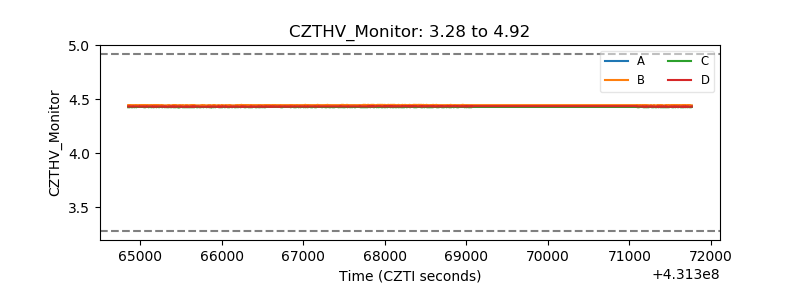 |
| D_VDD | 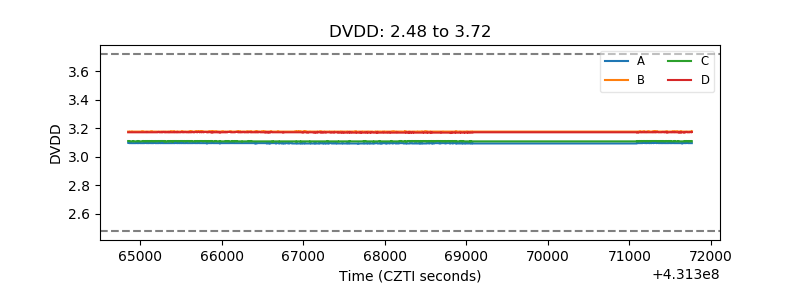 |
| Temperature 1 | 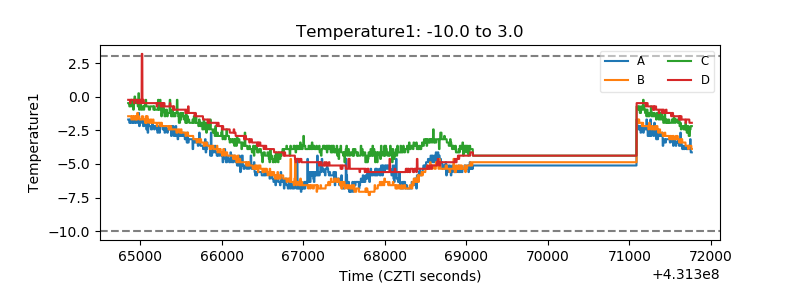 |
| Veto HV Monitor |  |
| Veto LLD | 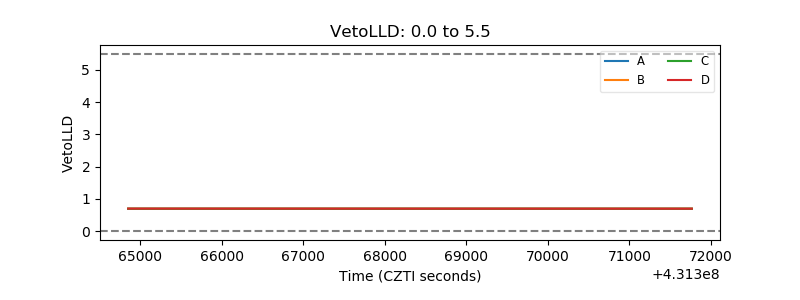 |
| Alpha Counter |  |
| _CPM_Rate | 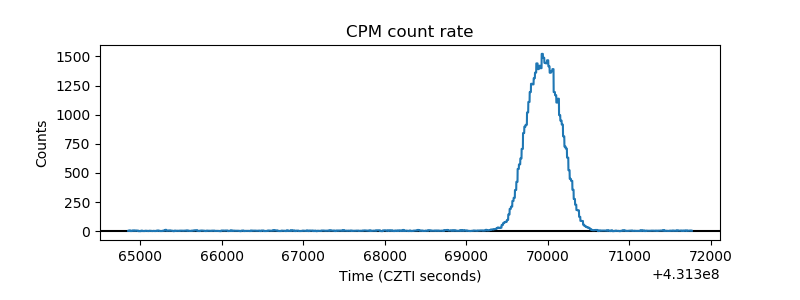 |
| CZT Counter | 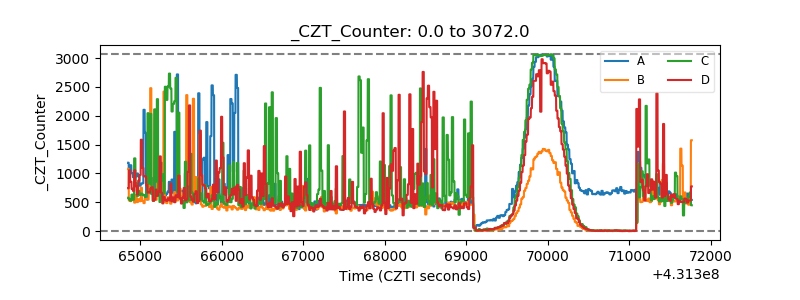 |
| +2.5 Volts monitor | 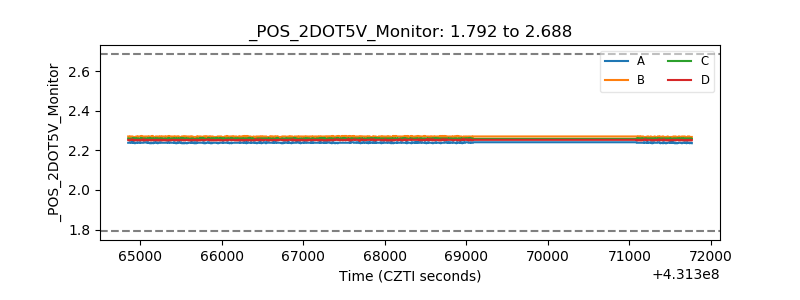 |
| +5 Volts monitor | 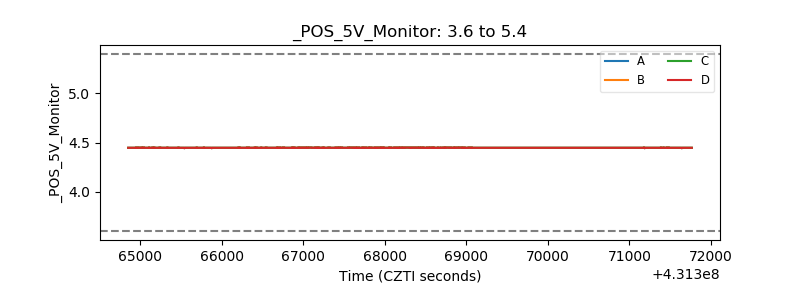 |
| _ROLL_ROT | 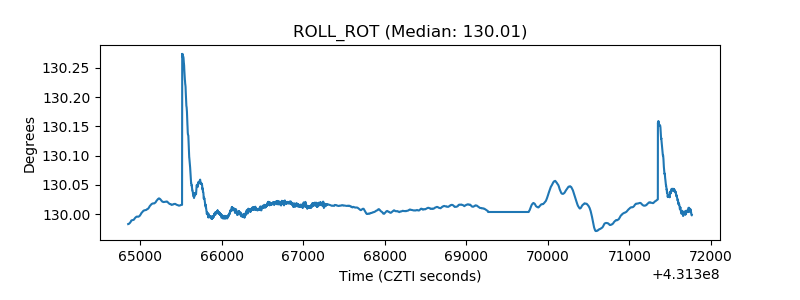 |
| _Roll_DEC | 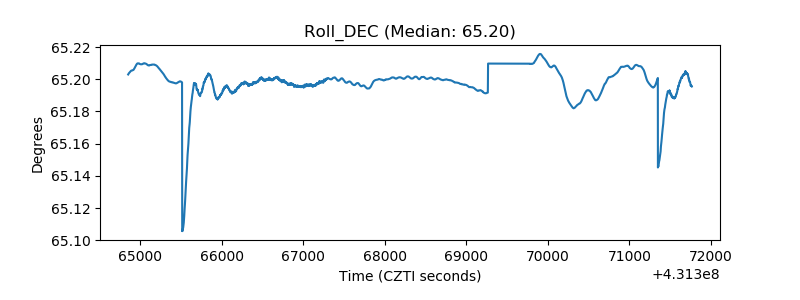 |
| _Roll_RA | 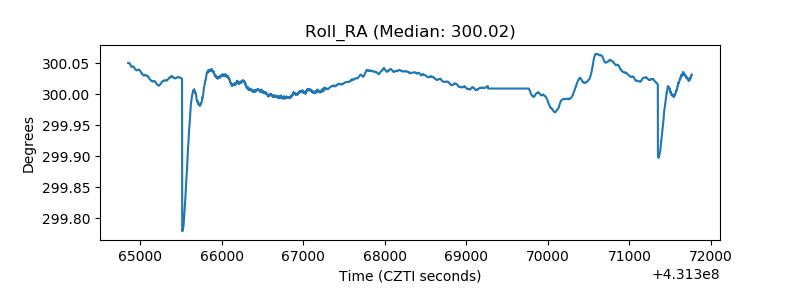 |
| Veto Counter | 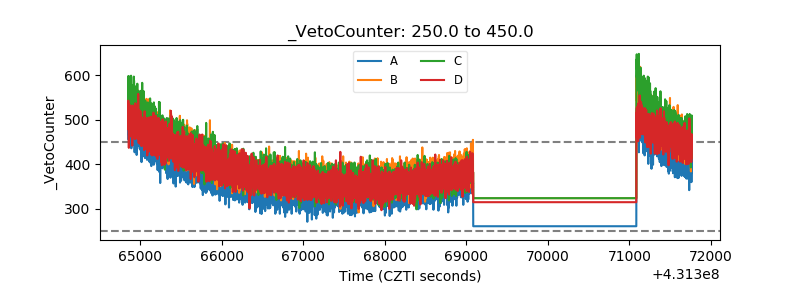 |