| Param | Original file | Final file |
|---|---|---|
| Filename | modeM0/AS1T05_143T01_9000005830_42880cztM0_level2.fits | modeM0/AS1T05_143T01_9000005830_42880cztM0_level2_quad_clean.evt |
| Size (bytes) | 324,829,440 | 85,446,720 |
| Size | 309.8 MB | 81.5 MB |
| Events in quadrant A | 2,881,250 | 581,398 |
| Events in quadrant B | 2,460,820 | 598,408 |
| Events in quadrant C | 2,680,207 | 571,278 |
| Events in quadrant D | 3,619,123 | 491,992 |
| Mode M0 | |||
|---|---|---|---|
| Quadrant | BADHDUFLAG | Total packets | Discarded packets |
| A | 0 | 11625 | 2 |
| B | 0 | 10684 | 2 |
| C | 0 | 11035 | 2 |
| D | 0 | 14198 | 2 |
| Mode M9 | |||
|---|---|---|---|
| Quadrant | BADHDUFLAG | Total packets | Discarded packets |
| A | 0 | 33 | 0 |
| B | 0 | 34 | 0 |
| C | 0 | 34 | 0 |
| D | 0 | 34 | 0 |
| Mode SS | |||
|---|---|---|---|
| Quadrant | BADHDUFLAG | Total packets | Discarded packets |
| A | 0 | 100 | 0 |
| B | 0 | 100 | 0 |
| C | 0 | 100 | 0 |
| D | 0 | 100 | 0 |
| Quadrant | Total seconds | Saturated seconds | Saturation percentage |
|---|---|---|---|
| A | 4910 | 65 | 1.323829% |
| B | 4910 | 35 | 0.712831% |
| C | 4910 | 46 | 0.936864% |
| D | 4910 | 421 | 8.574338% |
Noise dominated data is calculated using 1-second bins in cleaned event files. If a bin has >2000 counts, and if more than 50% of those come from <1% of pixels, then it is considered to be noise-dominated and hence unusable.
| Quadrant | # 1 sec bins | Bins with >0 counts | Bins with >2000 counts | High rate bins dominated by noise | Noise dominated (total time) | Noise dominated (detector-on time) | Marked lightcurve |
|---|---|---|---|---|---|---|---|
| A | 7002 | 4911 | 45 | 45 | 0.64% | 0.92% | 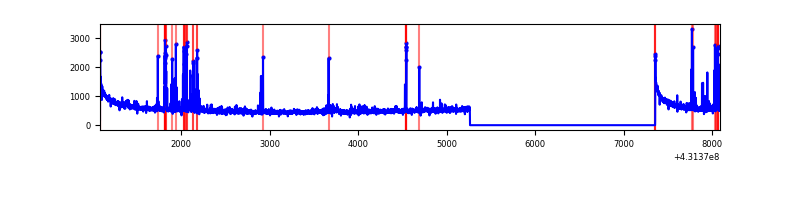 |
| B | 7002 | 4911 | 23 | 23 | 0.33% | 0.47% |  |
| C | 7002 | 4911 | 40 | 40 | 0.57% | 0.81% | 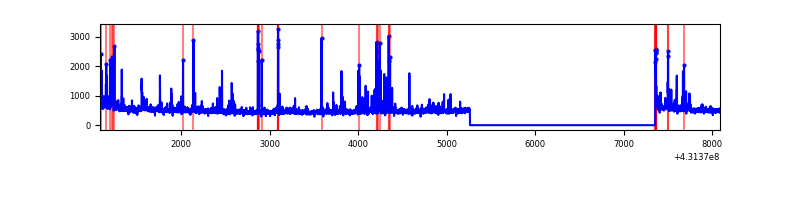 |
| D | 7002 | 4911 | 393 | 393 | 5.61% | 8.00% | 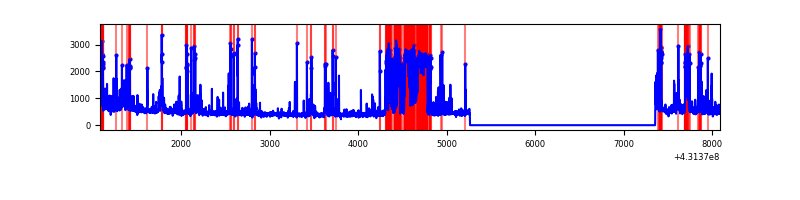 |
Top three noisy pixels from each quadrant. If the there are fewer than three noisy pixels in the level2.evt file, extra rows are filled as -1
| Pixel properties | Quadrant properties | ||||||
|---|---|---|---|---|---|---|---|
| Quadrant | DetID | PixID | Counts | Sigma | Mean | Median | Sigma |
| A | 10 | 83 | 561718 | 5105.6 | 537 | 528 | 109.9 |
| A | 15 | 237 | 191551 | 1737.89 | 537 | 528 | 109.9 |
| A | 13 | 248 | 33411 | 299.16 | 537 | 528 | 109.9 |
| B | 3 | 112 | 77207 | 744.16 | 540 | 525 | 103.0 |
| B | 0 | 190 | 77006 | 742.2 | 540 | 525 | 103.0 |
| B | 0 | 229 | 69516 | 669.52 | 540 | 525 | 103.0 |
| C | 15 | 214 | 197386 | 1587.69 | 535 | 538 | 124.0 |
| C | 12 | 2 | 152337 | 1224.35 | 535 | 538 | 124.0 |
| C | 0 | 207 | 140024 | 1125.03 | 535 | 538 | 124.0 |
| D | 2 | 249 | 824871 | 6677.6 | 509 | 495 | 123.5 |
| D | 1 | 52 | 193151 | 1560.55 | 509 | 495 | 123.5 |
| D | 10 | 118 | 150644 | 1216.23 | 509 | 495 | 123.5 |
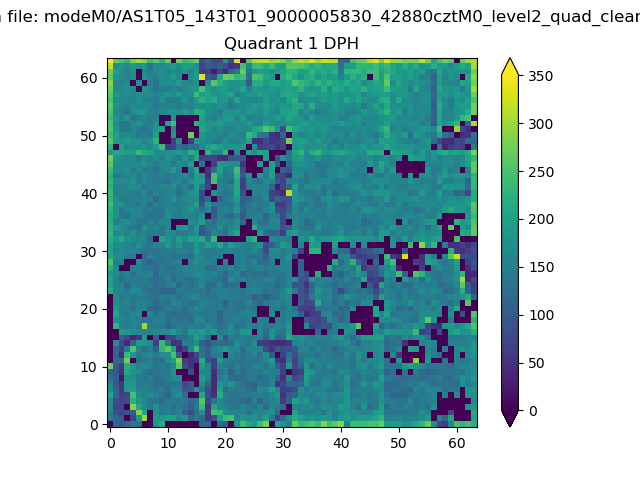
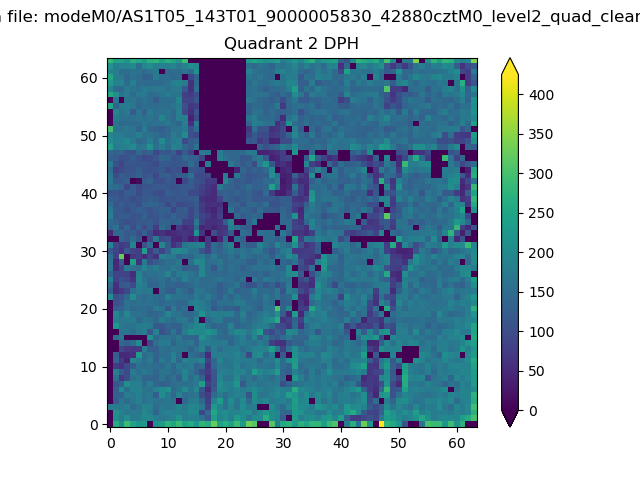
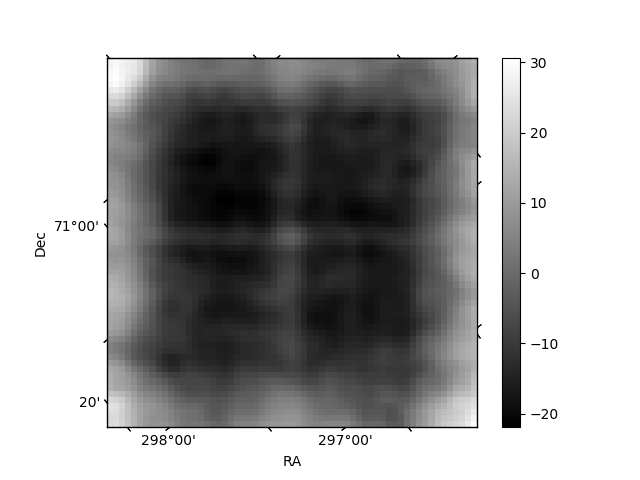
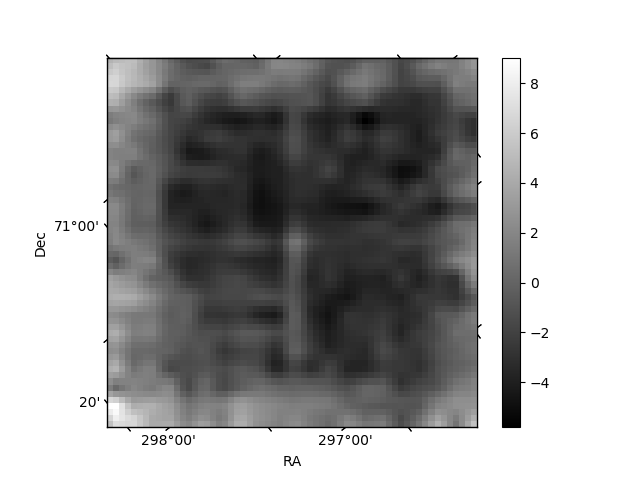
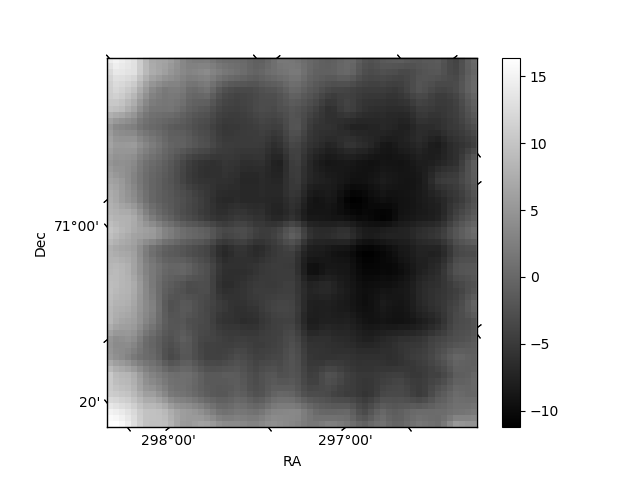
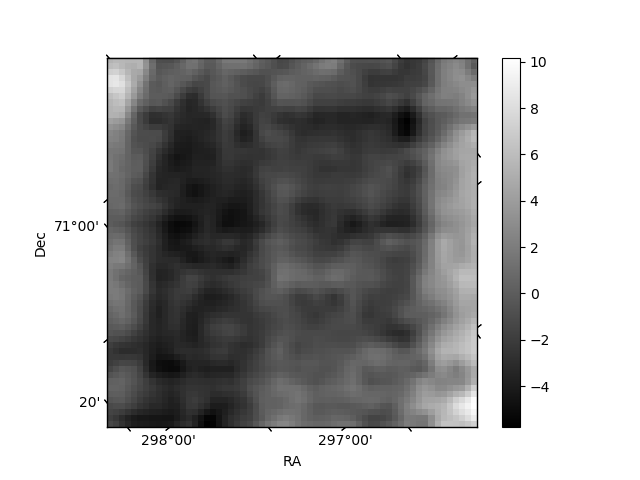
Histogram calculated using DETX and DETY for each event in the final _common_clean file
| Quadrant A | 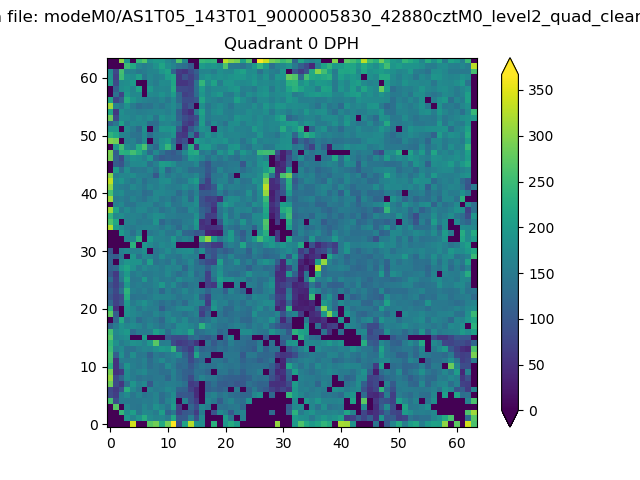 |
 |
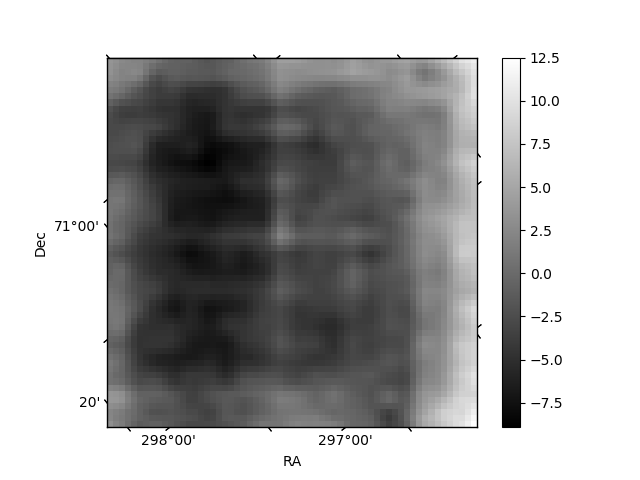
Quadrant B |
|---|---|---|---|
| Quadrant D | 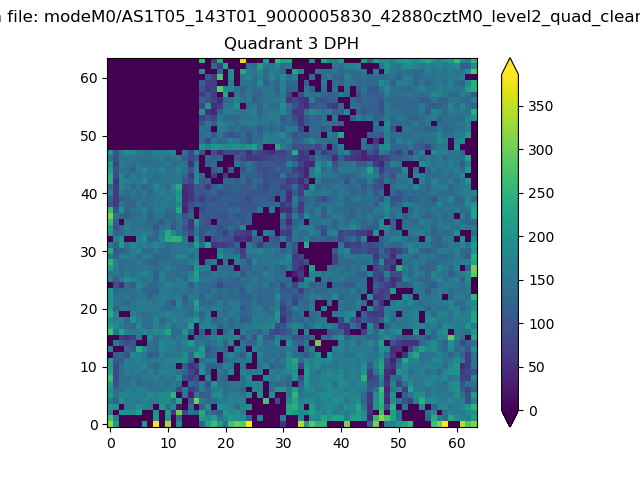 |
 |
Quadrant C |
| Plot type | Count rate plots | Images |
|---|---|---|
| Comparison with Poisson distribution Blue bars denote a histogram of data divided into 1 sec bins. Red curve is a Poisson curve with rate = median count rate of data. |
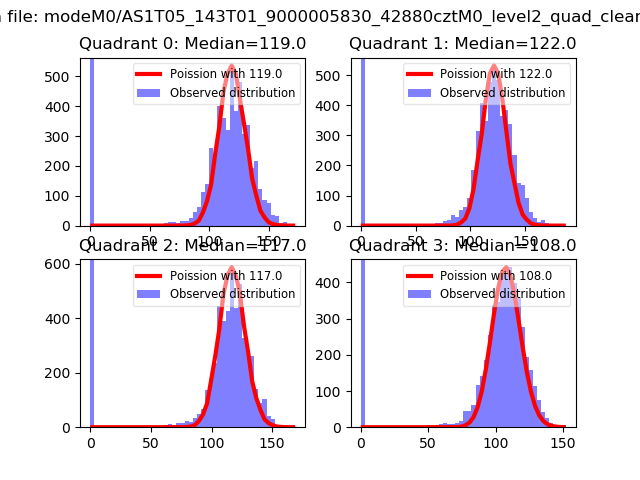 |
 |
| Quadrant-wise count rates Data is divided into 100 sec bins |
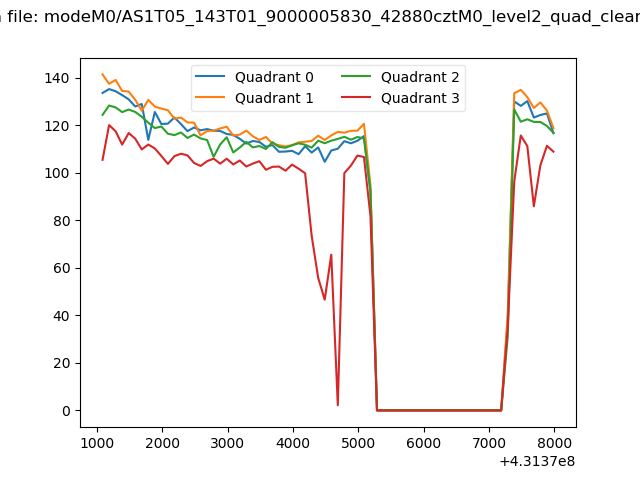 |
|
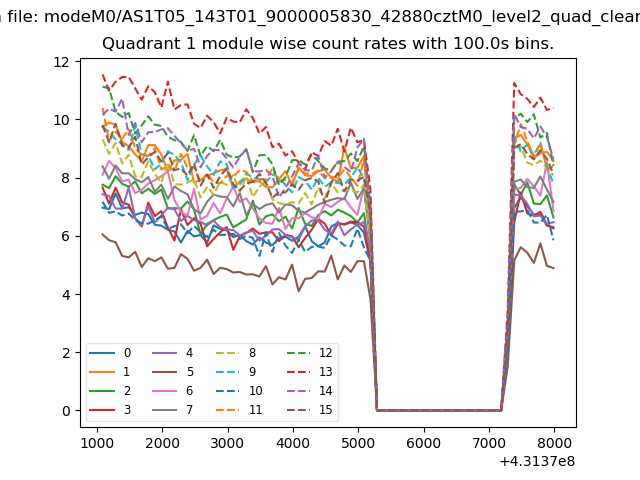
| Module-wise count rates for Quadrant A Data is divided into 100 sec bins |
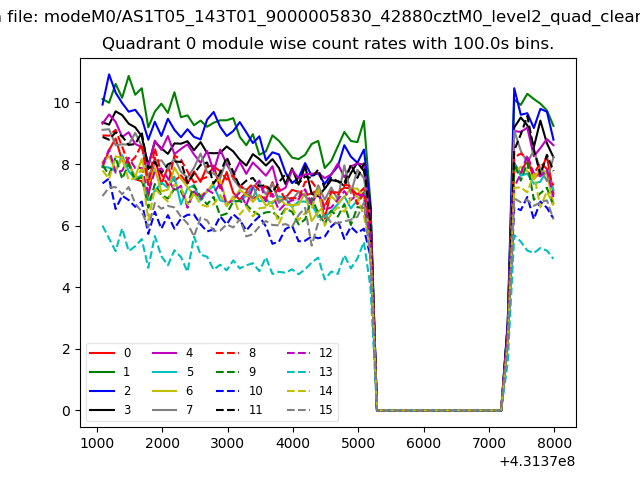 |
 |
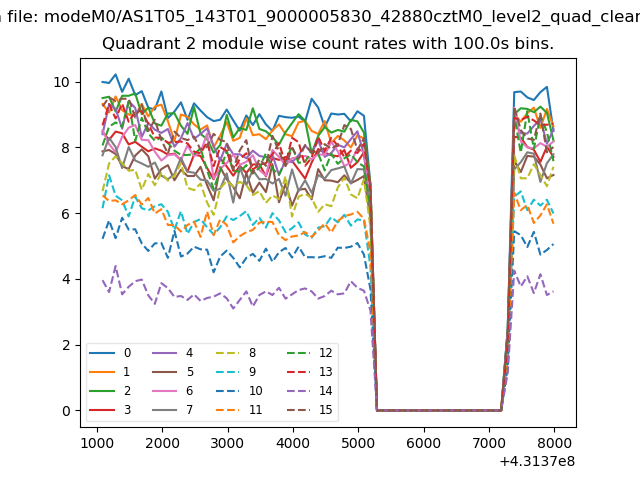
| Module-wise count rates for Quadrant B Data is divided into 100 sec bins |
 |
 |
| Module-wise count rates for Quadrant C Data is divided into 100 sec bins |
 |
 |
| Module-wise count rates for Quadrant D Data is divided into 100 sec bins |
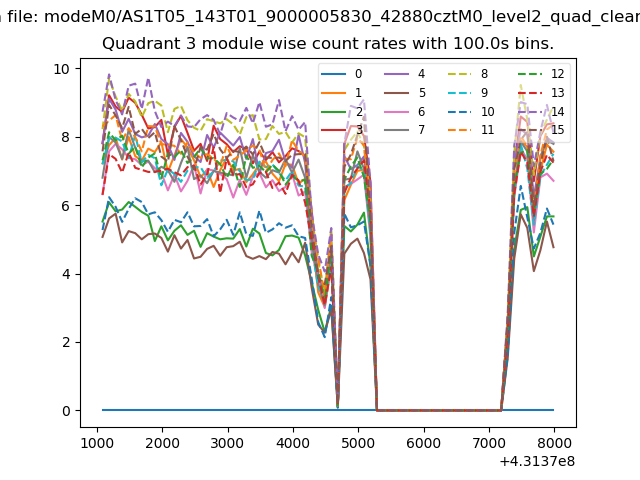 |
 |
| Parameter | Plot |
|---|---|
| CZT HV Monitor | 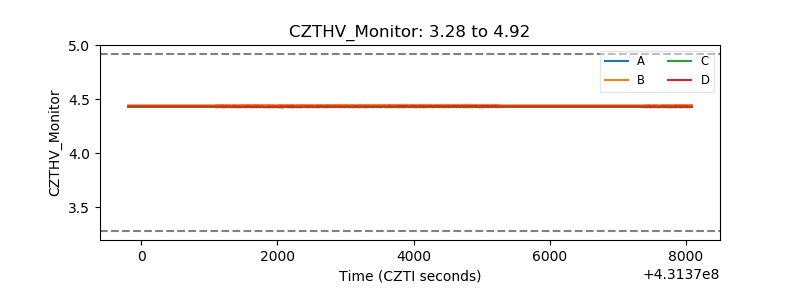 |
| D_VDD | 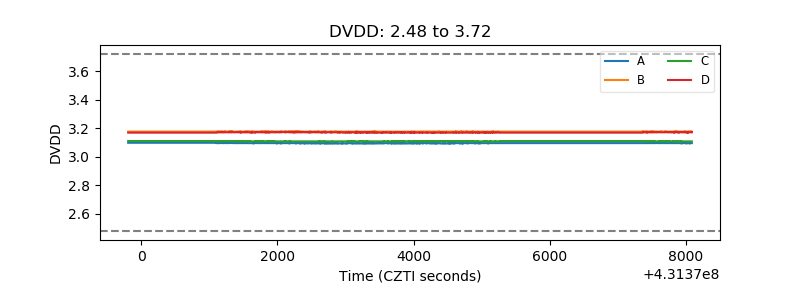 |
| Temperature 1 | 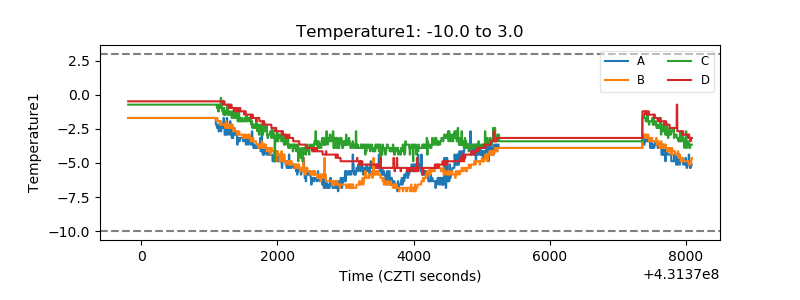 |
| Veto HV Monitor | 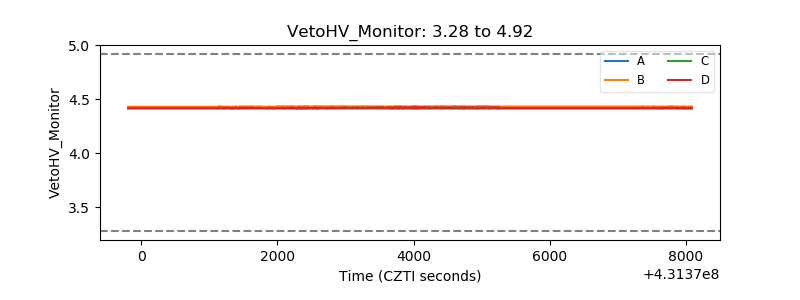 |
| Veto LLD | 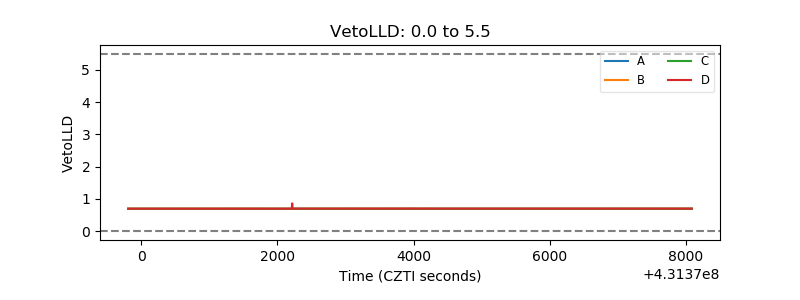 |
| Alpha Counter | 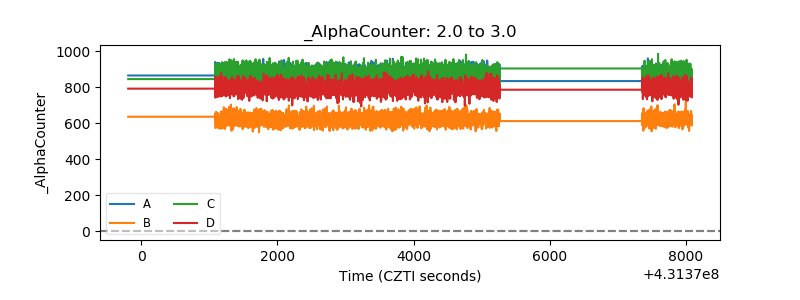 |
| _CPM_Rate | 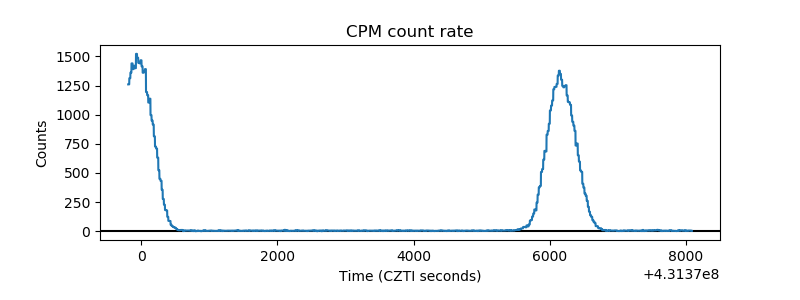 |
| CZT Counter | 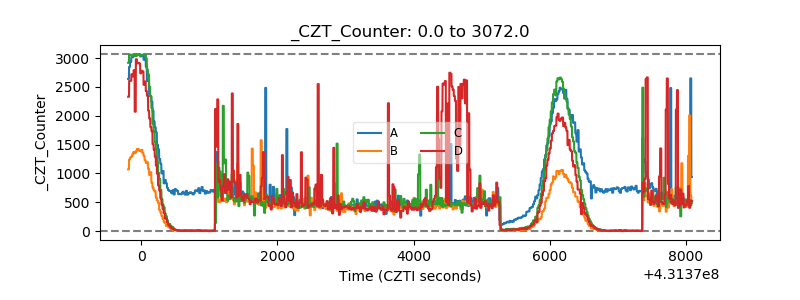 |
| +2.5 Volts monitor | 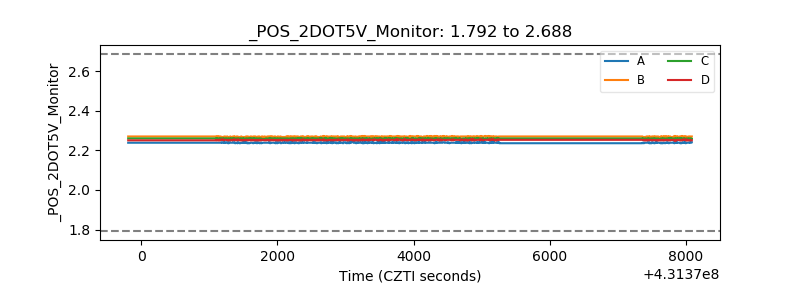 |
| +5 Volts monitor | 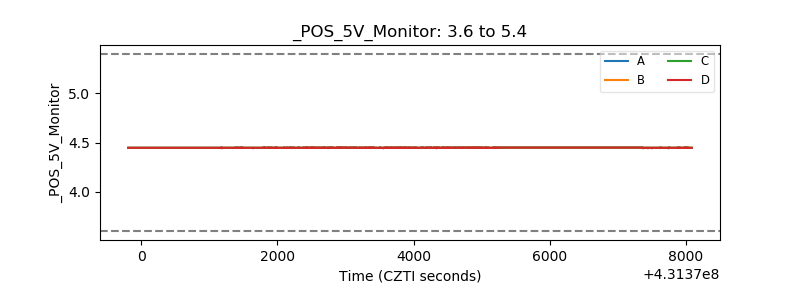 |
| _ROLL_ROT | 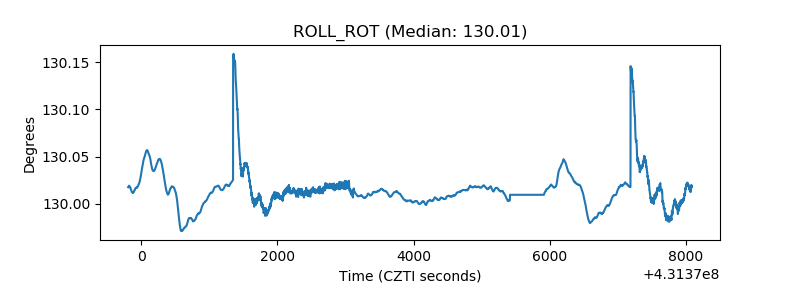 |
| _Roll_DEC | 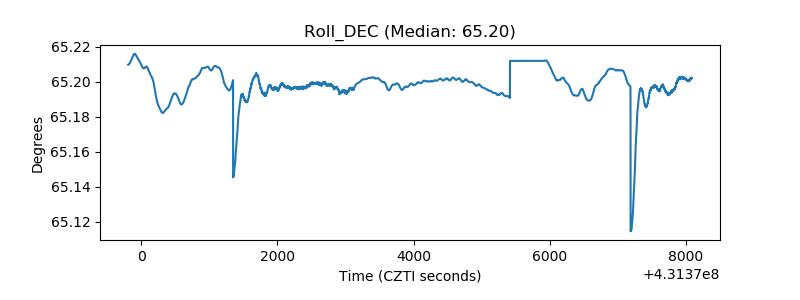 |
| _Roll_RA | 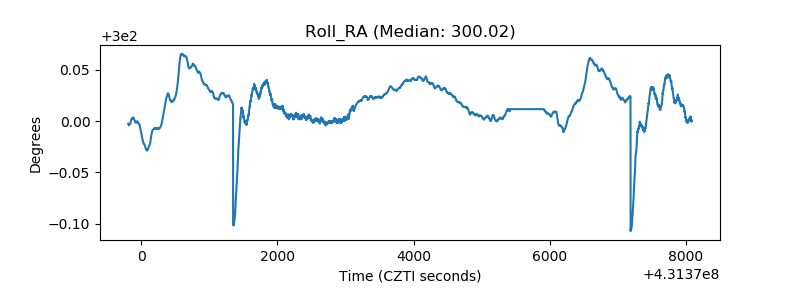 |
| Veto Counter | 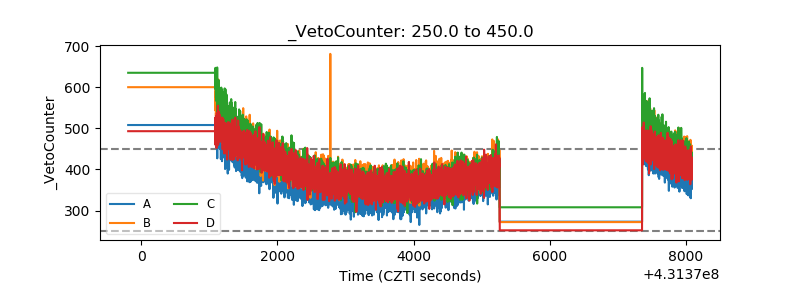 |