| Param | Original file | Final file |
|---|---|---|
| Filename | modeM0/AS1T05_143T01_9000005830_42881cztM0_level2.fits | modeM0/AS1T05_143T01_9000005830_42881cztM0_level2_quad_clean.evt |
| Size (bytes) | 324,374,400 | 83,966,400 |
| Size | 309.3 MB | 80.1 MB |
| Events in quadrant A | 2,845,374 | 563,310 |
| Events in quadrant B | 2,316,397 | 583,269 |
| Events in quadrant C | 2,537,632 | 559,323 |
| Events in quadrant D | 3,923,956 | 491,179 |
| Mode M0 | |||
|---|---|---|---|
| Quadrant | BADHDUFLAG | Total packets | Discarded packets |
| A | 0 | 11547 | 2 |
| B | 0 | 10386 | 2 |
| C | 0 | 10664 | 2 |
| D | 0 | 15067 | 2 |
| Mode M9 | |||
|---|---|---|---|
| Quadrant | BADHDUFLAG | Total packets | Discarded packets |
| A | 0 | 35 | 0 |
| B | 0 | 36 | 0 |
| C | 0 | 36 | 0 |
| D | 0 | 36 | 0 |
| Mode SS | |||
|---|---|---|---|
| Quadrant | BADHDUFLAG | Total packets | Discarded packets |
| A | 0 | 100 | 0 |
| B | 0 | 100 | 0 |
| C | 0 | 100 | 0 |
| D | 0 | 100 | 0 |
| Quadrant | Total seconds | Saturated seconds | Saturation percentage |
|---|---|---|---|
| A | 4925 | 72 | 1.461929% |
| B | 4925 | 22 | 0.446701% |
| C | 4925 | 21 | 0.426396% |
| D | 4925 | 341 | 6.923858% |
Noise dominated data is calculated using 1-second bins in cleaned event files. If a bin has >2000 counts, and if more than 50% of those come from <1% of pixels, then it is considered to be noise-dominated and hence unusable.
| Quadrant | # 1 sec bins | Bins with >0 counts | Bins with >2000 counts | High rate bins dominated by noise | Noise dominated (total time) | Noise dominated (detector-on time) | Marked lightcurve |
|---|---|---|---|---|---|---|---|
| A | 7078 | 4926 | 41 | 41 | 0.58% | 0.83% | 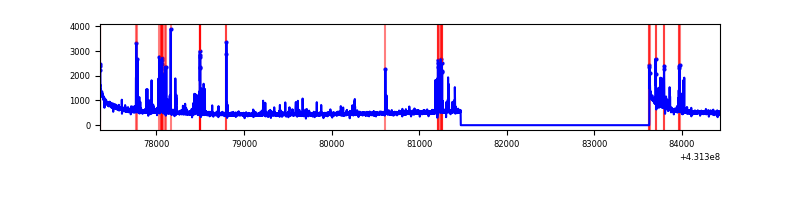 |
| B | 7078 | 4926 | 18 | 18 | 0.25% | 0.37% | 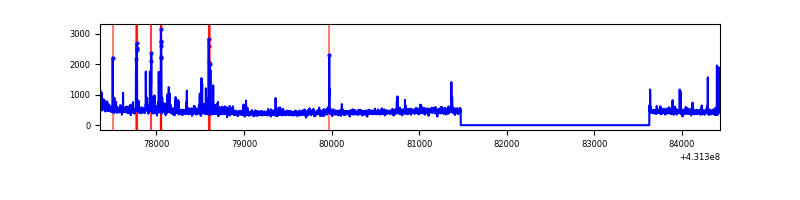 |
| C | 7078 | 4926 | 18 | 18 | 0.25% | 0.37% | 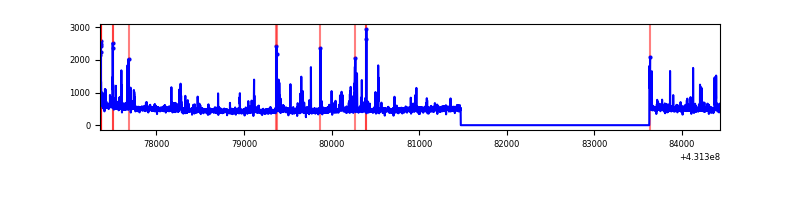 |
| D | 7078 | 4926 | 346 | 346 | 4.89% | 7.02% | 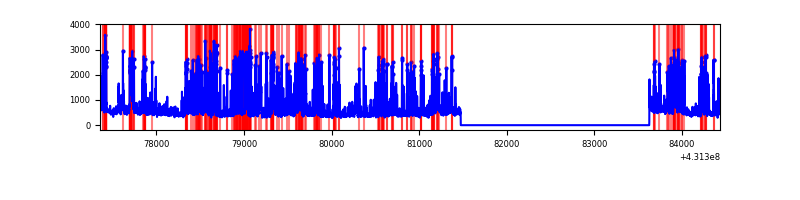 |
Top three noisy pixels from each quadrant. If the there are fewer than three noisy pixels in the level2.evt file, extra rows are filled as -1
| Pixel properties | Quadrant properties | ||||||
|---|---|---|---|---|---|---|---|
| Quadrant | DetID | PixID | Counts | Sigma | Mean | Median | Sigma |
| A | 10 | 83 | 546711 | 5113.21 | 523 | 512 | 106.8 |
| A | 15 | 237 | 185183 | 1728.79 | 523 | 512 | 106.8 |
| A | 13 | 248 | 51604 | 478.29 | 523 | 512 | 106.8 |
| B | 3 | 112 | 101931 | 1000.89 | 529 | 514 | 101.3 |
| B | 0 | 190 | 36538 | 355.52 | 529 | 514 | 101.3 |
| B | 5 | 255 | 32620 | 316.85 | 529 | 514 | 101.3 |
| C | 15 | 214 | 199221 | 1631.84 | 524 | 529 | 121.8 |
| C | 12 | 2 | 103399 | 844.86 | 524 | 529 | 121.8 |
| C | 14 | 254 | 83149 | 678.55 | 524 | 529 | 121.8 |
| D | 1 | 52 | 1188315 | 9795.73 | 501 | 488 | 121.3 |
| D | 13 | 249 | 271036 | 2231.15 | 501 | 488 | 121.3 |
| D | 12 | 6 | 158844 | 1305.92 | 501 | 488 | 121.3 |
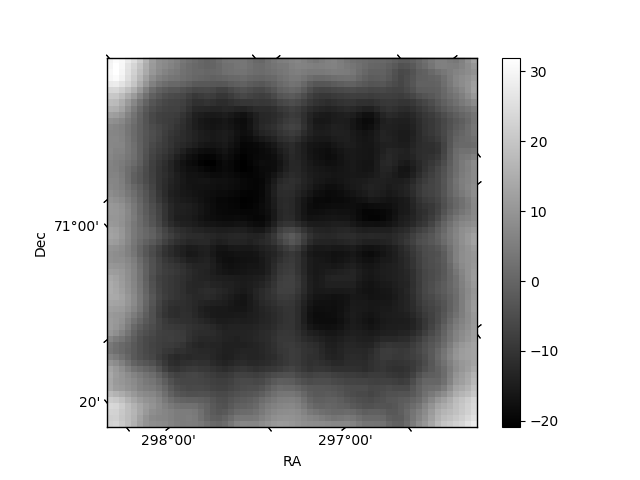
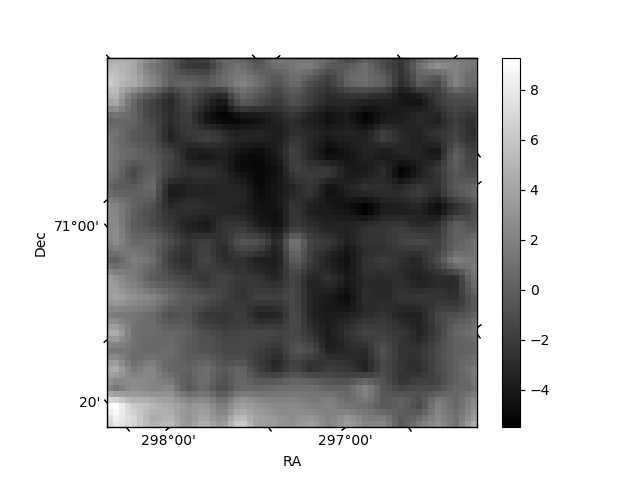
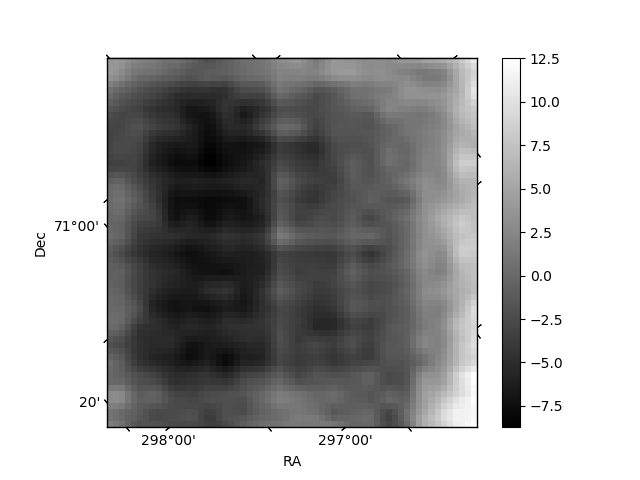
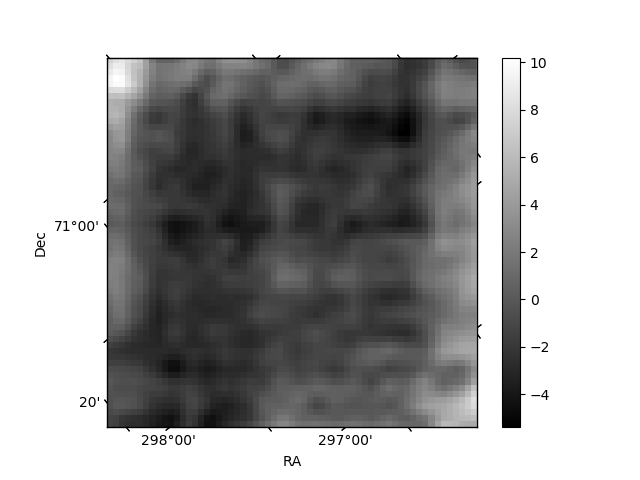
Histogram calculated using DETX and DETY for each event in the final _common_clean file
| Quadrant A | 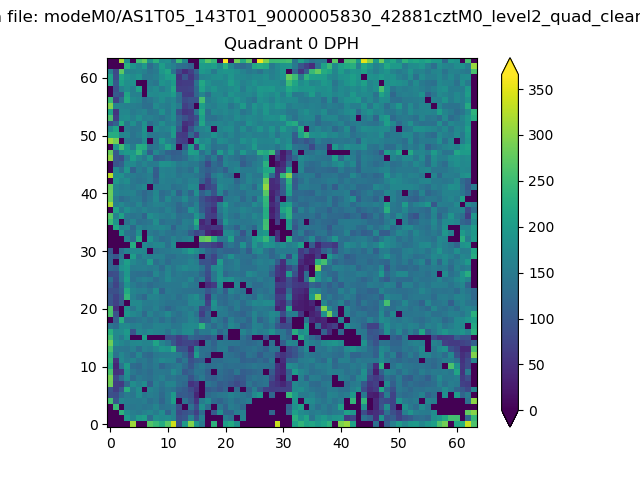 |
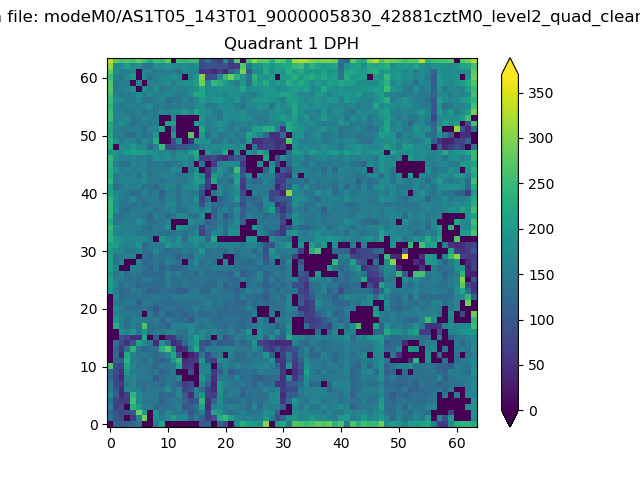 |
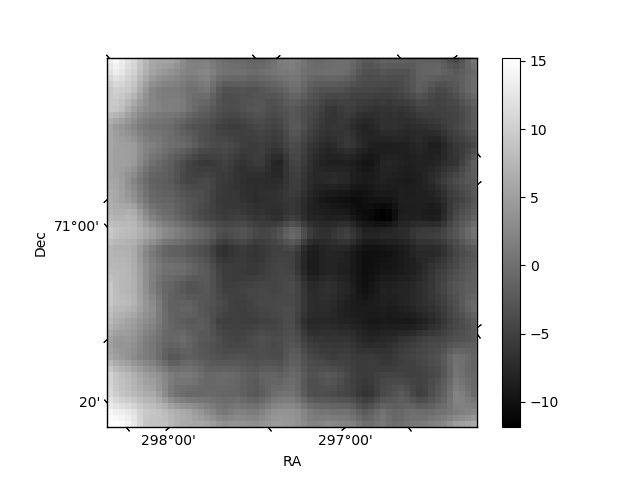
Quadrant B |
|---|---|---|---|
| Quadrant D | 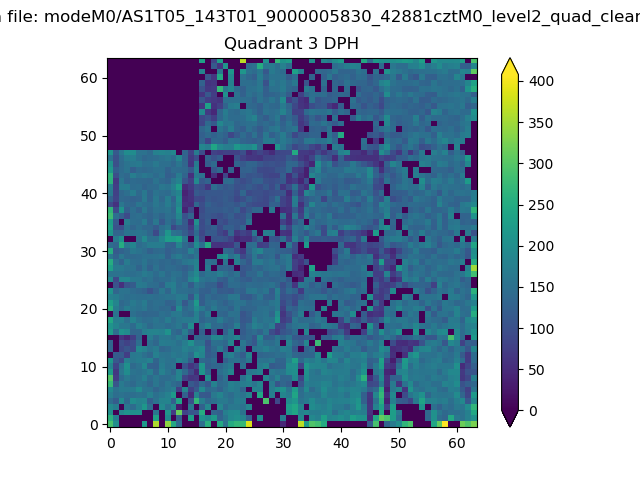 |
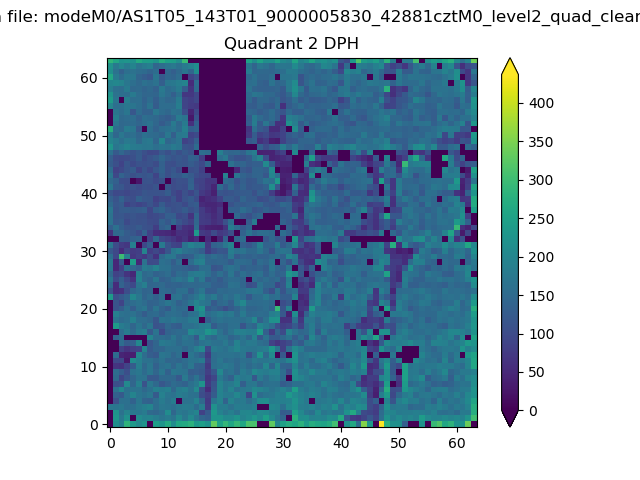 |
Quadrant C |
| Plot type | Count rate plots | Images |
|---|---|---|
| Comparison with Poisson distribution Blue bars denote a histogram of data divided into 1 sec bins. Red curve is a Poisson curve with rate = median count rate of data. |
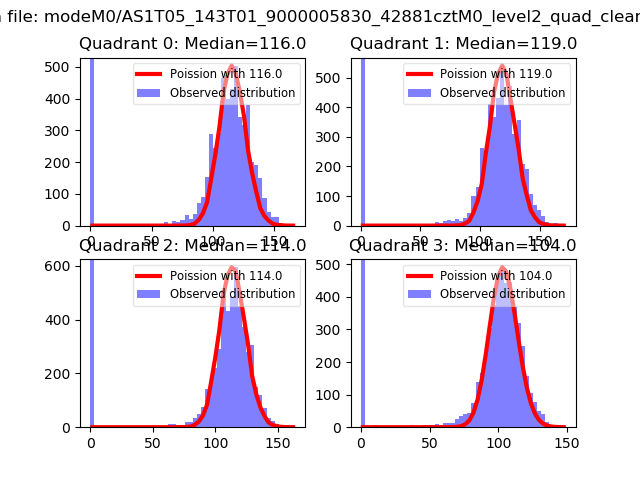 |
 |
| Quadrant-wise count rates Data is divided into 100 sec bins |
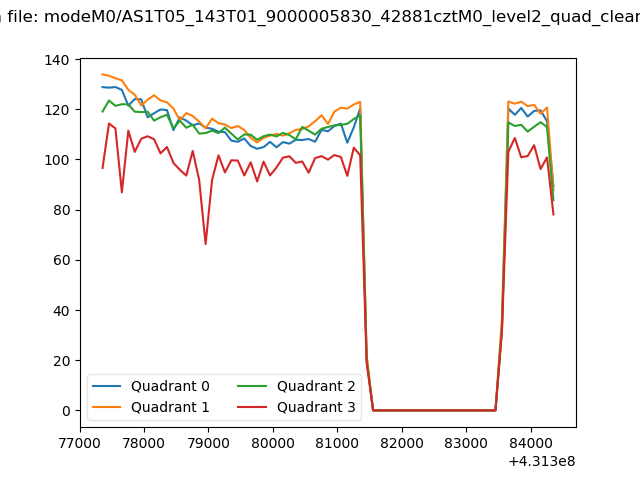 |
|
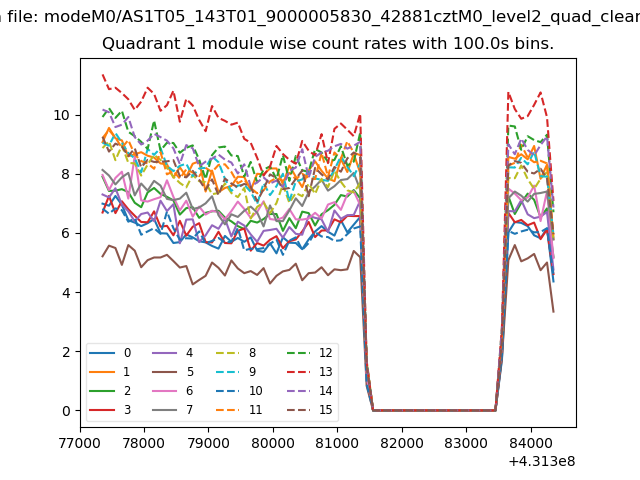
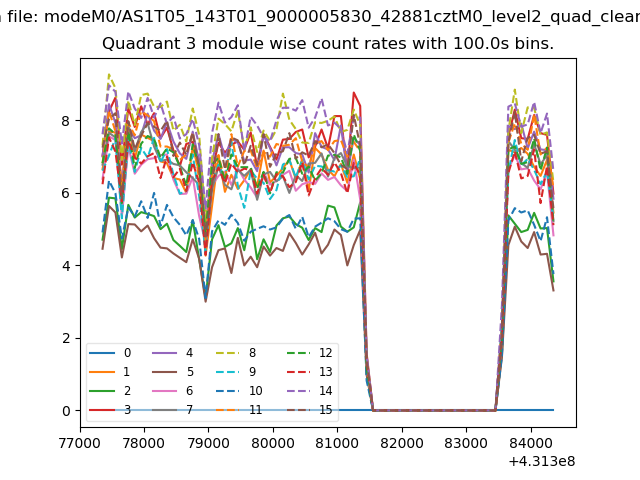
| Module-wise count rates for Quadrant A Data is divided into 100 sec bins |
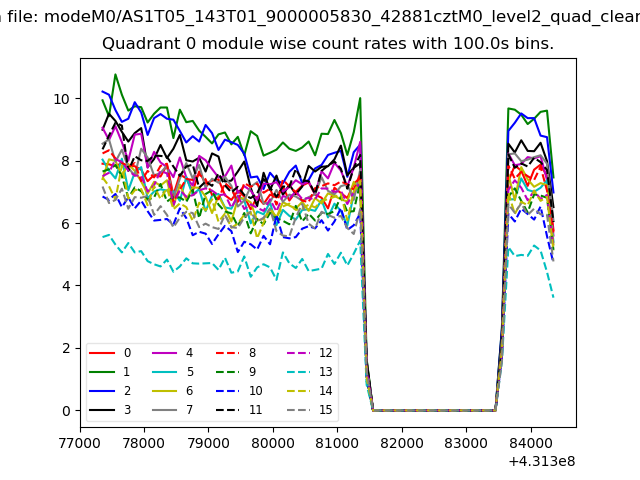 |
 |
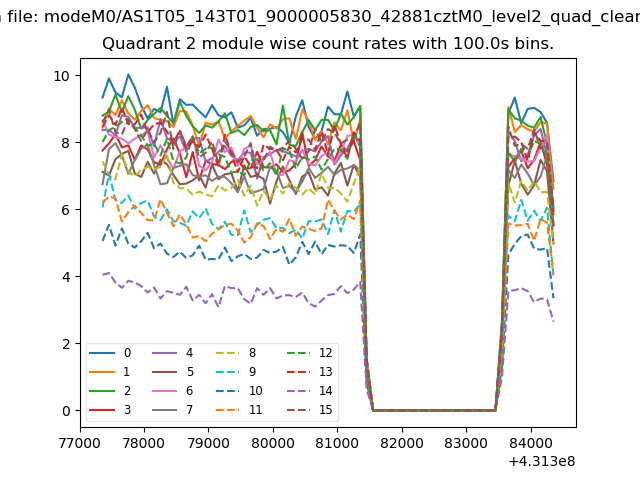
| Module-wise count rates for Quadrant B Data is divided into 100 sec bins |
 |
 |
| Module-wise count rates for Quadrant C Data is divided into 100 sec bins |
 |
 |
| Module-wise count rates for Quadrant D Data is divided into 100 sec bins |
 |
 |
| Parameter | Plot |
|---|---|
| CZT HV Monitor | 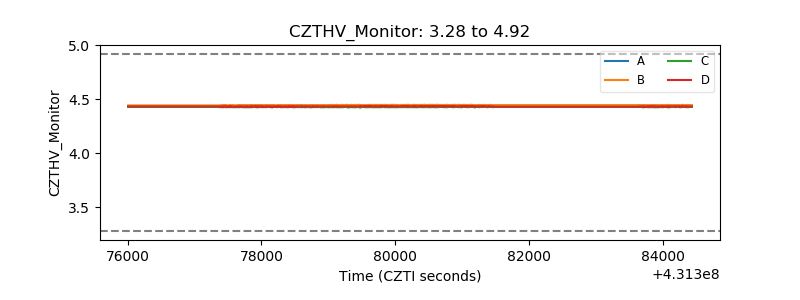 |
| D_VDD | 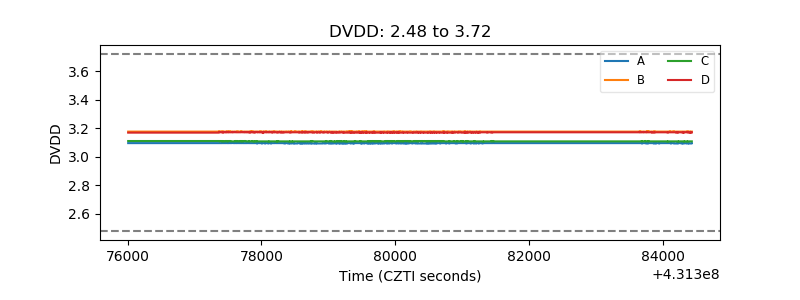 |
| Temperature 1 | 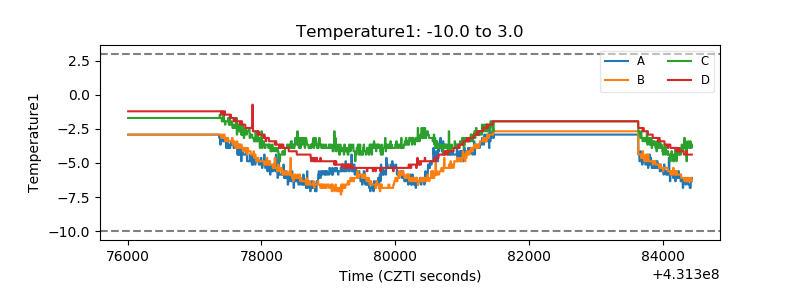 |
| Veto HV Monitor | 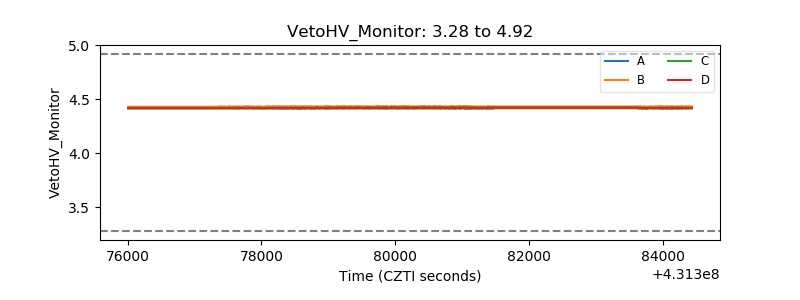 |
| Veto LLD | 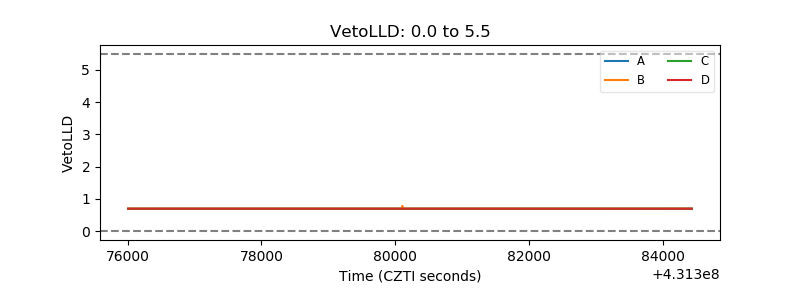 |
| Alpha Counter | 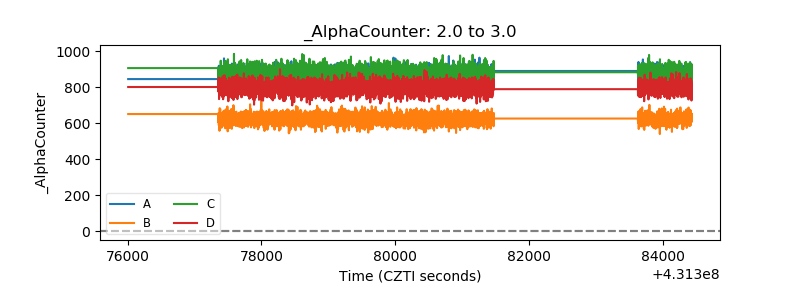 |
| _CPM_Rate | 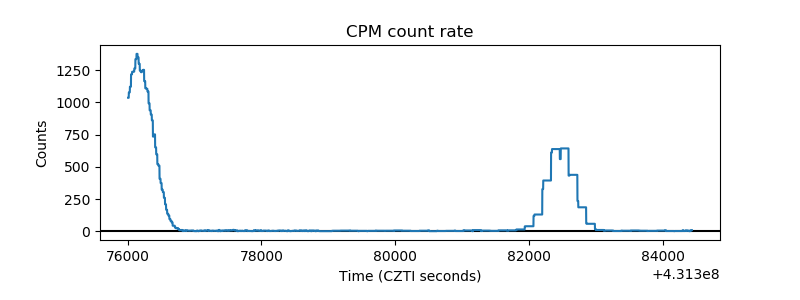 |
| CZT Counter | 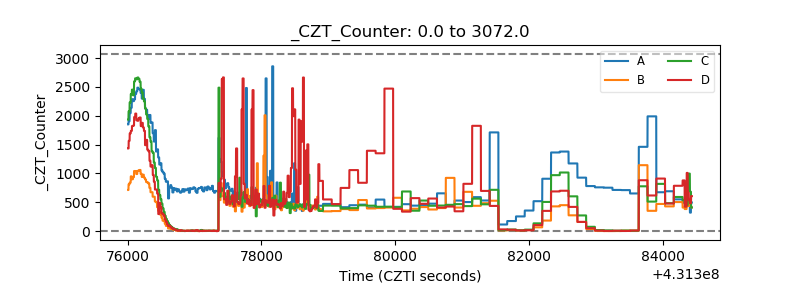 |
| +2.5 Volts monitor | 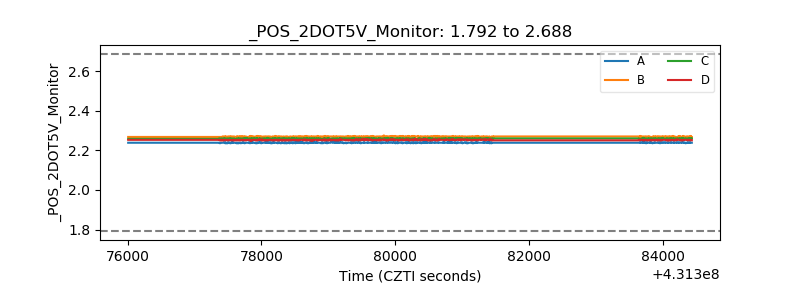 |
| +5 Volts monitor | 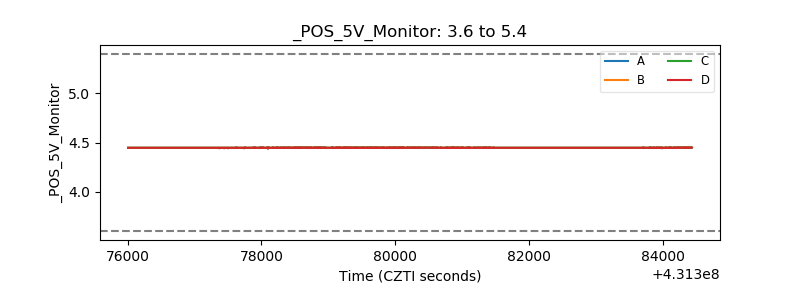 |
| _ROLL_ROT | 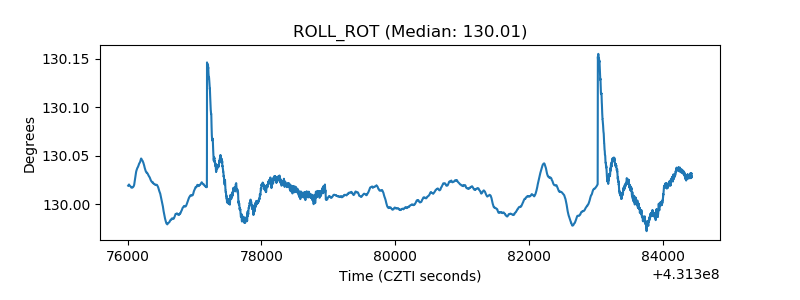 |
| _Roll_DEC | 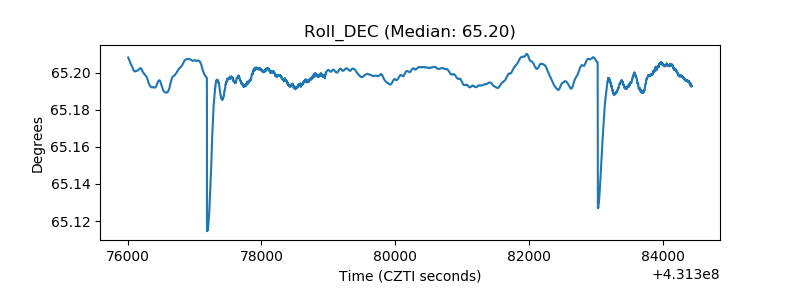 |
| _Roll_RA | 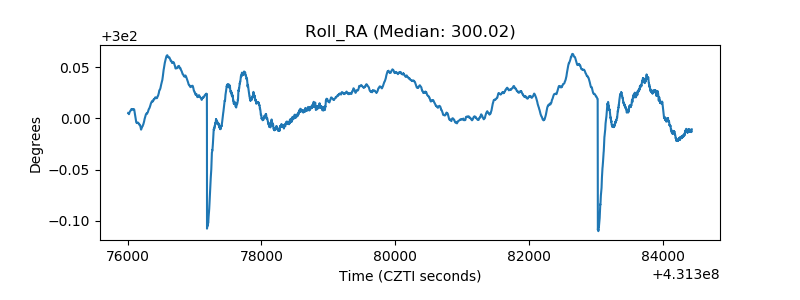 |
| Veto Counter | 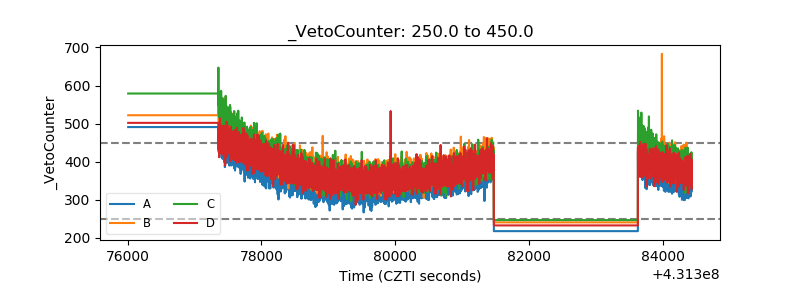 |