| Param | Original file | Final file |
|---|---|---|
| Filename | modeM0/AS1T05_143T01_9000005830_42882cztM0_level2.fits | modeM0/AS1T05_143T01_9000005830_42882cztM0_level2_quad_clean.evt |
| Size (bytes) | 331,536,960 | 81,316,800 |
| Size | 316.2 MB | 77.5 MB |
| Events in quadrant A | 2,714,216 | 544,517 |
| Events in quadrant B | 2,299,051 | 562,903 |
| Events in quadrant C | 2,726,916 | 536,747 |
| Events in quadrant D | 4,147,016 | 471,219 |
| Mode M0 | |||
|---|---|---|---|
| Quadrant | BADHDUFLAG | Total packets | Discarded packets |
| A | 0 | 11124 | 2 |
| B | 0 | 10471 | 2 |
| C | 0 | 11354 | 2 |
| D | 0 | 15748 | 2 |
| Mode M9 | |||
|---|---|---|---|
| Quadrant | BADHDUFLAG | Total packets | Discarded packets |
| A | 0 | 36 | 0 |
| B | 0 | 37 | 0 |
| C | 0 | 37 | 0 |
| D | 0 | 37 | 0 |
| Mode SS | |||
|---|---|---|---|
| Quadrant | BADHDUFLAG | Total packets | Discarded packets |
| A | 0 | 100 | 0 |
| B | 0 | 100 | 0 |
| C | 0 | 100 | 0 |
| D | 0 | 100 | 0 |
| Quadrant | Total seconds | Saturated seconds | Saturation percentage |
|---|---|---|---|
| A | 4946 | 45 | 0.909826% |
| B | 4946 | 35 | 0.707643% |
| C | 4946 | 38 | 0.768298% |
| D | 4946 | 377 | 7.622321% |
Noise dominated data is calculated using 1-second bins in cleaned event files. If a bin has >2000 counts, and if more than 50% of those come from <1% of pixels, then it is considered to be noise-dominated and hence unusable.
| Quadrant | # 1 sec bins | Bins with >0 counts | Bins with >2000 counts | High rate bins dominated by noise | Noise dominated (total time) | Noise dominated (detector-on time) | Marked lightcurve |
|---|---|---|---|---|---|---|---|
| A | 7039 | 4947 | 39 | 39 | 0.55% | 0.79% | 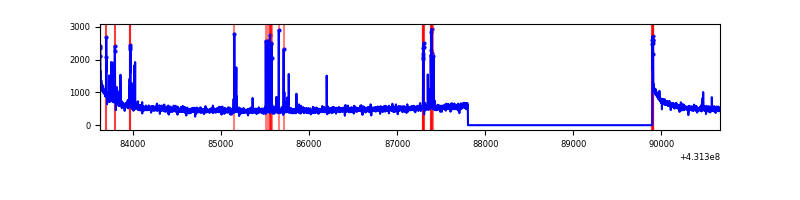 |
| B | 7039 | 4947 | 23 | 23 | 0.33% | 0.46% | 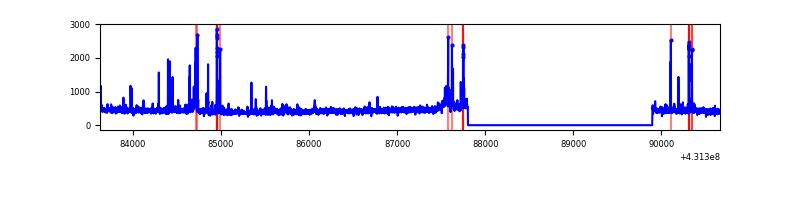 |
| C | 7039 | 4947 | 31 | 31 | 0.44% | 0.63% | 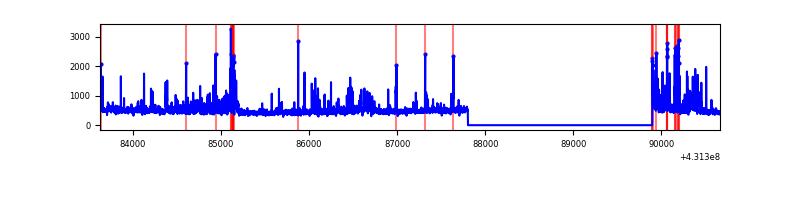 |
| D | 7039 | 4947 | 388 | 388 | 5.51% | 7.84% | 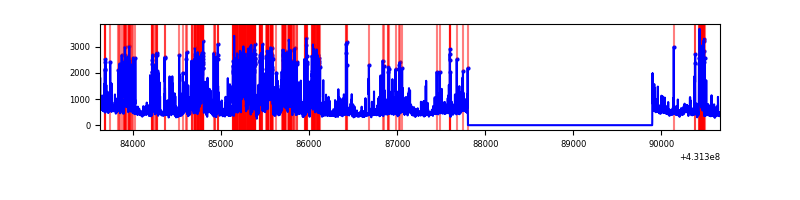 |
Top three noisy pixels from each quadrant. If the there are fewer than three noisy pixels in the level2.evt file, extra rows are filled as -1
| Pixel properties | Quadrant properties | ||||||
|---|---|---|---|---|---|---|---|
| Quadrant | DetID | PixID | Counts | Sigma | Mean | Median | Sigma |
| A | 10 | 83 | 531128 | 4986.76 | 515 | 504 | 106.4 |
| A | 15 | 237 | 136538 | 1278.44 | 515 | 504 | 106.4 |
| A | 2 | 79 | 28905 | 266.91 | 515 | 504 | 106.4 |
| B | 3 | 112 | 120182 | 1175.23 | 520 | 506 | 101.8 |
| B | 0 | 229 | 64665 | 630.05 | 520 | 506 | 101.8 |
| B | 5 | 172 | 19073 | 182.33 | 520 | 506 | 101.8 |
| C | 15 | 214 | 199077 | 1667.61 | 510 | 512 | 119.1 |
| C | 5 | 250 | 185128 | 1550.46 | 510 | 512 | 119.1 |
| C | 12 | 2 | 132028 | 1104.51 | 510 | 512 | 119.1 |
| D | 1 | 52 | 1354540 | 11382.82 | 490 | 477 | 119.0 |
| D | 12 | 6 | 330462 | 2773.99 | 490 | 477 | 119.0 |
| D | 1 | 47 | 257407 | 2159.86 | 490 | 477 | 119.0 |
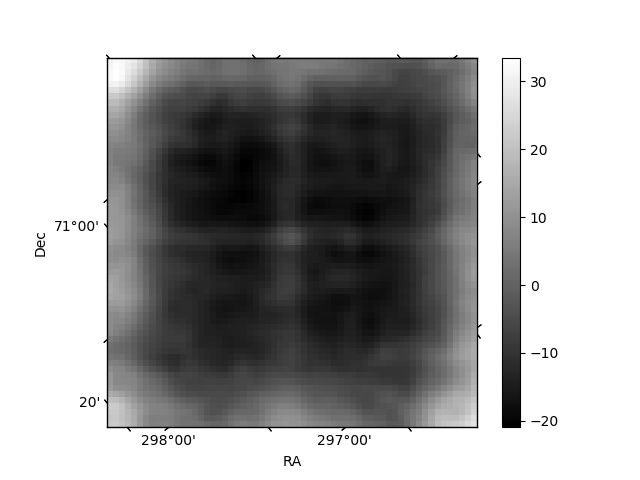
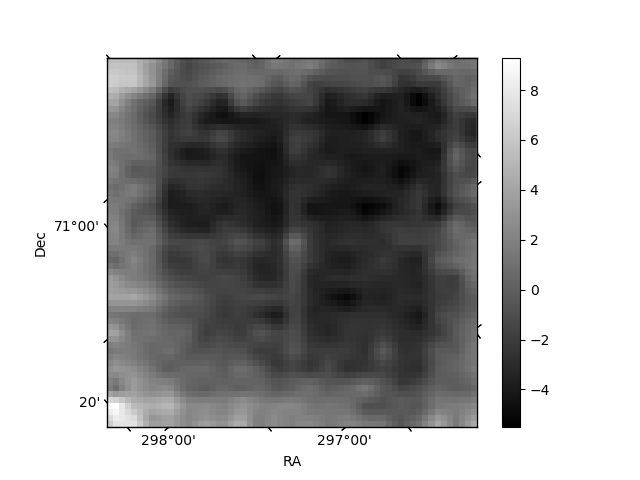
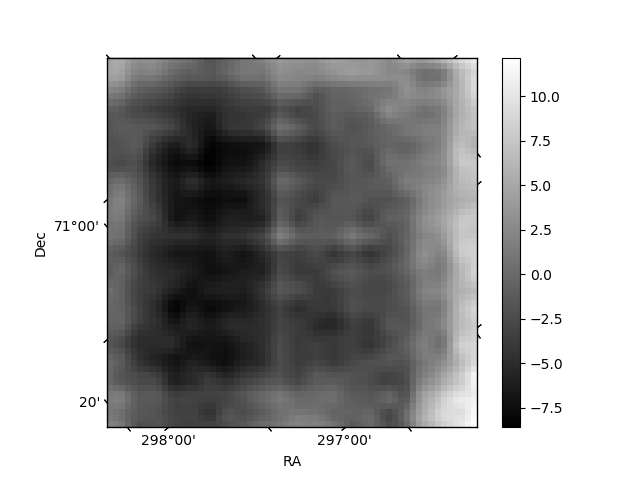
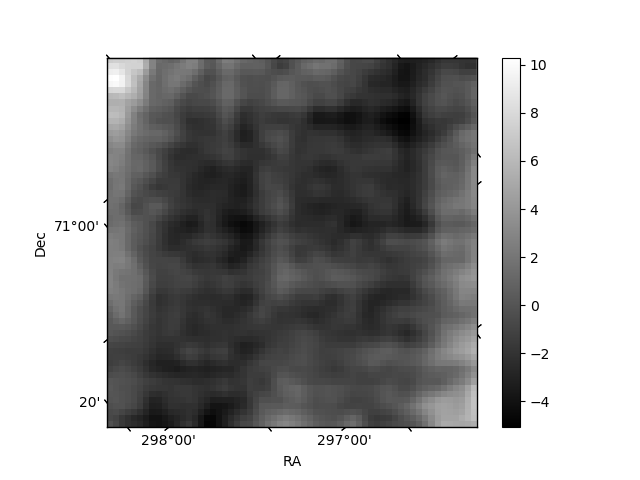
Histogram calculated using DETX and DETY for each event in the final _common_clean file
| Quadrant A | 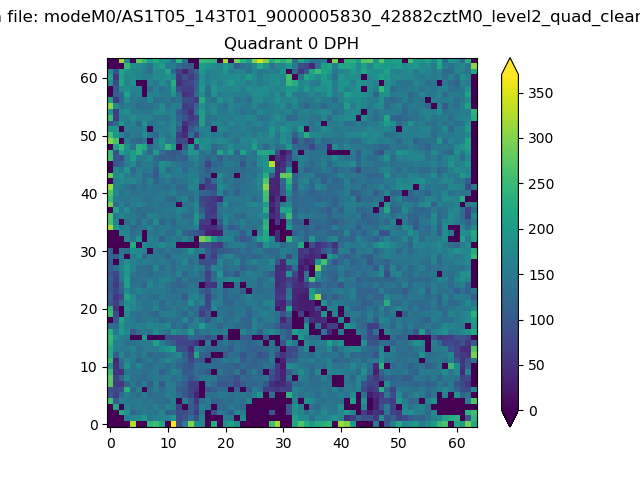 |
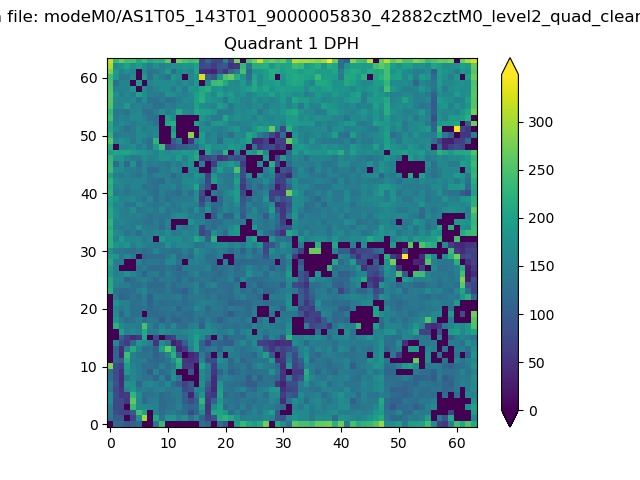 |
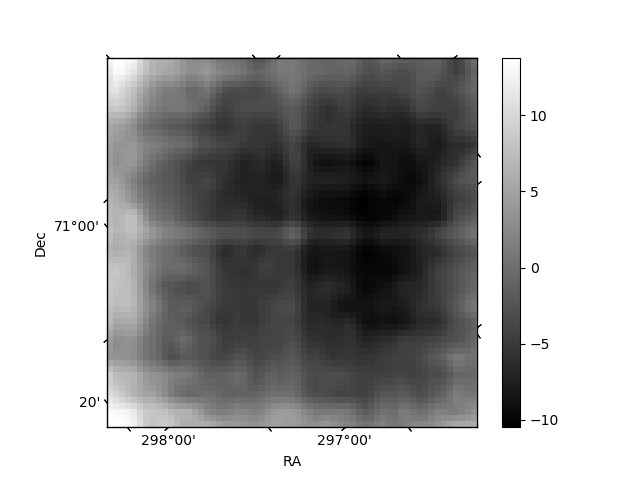
Quadrant B |
|---|---|---|---|
| Quadrant D | 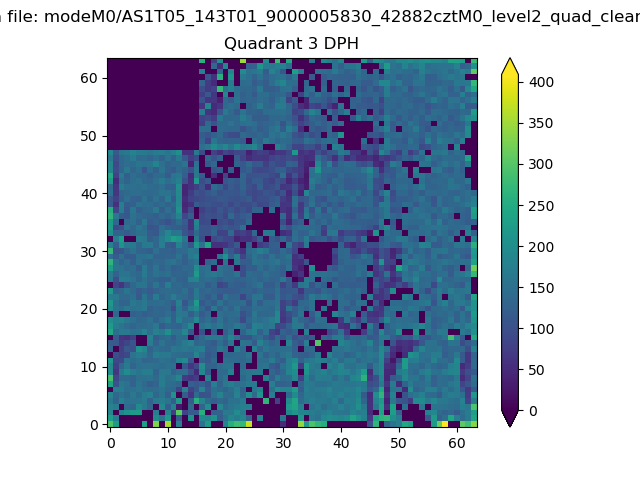 |
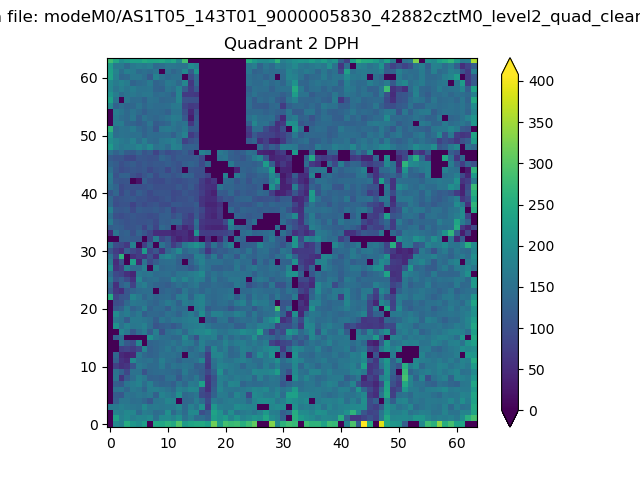 |
Quadrant C |
| Plot type | Count rate plots | Images |
|---|---|---|
| Comparison with Poisson distribution Blue bars denote a histogram of data divided into 1 sec bins. Red curve is a Poisson curve with rate = median count rate of data. |
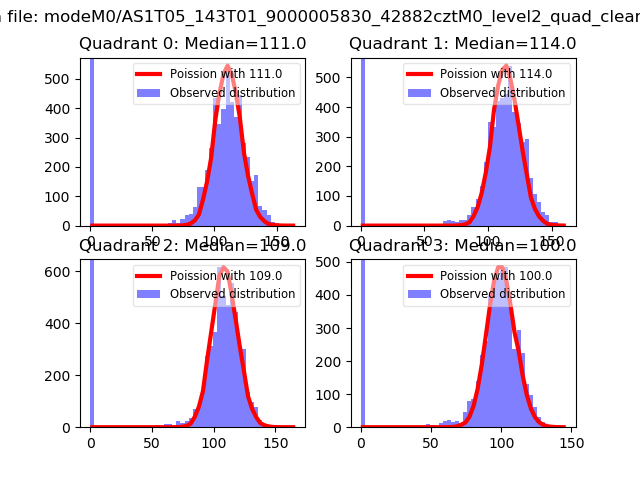 |
 |
| Quadrant-wise count rates Data is divided into 100 sec bins |
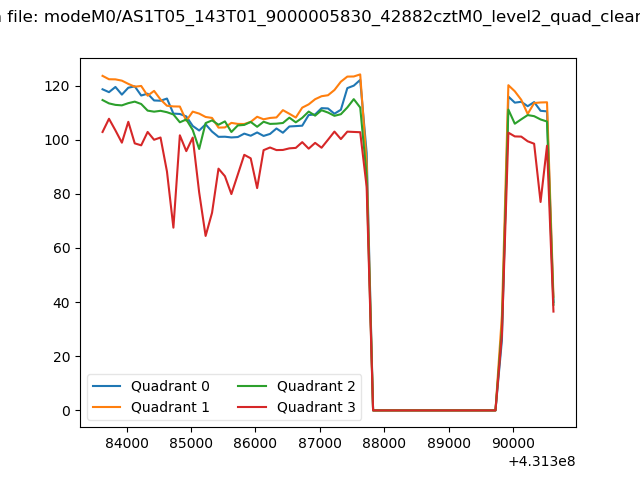 |
|
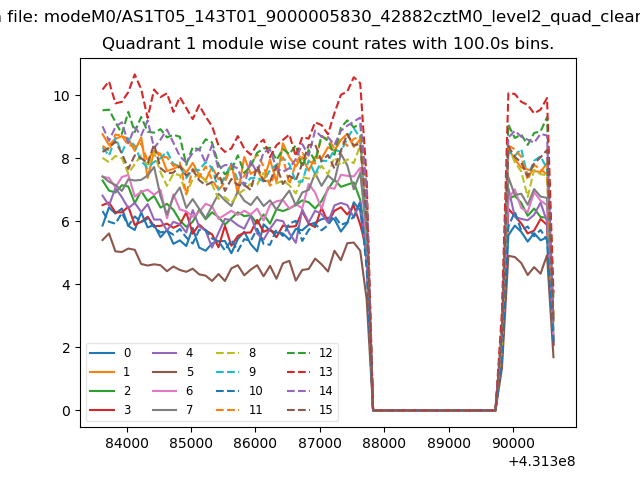
| Module-wise count rates for Quadrant A Data is divided into 100 sec bins |
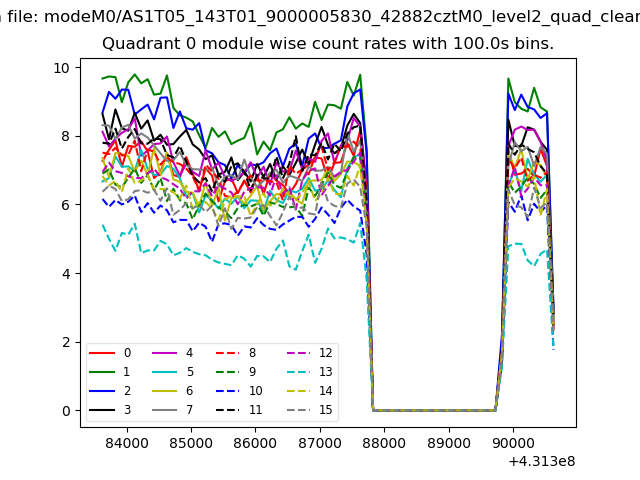 |
 |
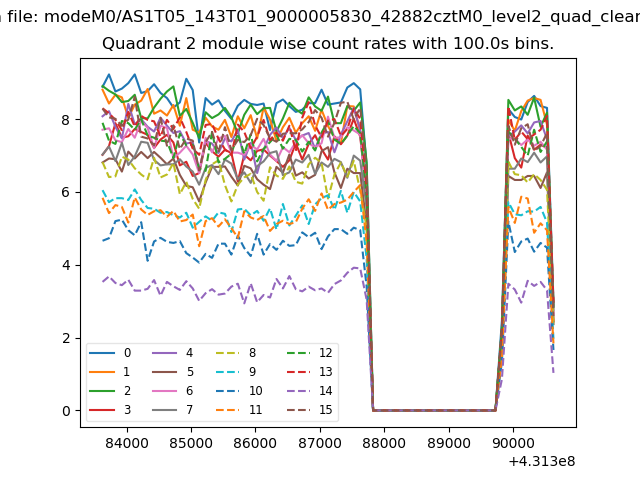
| Module-wise count rates for Quadrant B Data is divided into 100 sec bins |
 |
 |
| Module-wise count rates for Quadrant C Data is divided into 100 sec bins |
 |
 |
| Module-wise count rates for Quadrant D Data is divided into 100 sec bins |
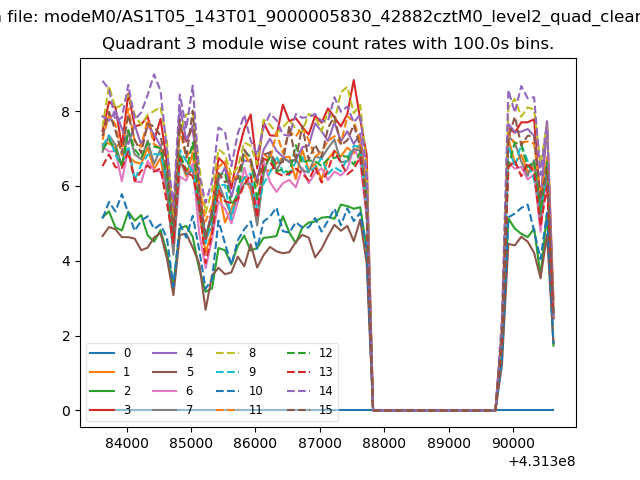 |
 |
| Parameter | Plot |
|---|---|
| CZT HV Monitor | 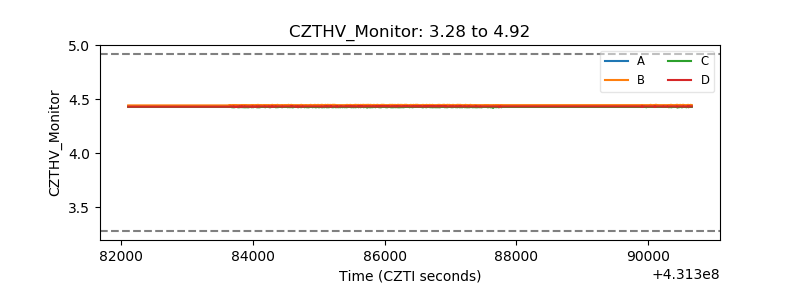 |
| D_VDD | 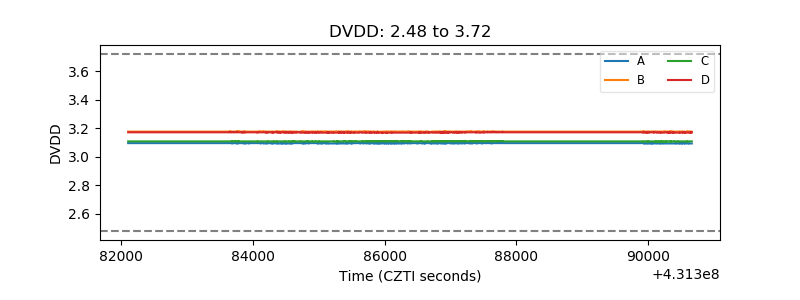 |
| Temperature 1 | 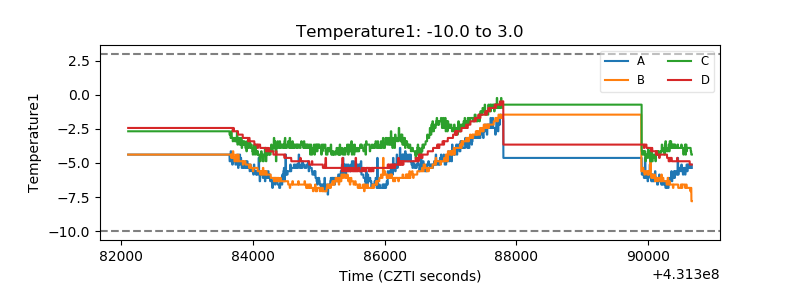 |
| Veto HV Monitor | 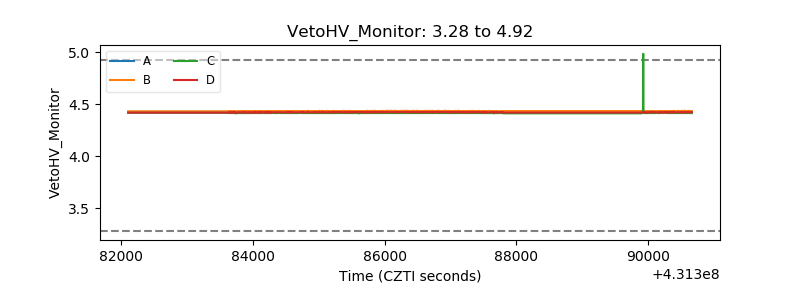 |
| Veto LLD | 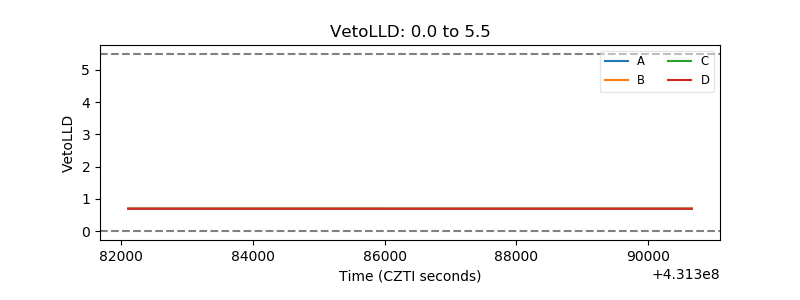 |
| Alpha Counter | 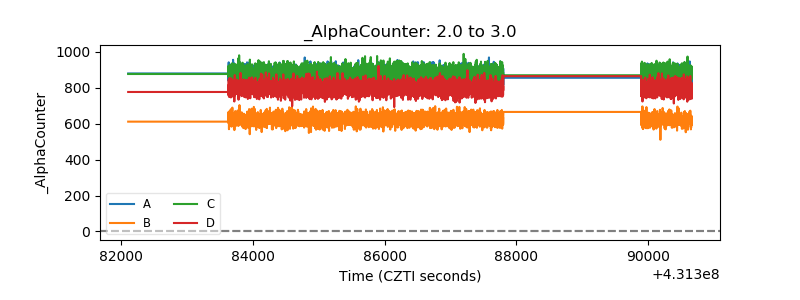 |
| _CPM_Rate |  |
| CZT Counter | 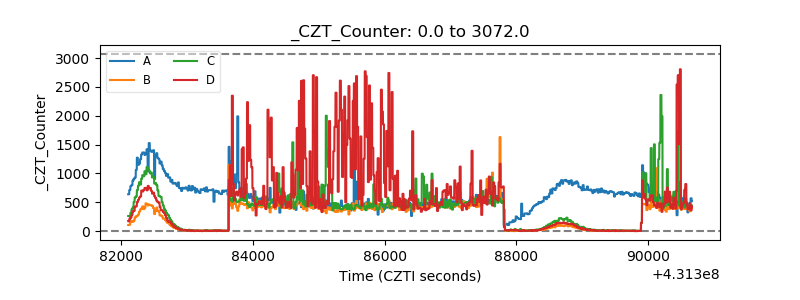 |
| +2.5 Volts monitor | 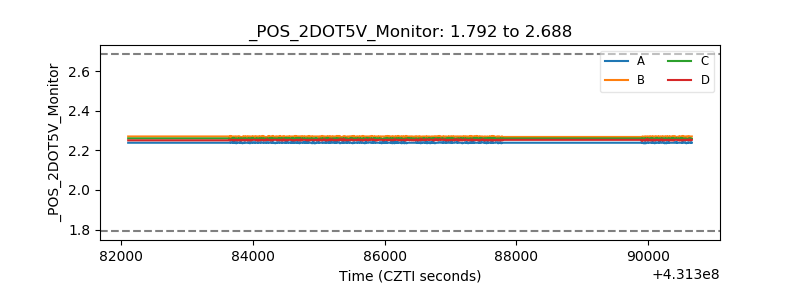 |
| +5 Volts monitor | 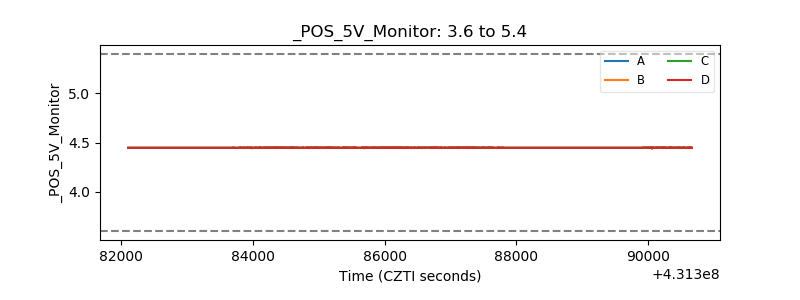 |
| _ROLL_ROT | 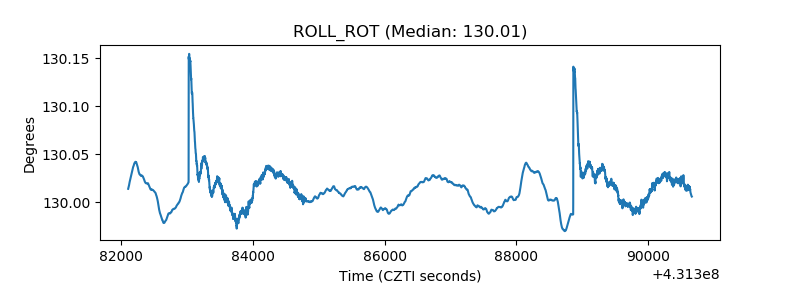 |
| _Roll_DEC | 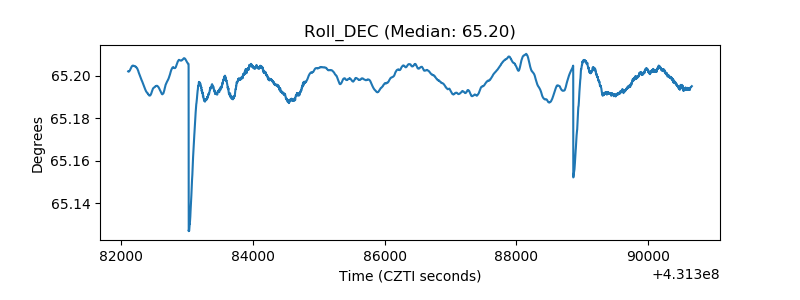 |
| _Roll_RA | 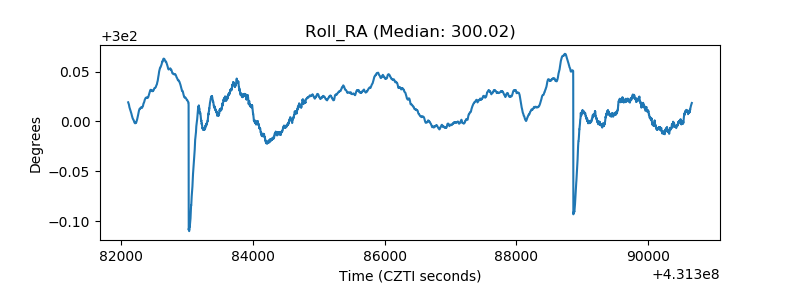 |
| Veto Counter | 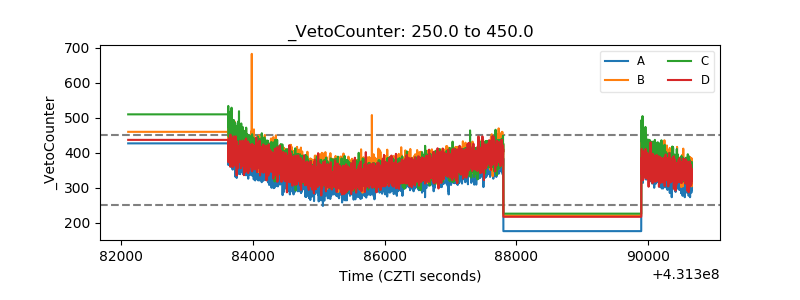 |