| Param | Original file | Final file |
|---|---|---|
| Filename | modeM0/AS1T05_143T01_9000005830_42883cztM0_level2.fits | modeM0/AS1T05_143T01_9000005830_42883cztM0_level2_quad_clean.evt |
| Size (bytes) | 321,572,160 | 83,704,320 |
| Size | 306.7 MB | 79.8 MB |
| Events in quadrant A | 2,949,998 | 551,616 |
| Events in quadrant B | 2,250,204 | 576,652 |
| Events in quadrant C | 2,749,174 | 549,866 |
| Events in quadrant D | 3,549,075 | 491,845 |
| Mode M0 | |||
|---|---|---|---|
| Quadrant | BADHDUFLAG | Total packets | Discarded packets |
| A | 0 | 12086 | 2 |
| B | 0 | 10623 | 2 |
| C | 0 | 11723 | 2 |
| D | 0 | 14258 | 2 |
| Mode M9 | |||
|---|---|---|---|
| Quadrant | BADHDUFLAG | Total packets | Discarded packets |
| A | 0 | 34 | 0 |
| B | 0 | 35 | 0 |
| C | 0 | 35 | 0 |
| D | 0 | 35 | 0 |
| Mode SS | |||
|---|---|---|---|
| Quadrant | BADHDUFLAG | Total packets | Discarded packets |
| A | 0 | 108 | 0 |
| B | 0 | 108 | 0 |
| C | 0 | 108 | 0 |
| D | 0 | 108 | 0 |
| Quadrant | Total seconds | Saturated seconds | Saturation percentage |
|---|---|---|---|
| A | 5197 | 96 | 1.847220% |
| B | 5197 | 18 | 0.346354% |
| C | 5197 | 30 | 0.577256% |
| D | 5197 | 242 | 4.656533% |
Noise dominated data is calculated using 1-second bins in cleaned event files. If a bin has >2000 counts, and if more than 50% of those come from <1% of pixels, then it is considered to be noise-dominated and hence unusable.
| Quadrant | # 1 sec bins | Bins with >0 counts | Bins with >2000 counts | High rate bins dominated by noise | Noise dominated (total time) | Noise dominated (detector-on time) | Marked lightcurve |
|---|---|---|---|---|---|---|---|
| A | 7019 | 5198 | 60 | 60 | 0.85% | 1.15% | 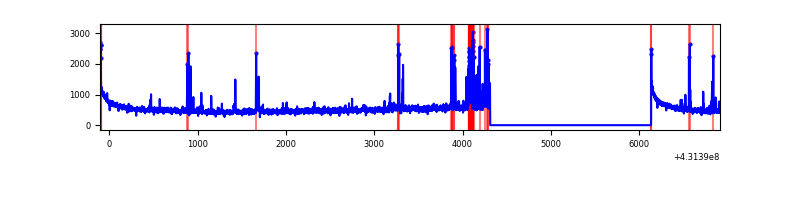 |
| B | 7019 | 5198 | 9 | 9 | 0.13% | 0.17% | 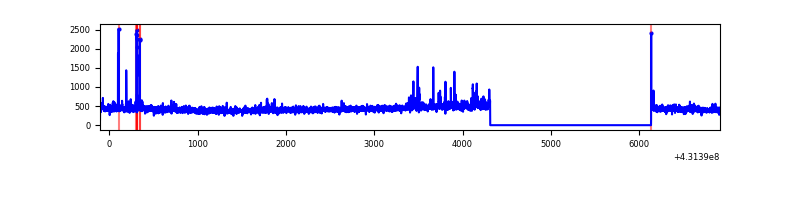 |
| C | 7019 | 5198 | 23 | 23 | 0.33% | 0.44% | 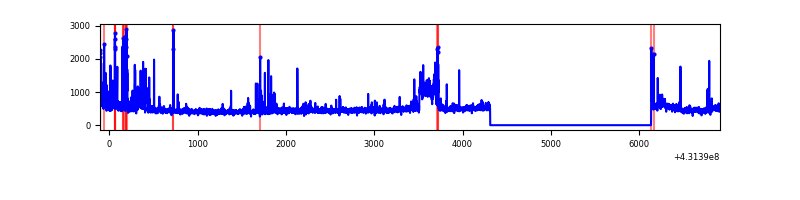 |
| D | 7019 | 5198 | 259 | 259 | 3.69% | 4.98% | 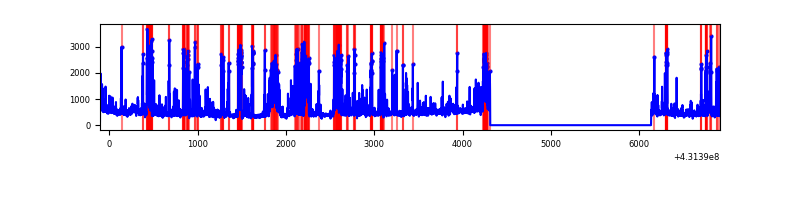 |
Top three noisy pixels from each quadrant. If the there are fewer than three noisy pixels in the level2.evt file, extra rows are filled as -1
| Pixel properties | Quadrant properties | ||||||
|---|---|---|---|---|---|---|---|
| Quadrant | DetID | PixID | Counts | Sigma | Mean | Median | Sigma |
| A | 10 | 83 | 543923 | 4900.01 | 537 | 525 | 110.9 |
| A | 15 | 237 | 166465 | 1496.34 | 537 | 525 | 110.9 |
| A | 13 | 248 | 99974 | 896.77 | 537 | 525 | 110.9 |
| B | 3 | 112 | 40692 | 379.14 | 542 | 525 | 105.9 |
| B | 0 | 190 | 37420 | 348.25 | 542 | 525 | 105.9 |
| B | 12 | 111 | 13311 | 120.69 | 542 | 525 | 105.9 |
| C | 15 | 214 | 208259 | 1679.12 | 529 | 533 | 123.7 |
| C | 12 | 2 | 185047 | 1491.49 | 529 | 533 | 123.7 |
| C | 14 | 254 | 157178 | 1266.22 | 529 | 533 | 123.7 |
| D | 12 | 6 | 702032 | 5518.0 | 518 | 503 | 127.1 |
| D | 1 | 52 | 278766 | 2188.73 | 518 | 503 | 127.1 |
| D | 13 | 249 | 139769 | 1095.42 | 518 | 503 | 127.1 |
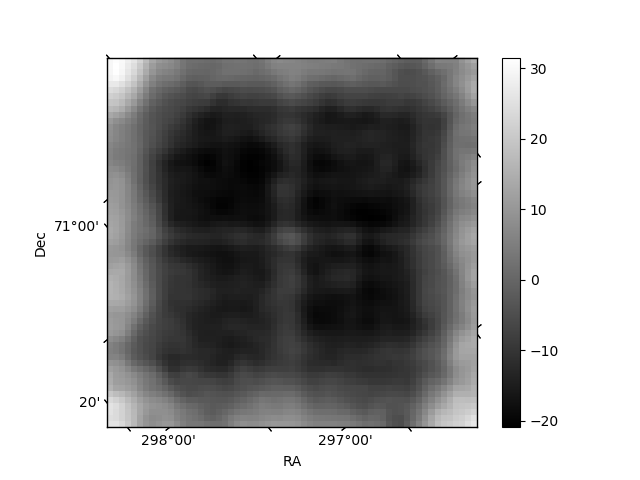
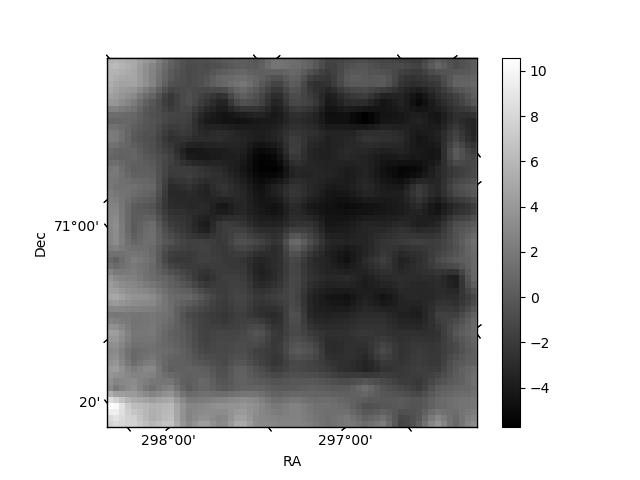
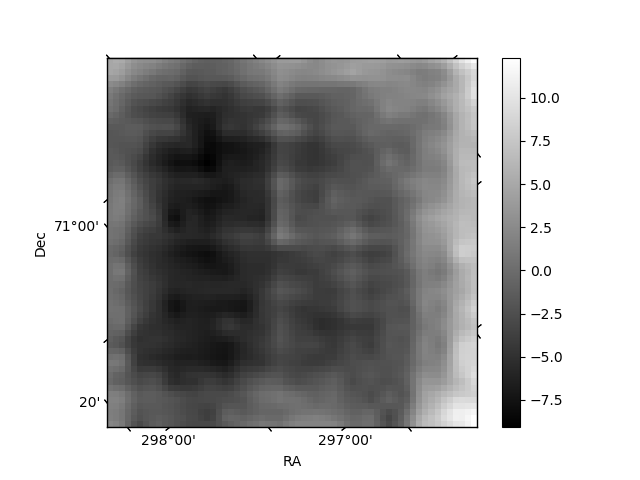
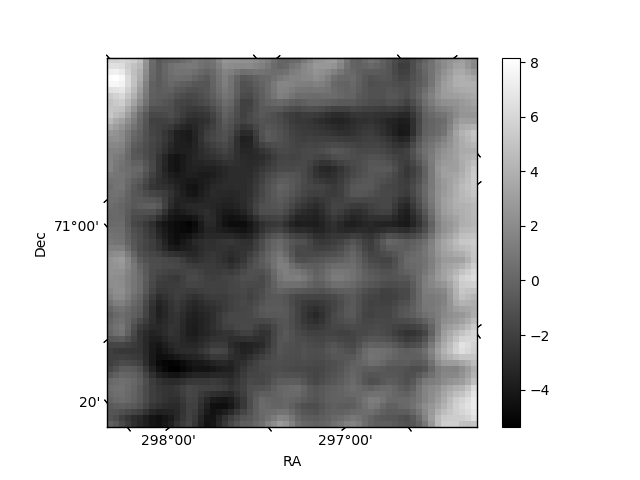
Histogram calculated using DETX and DETY for each event in the final _common_clean file
| Quadrant A | 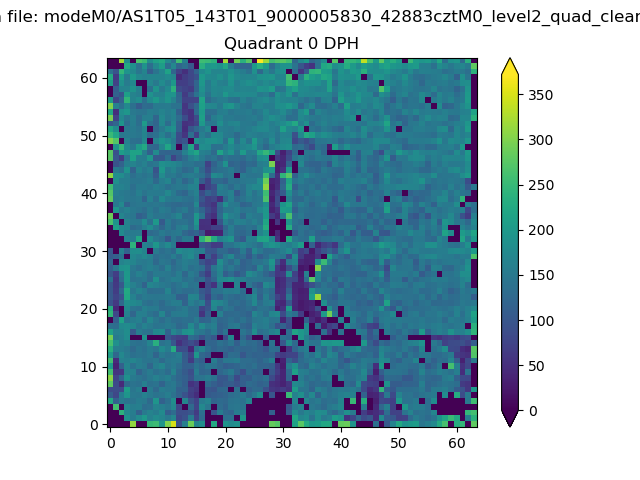 |
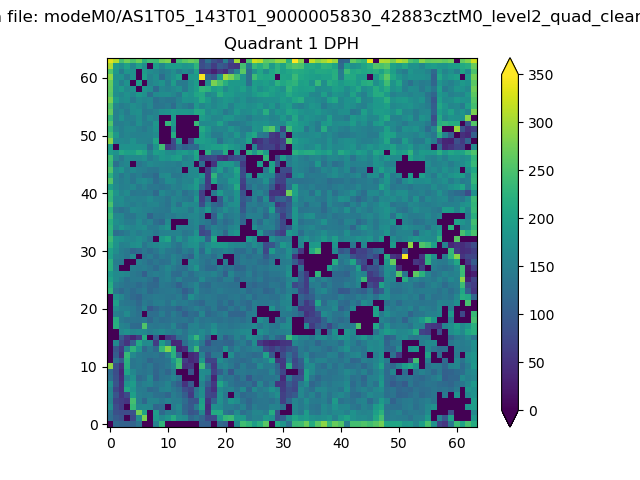 |
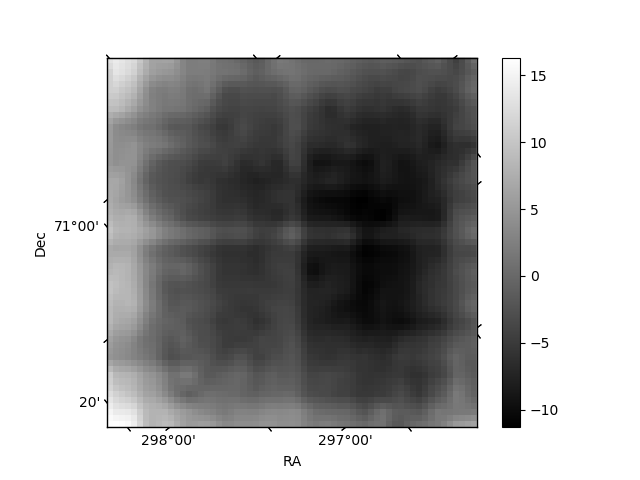
Quadrant B |
|---|---|---|---|
| Quadrant D | 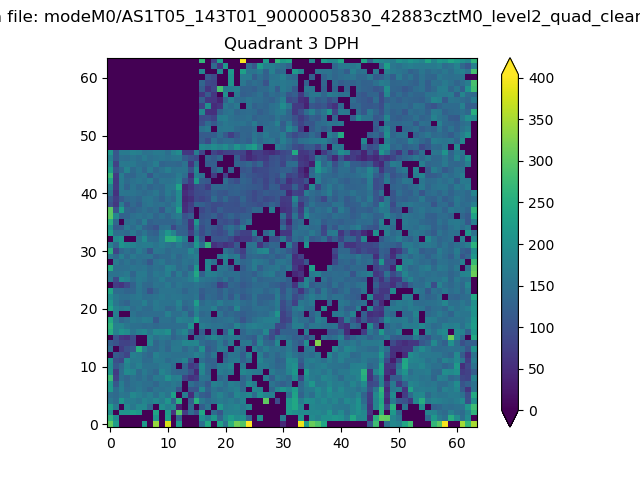 |
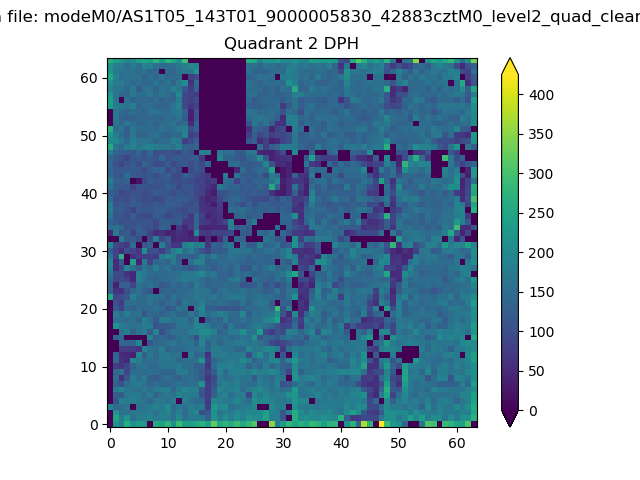 |
Quadrant C |
| Plot type | Count rate plots | Images |
|---|---|---|
| Comparison with Poisson distribution Blue bars denote a histogram of data divided into 1 sec bins. Red curve is a Poisson curve with rate = median count rate of data. |
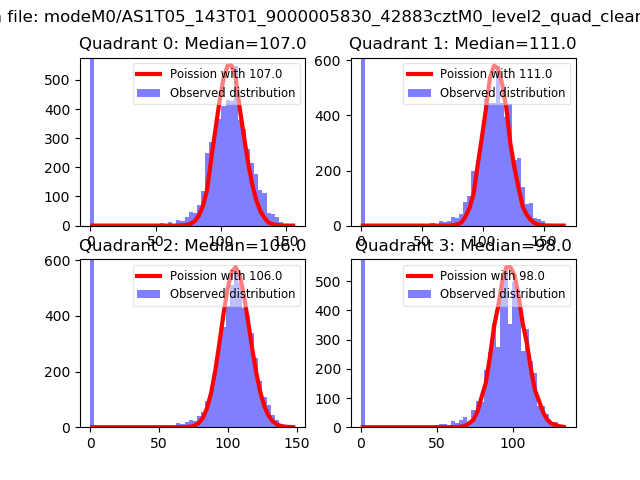 |
 |
| Quadrant-wise count rates Data is divided into 100 sec bins |
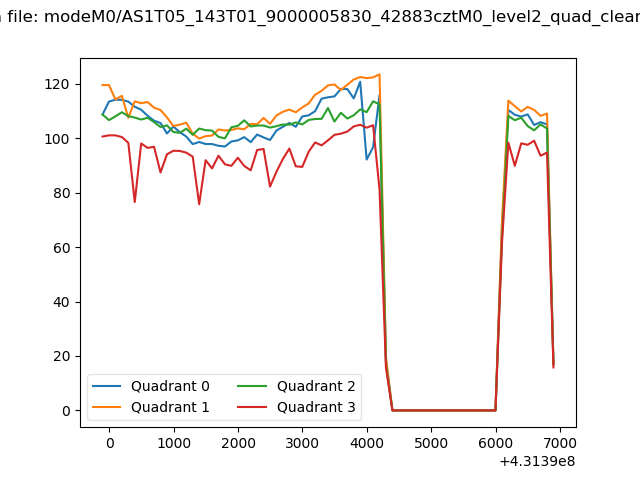 |
|
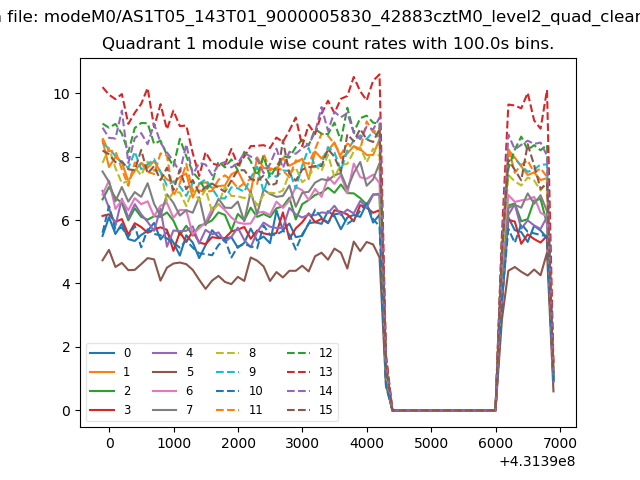
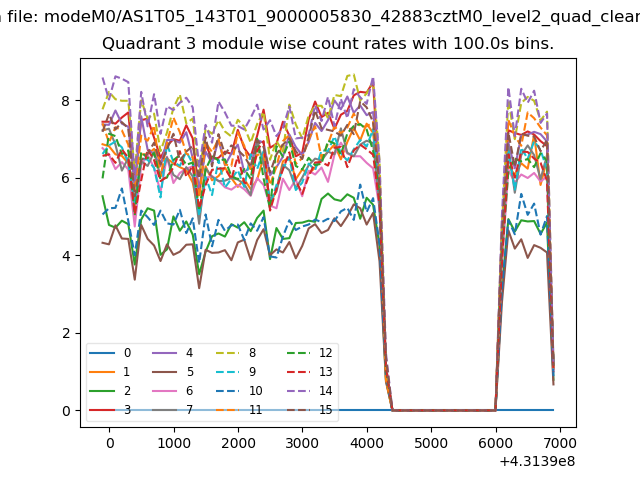
| Module-wise count rates for Quadrant A Data is divided into 100 sec bins |
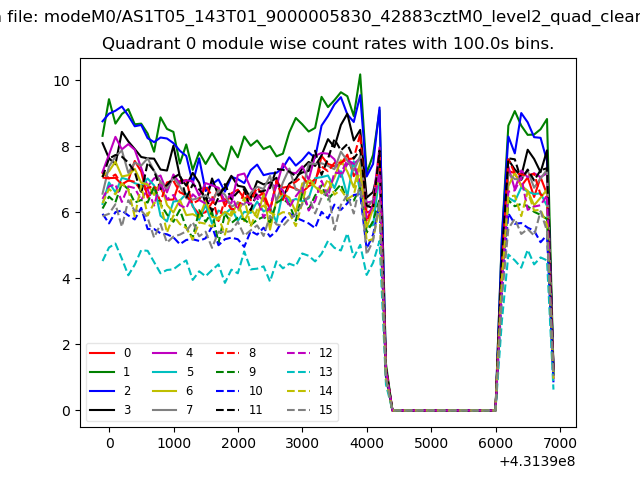 |
 |
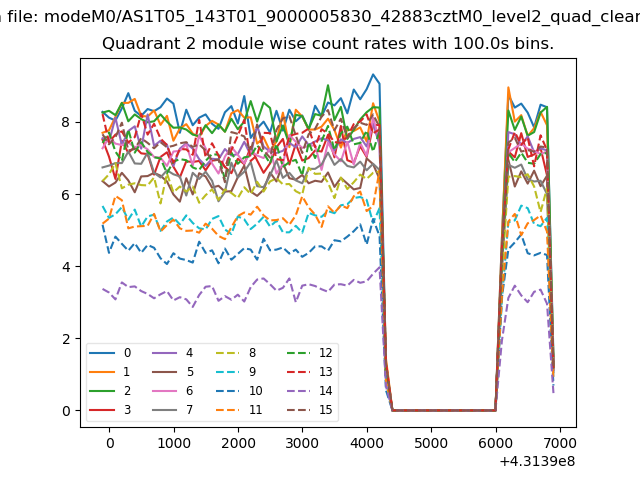
| Module-wise count rates for Quadrant B Data is divided into 100 sec bins |
 |
 |
| Module-wise count rates for Quadrant C Data is divided into 100 sec bins |
 |
 |
| Module-wise count rates for Quadrant D Data is divided into 100 sec bins |
 |
 |
| Parameter | Plot |
|---|---|
| CZT HV Monitor | 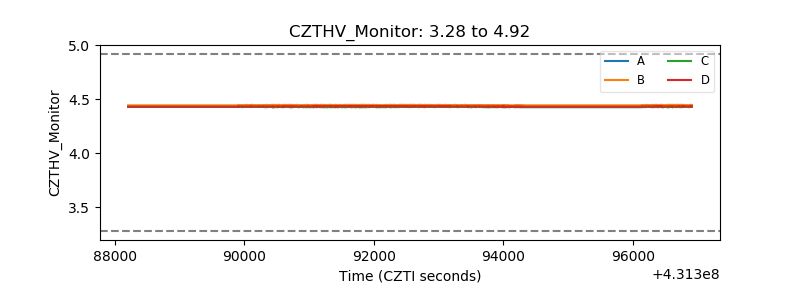 |
| D_VDD | 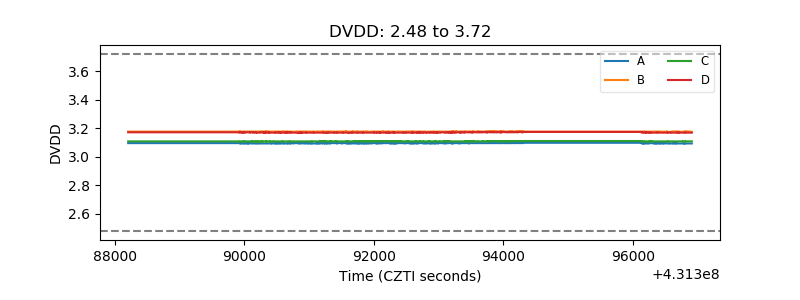 |
| Temperature 1 | 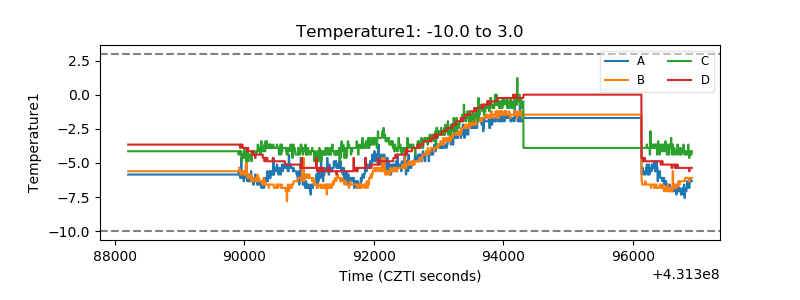 |
| Veto HV Monitor | 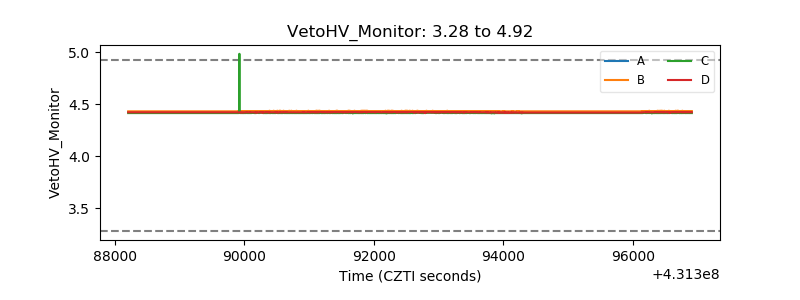 |
| Veto LLD | 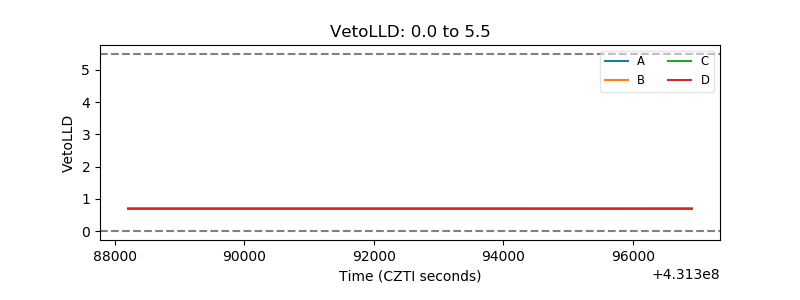 |
| Alpha Counter | 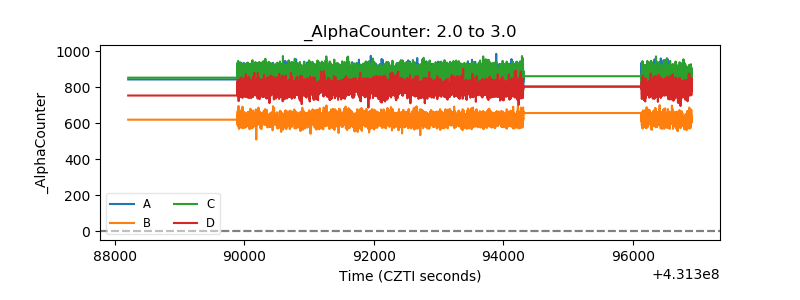 |
| _CPM_Rate | 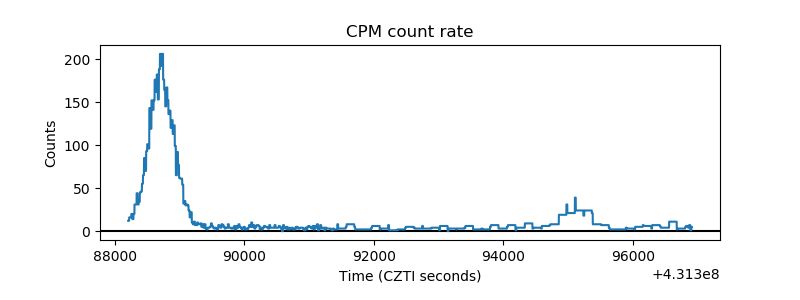 |
| CZT Counter | 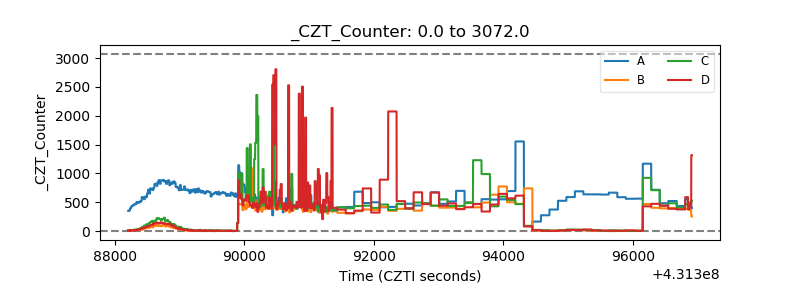 |
| +2.5 Volts monitor | 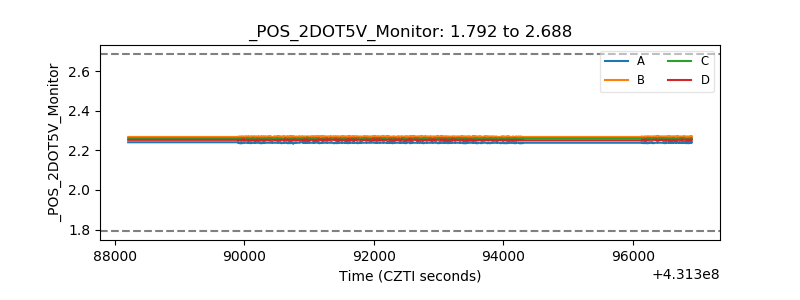 |
| +5 Volts monitor | 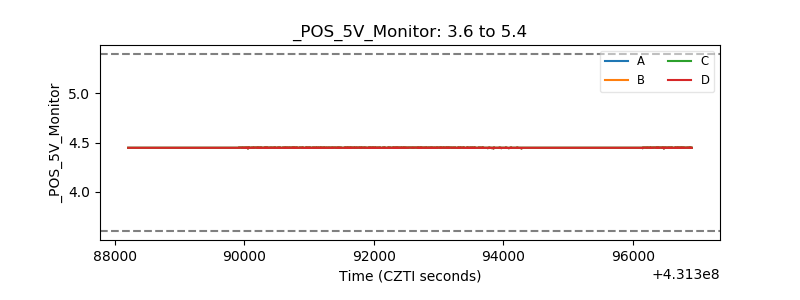 |
| _ROLL_ROT | 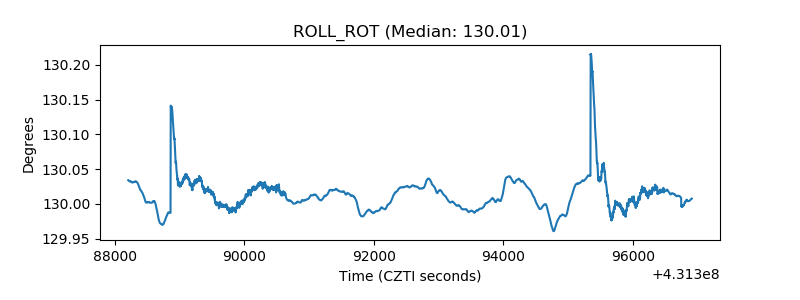 |
| _Roll_DEC | 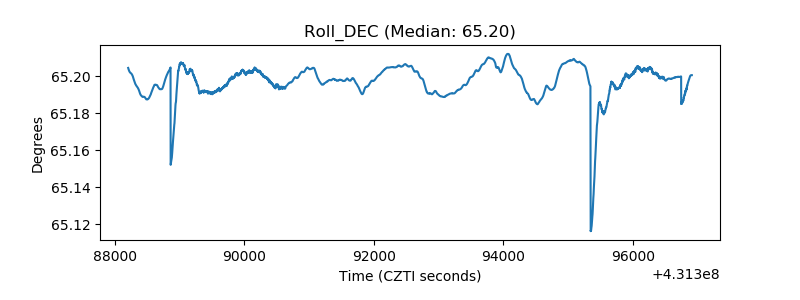 |
| _Roll_RA | 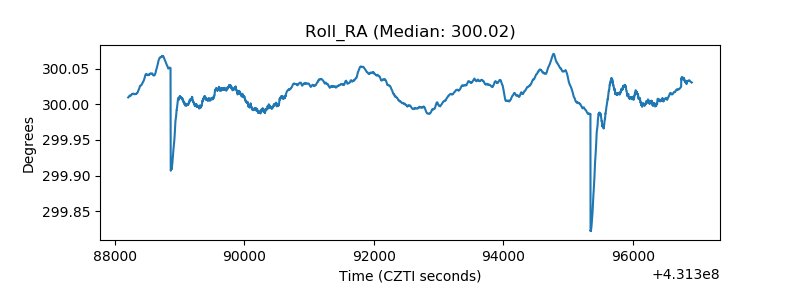 |
| Veto Counter | 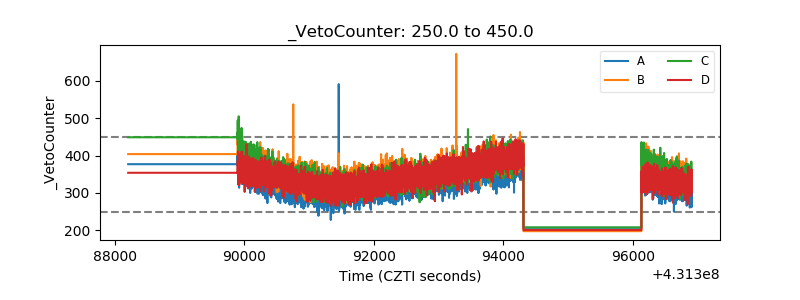 |