| Param | Original file | Final file |
|---|---|---|
| Filename | modeM0/AS1T05_143T01_9000005830_42884cztM0_level2.fits | modeM0/AS1T05_143T01_9000005830_42884cztM0_level2_quad_clean.evt |
| Size (bytes) | 357,770,880 | 89,683,200 |
| Size | 341.2 MB | 85.5 MB |
| Events in quadrant A | 3,450,353 | 588,343 |
| Events in quadrant B | 2,478,740 | 619,569 |
| Events in quadrant C | 2,988,664 | 587,220 |
| Events in quadrant D | 3,887,808 | 526,329 |
| Mode M0 | |||
|---|---|---|---|
| Quadrant | BADHDUFLAG | Total packets | Discarded packets |
| A | 0 | 13887 | 2 |
| B | 0 | 11545 | 2 |
| C | 0 | 12582 | 2 |
| D | 0 | 15635 | 2 |
| Mode M9 | |||
|---|---|---|---|
| Quadrant | BADHDUFLAG | Total packets | Discarded packets |
| A | 0 | 32 | 0 |
| B | 0 | 32 | 0 |
| C | 0 | 32 | 0 |
| D | 0 | 32 | 0 |
| Mode SS | |||
|---|---|---|---|
| Quadrant | BADHDUFLAG | Total packets | Discarded packets |
| A | 0 | 120 | 0 |
| B | 0 | 120 | 0 |
| C | 0 | 120 | 0 |
| D | 0 | 120 | 0 |
| Quadrant | Total seconds | Saturated seconds | Saturation percentage |
|---|---|---|---|
| A | 5621 | 168 | 2.988792% |
| B | 5622 | 11 | 0.195660% |
| C | 5622 | 35 | 0.622554% |
| D | 5622 | 300 | 5.336179% |
Noise dominated data is calculated using 1-second bins in cleaned event files. If a bin has >2000 counts, and if more than 50% of those come from <1% of pixels, then it is considered to be noise-dominated and hence unusable.
| Quadrant | # 1 sec bins | Bins with >0 counts | Bins with >2000 counts | High rate bins dominated by noise | Noise dominated (total time) | Noise dominated (detector-on time) | Marked lightcurve |
|---|---|---|---|---|---|---|---|
| A | 8936 | 5623 | 122 | 122 | 1.37% | 2.17% | 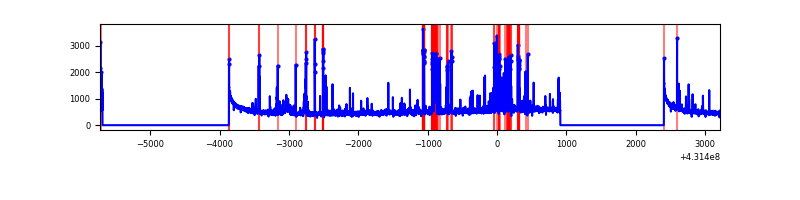 |
| B | 8937 | 5624 | 4 | 4 | 0.04% | 0.07% | 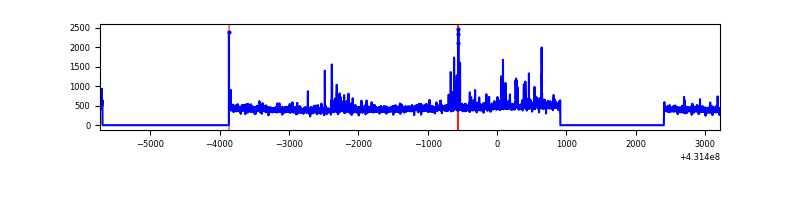 |
| C | 8937 | 5624 | 34 | 34 | 0.38% | 0.60% | 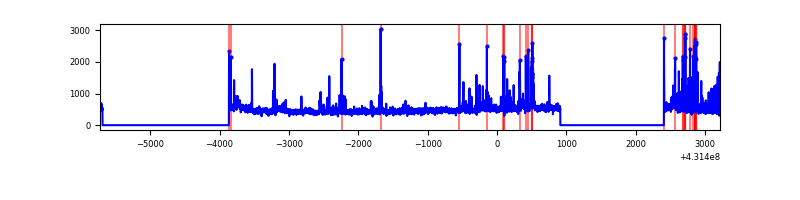 |
| D | 8937 | 5624 | 326 | 326 | 3.65% | 5.80% | 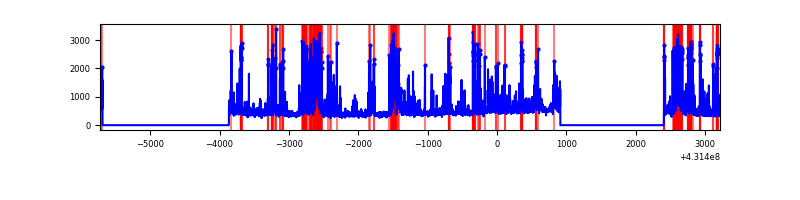 |
Top three noisy pixels from each quadrant. If the there are fewer than three noisy pixels in the level2.evt file, extra rows are filled as -1
| Pixel properties | Quadrant properties | ||||||
|---|---|---|---|---|---|---|---|
| Quadrant | DetID | PixID | Counts | Sigma | Mean | Median | Sigma |
| A | 10 | 83 | 581681 | 4810.87 | 586 | 573 | 120.8 |
| A | 15 | 237 | 405758 | 3354.44 | 586 | 573 | 120.8 |
| A | 13 | 248 | 98981 | 814.7 | 586 | 573 | 120.8 |
| B | 0 | 190 | 37462 | 320.1 | 593 | 576 | 115.2 |
| B | 15 | 85 | 31928 | 272.07 | 593 | 576 | 115.2 |
| B | 5 | 172 | 18905 | 159.06 | 593 | 576 | 115.2 |
| C | 12 | 2 | 231067 | 1707.97 | 578 | 581 | 134.9 |
| C | 15 | 214 | 228214 | 1686.83 | 578 | 581 | 134.9 |
| C | 5 | 250 | 154758 | 1142.5 | 578 | 581 | 134.9 |
| D | 12 | 6 | 826006 | 5924.76 | 568 | 549 | 139.3 |
| D | 13 | 249 | 386710 | 2771.69 | 568 | 549 | 139.3 |
| D | 1 | 52 | 190904 | 1366.28 | 568 | 549 | 139.3 |
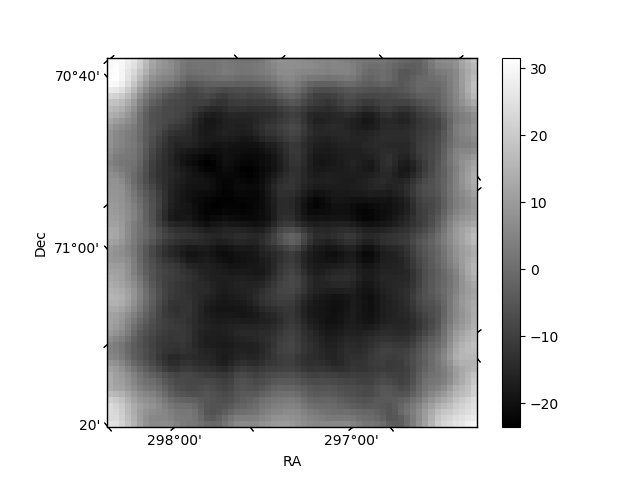
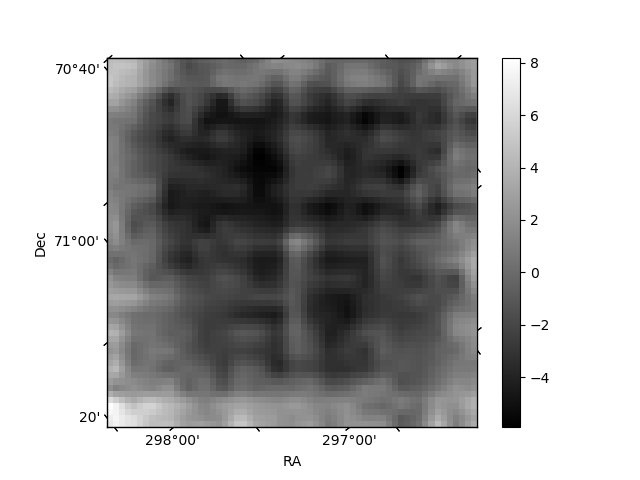
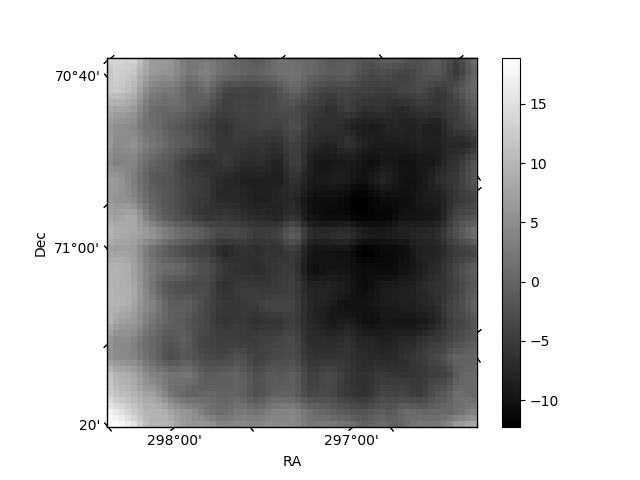
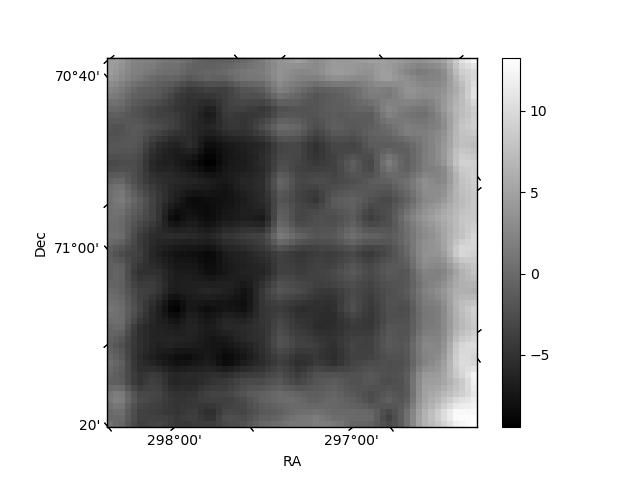
Histogram calculated using DETX and DETY for each event in the final _common_clean file
| Quadrant A | 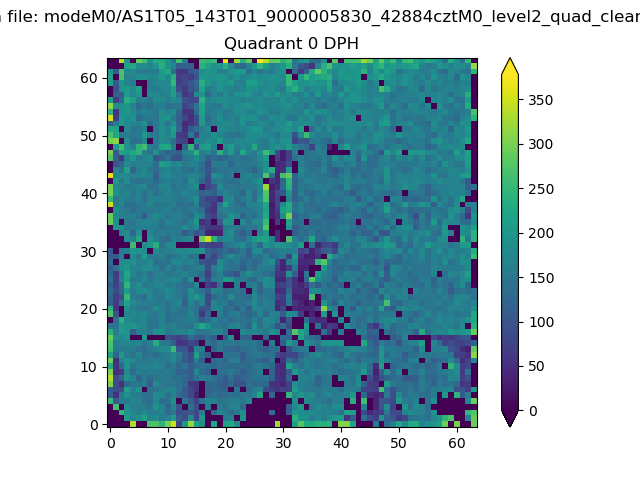 |
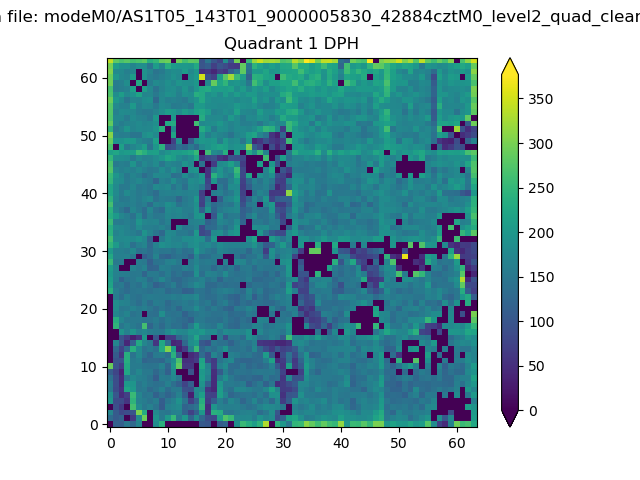 |
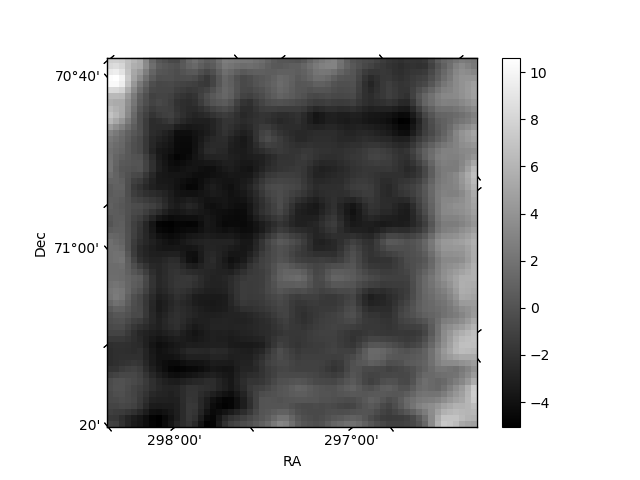
Quadrant B |
|---|---|---|---|
| Quadrant D | 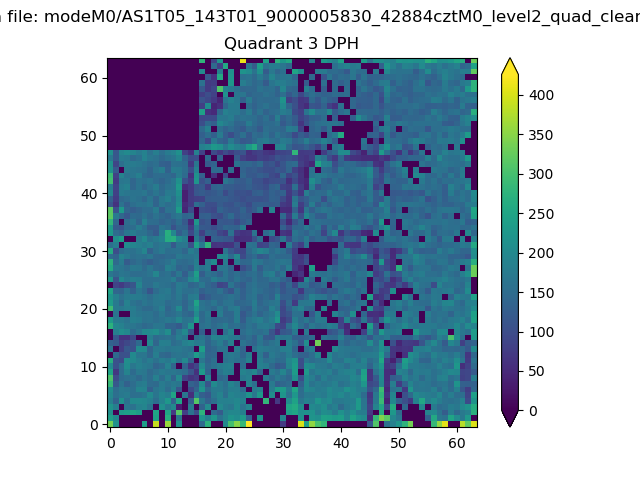 |
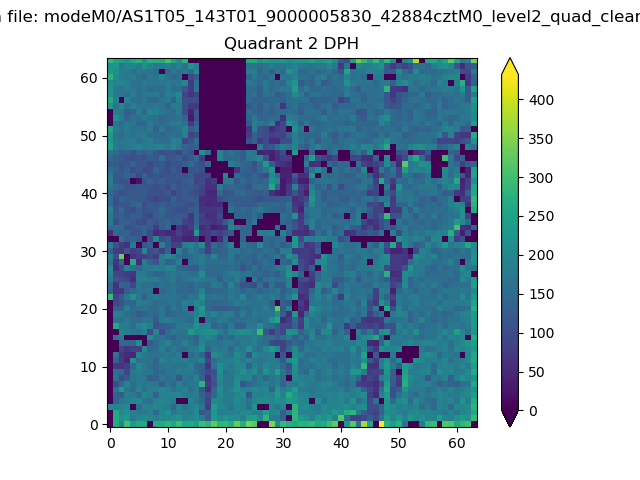 |
Quadrant C |
| Plot type | Count rate plots | Images |
|---|---|---|
| Comparison with Poisson distribution Blue bars denote a histogram of data divided into 1 sec bins. Red curve is a Poisson curve with rate = median count rate of data. |
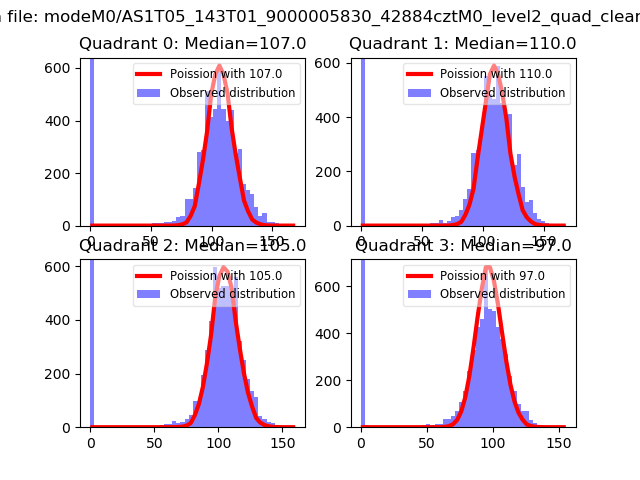 |
 |
| Quadrant-wise count rates Data is divided into 100 sec bins |
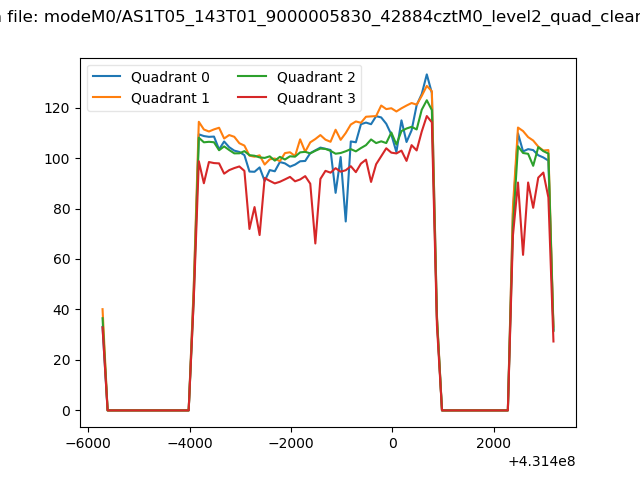 |
|
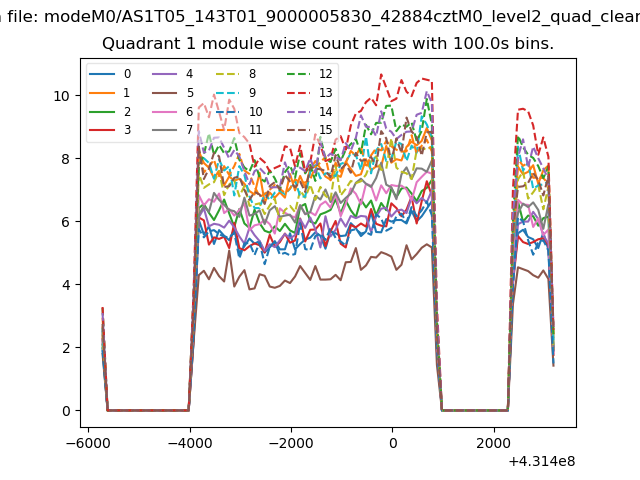
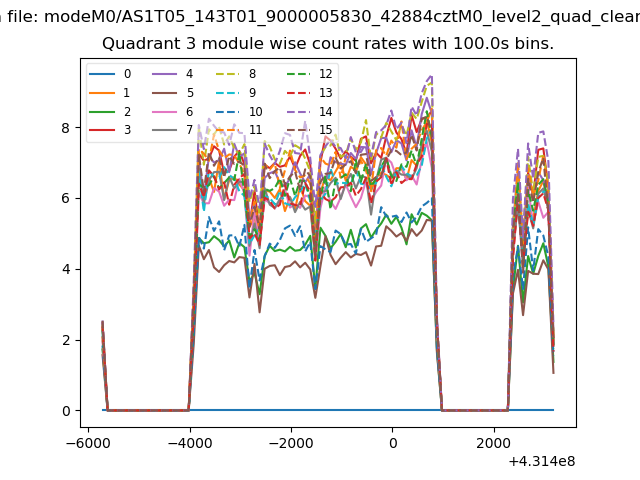
| Module-wise count rates for Quadrant A Data is divided into 100 sec bins |
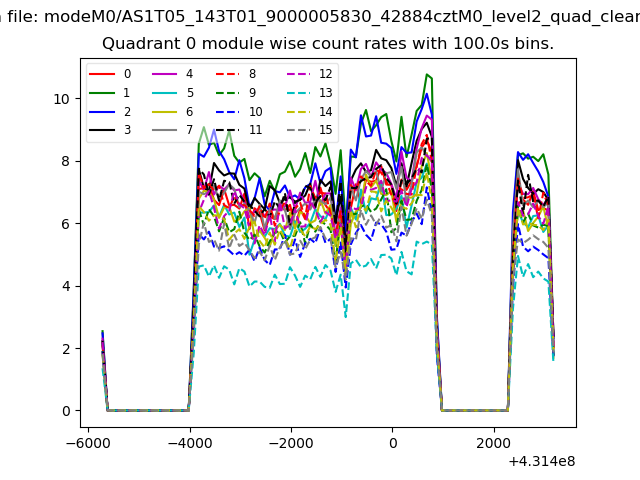 |
 |
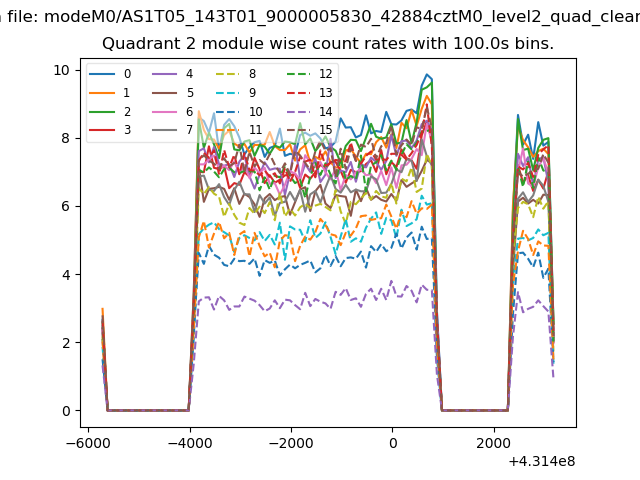
| Module-wise count rates for Quadrant B Data is divided into 100 sec bins |
 |
 |
| Module-wise count rates for Quadrant C Data is divided into 100 sec bins |
 |
 |
| Module-wise count rates for Quadrant D Data is divided into 100 sec bins |
 |
 |
| Parameter | Plot |
|---|---|
| CZT HV Monitor | 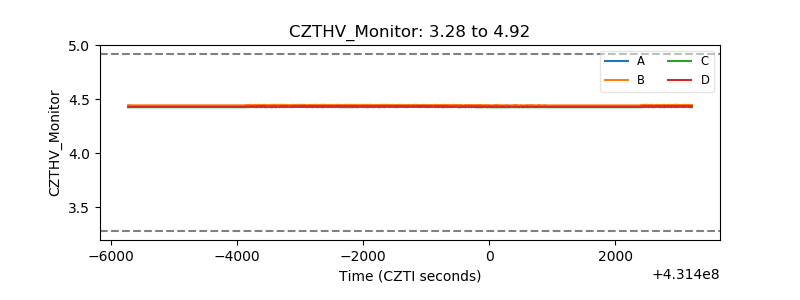 |
| D_VDD | 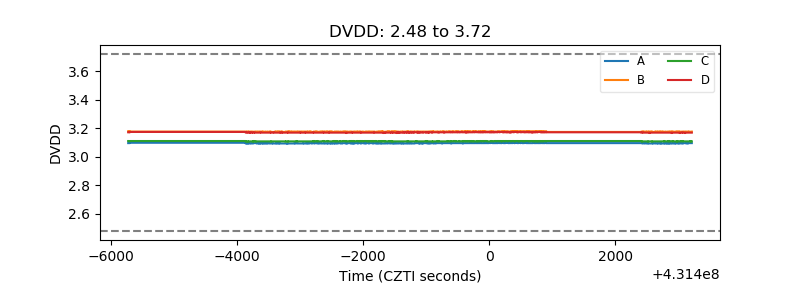 |
| Temperature 1 | 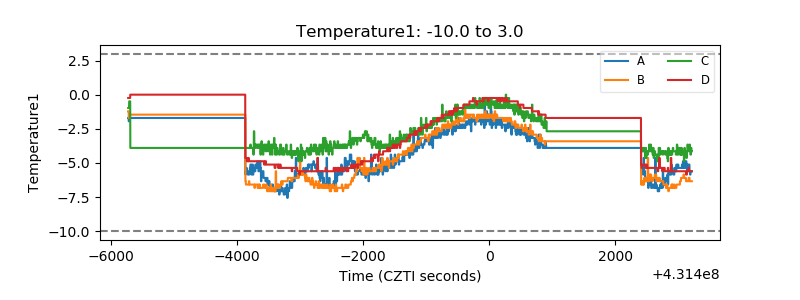 |
| Veto HV Monitor | 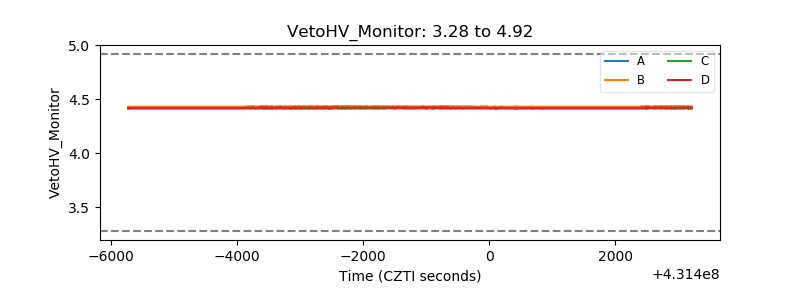 |
| Veto LLD | 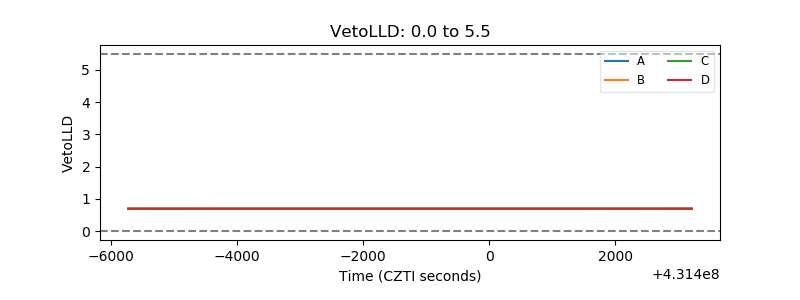 |
| Alpha Counter | 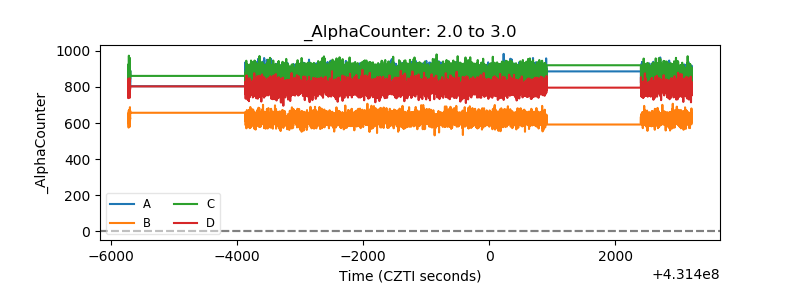 |
| _CPM_Rate | 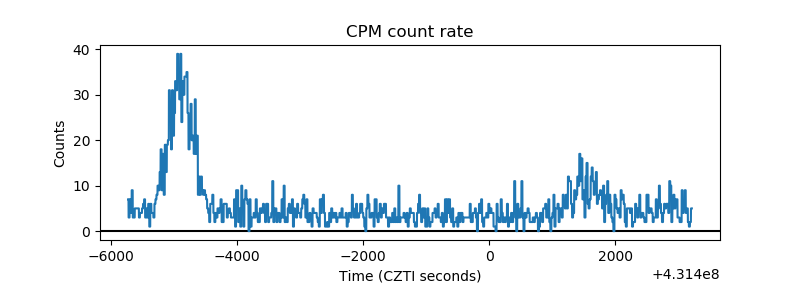 |
| CZT Counter | 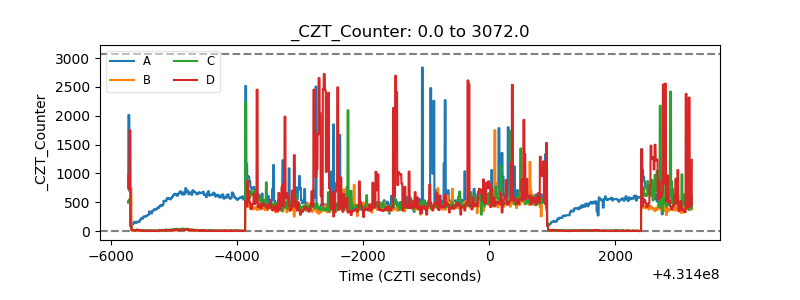 |
| +2.5 Volts monitor | 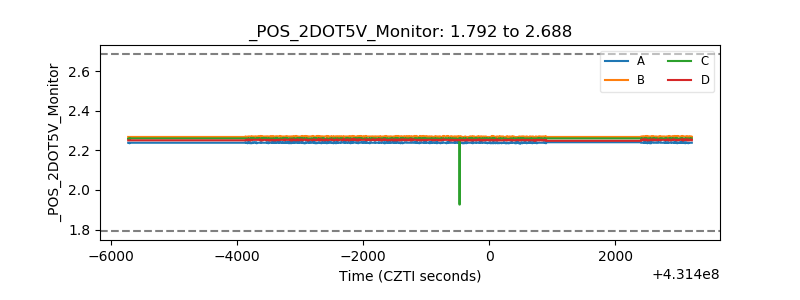 |
| +5 Volts monitor | 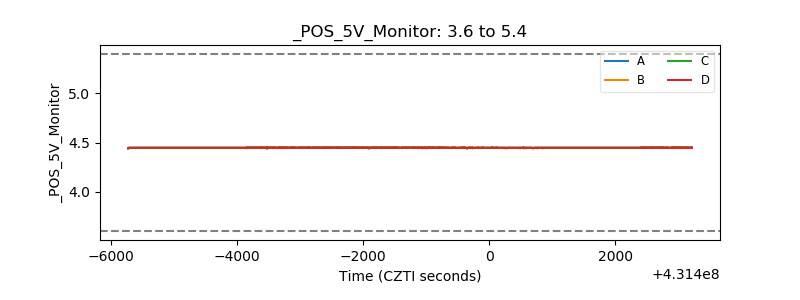 |
| _ROLL_ROT | 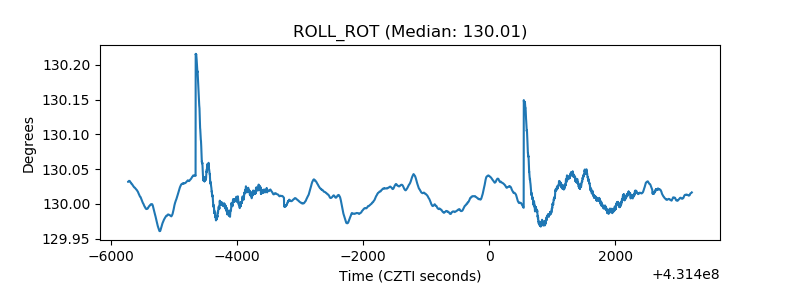 |
| _Roll_DEC | 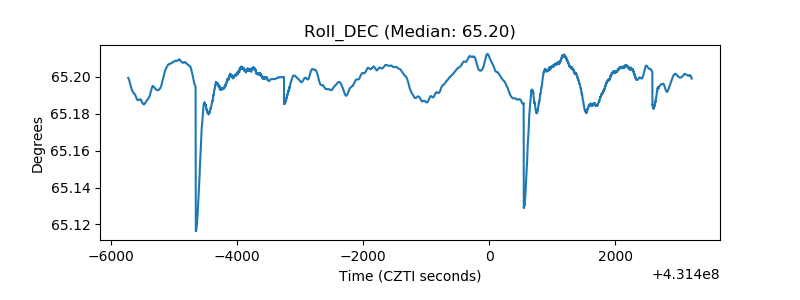 |
| _Roll_RA | 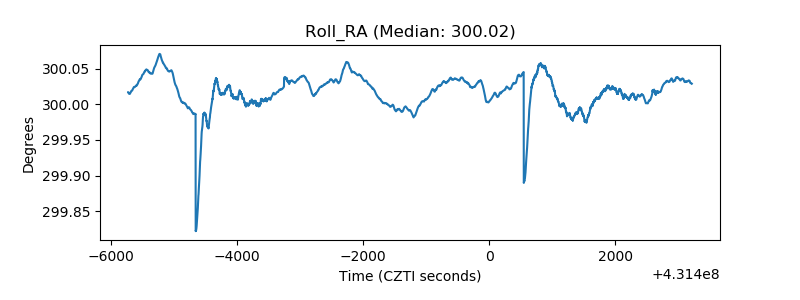 |
| Veto Counter | 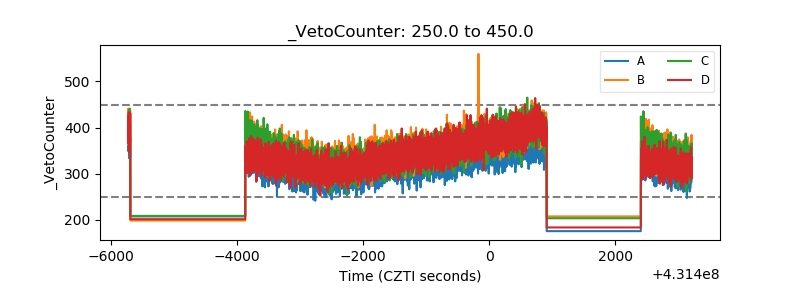 |