| Param | Original file | Final file |
|---|---|---|
| Filename | modeM0/AS1T05_143T01_9000005830_42885cztM0_level2.fits | modeM0/AS1T05_143T01_9000005830_42885cztM0_level2_quad_clean.evt |
| Size (bytes) | 401,607,360 | 98,772,480 |
| Size | 383.0 MB | 94.2 MB |
| Events in quadrant A | 3,659,543 | 657,691 |
| Events in quadrant B | 2,818,622 | 679,864 |
| Events in quadrant C | 3,801,528 | 637,545 |
| Events in quadrant D | 4,104,569 | 582,402 |
| Mode M0 | |||
|---|---|---|---|
| Quadrant | BADHDUFLAG | Total packets | Discarded packets |
| A | 0 | 14725 | 2 |
| B | 0 | 12851 | 2 |
| C | 0 | 15250 | 2 |
| D | 0 | 16735 | 2 |
| Mode M9 | |||
|---|---|---|---|
| Quadrant | BADHDUFLAG | Total packets | Discarded packets |
| A | 0 | 27 | 0 |
| B | 0 | 27 | 0 |
| C | 0 | 27 | 0 |
| D | 0 | 27 | 0 |
| Mode SS | |||
|---|---|---|---|
| Quadrant | BADHDUFLAG | Total packets | Discarded packets |
| A | 0 | 130 | 0 |
| B | 0 | 130 | 0 |
| C | 0 | 130 | 0 |
| D | 0 | 130 | 0 |
| Quadrant | Total seconds | Saturated seconds | Saturation percentage |
|---|---|---|---|
| A | 6193 | 122 | 1.969966% |
| B | 6193 | 15 | 0.242209% |
| C | 6193 | 136 | 2.196028% |
| D | 6194 | 251 | 4.052309% |
Noise dominated data is calculated using 1-second bins in cleaned event files. If a bin has >2000 counts, and if more than 50% of those come from <1% of pixels, then it is considered to be noise-dominated and hence unusable.
| Quadrant | # 1 sec bins | Bins with >0 counts | Bins with >2000 counts | High rate bins dominated by noise | Noise dominated (total time) | Noise dominated (detector-on time) | Marked lightcurve |
|---|---|---|---|---|---|---|---|
| A | 8998 | 6195 | 83 | 83 | 0.92% | 1.34% | 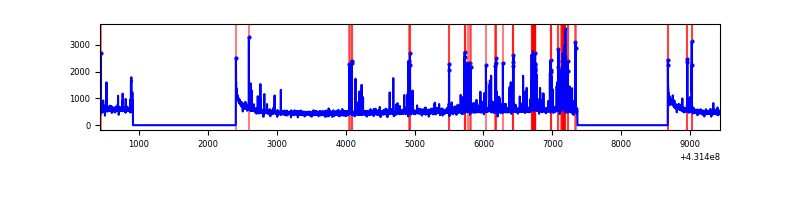 |
| B | 8998 | 6195 | 1 | 1 | 0.01% | 0.02% | 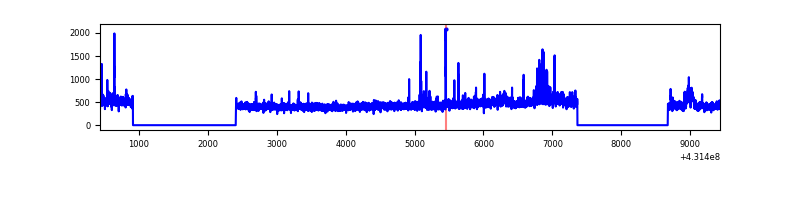 |
| C | 8998 | 6195 | 137 | 137 | 1.52% | 2.21% | 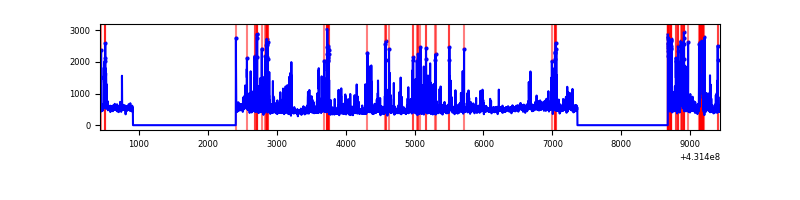 |
| D | 8999 | 6196 | 240 | 240 | 2.67% | 3.87% | 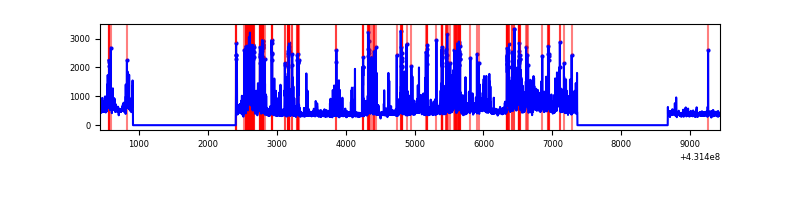 |
Top three noisy pixels from each quadrant. If the there are fewer than three noisy pixels in the level2.evt file, extra rows are filled as -1
| Pixel properties | Quadrant properties | ||||||
|---|---|---|---|---|---|---|---|
| Quadrant | DetID | PixID | Counts | Sigma | Mean | Median | Sigma |
| A | 10 | 83 | 649011 | 4725.21 | 663 | 648 | 137.2 |
| A | 15 | 237 | 311148 | 2262.89 | 663 | 648 | 137.2 |
| A | 2 | 79 | 65221 | 470.6 | 663 | 648 | 137.2 |
| B | 0 | 229 | 92956 | 703.16 | 666 | 646 | 131.3 |
| B | 4 | 171 | 27324 | 203.22 | 666 | 646 | 131.3 |
| B | 0 | 230 | 23535 | 174.35 | 666 | 646 | 131.3 |
| C | 12 | 2 | 434147 | 2874.35 | 646 | 649 | 150.8 |
| C | 5 | 250 | 325146 | 2151.61 | 646 | 649 | 150.8 |
| C | 15 | 214 | 249263 | 1648.46 | 646 | 649 | 150.8 |
| D | 12 | 6 | 451538 | 2856.09 | 643 | 624 | 157.9 |
| D | 1 | 52 | 373800 | 2363.7 | 643 | 624 | 157.9 |
| D | 13 | 249 | 269939 | 1705.84 | 643 | 624 | 157.9 |
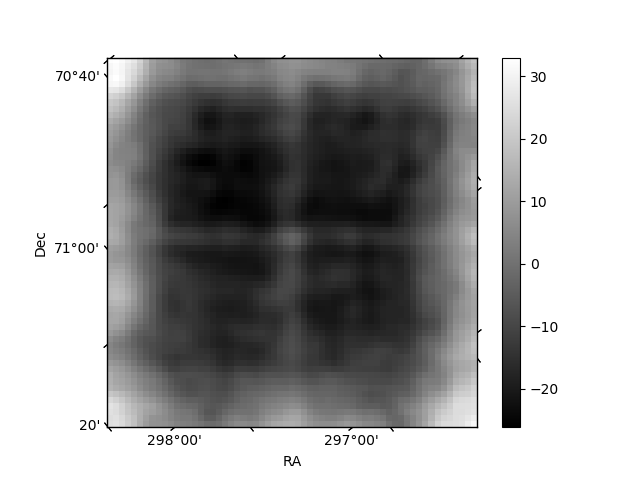
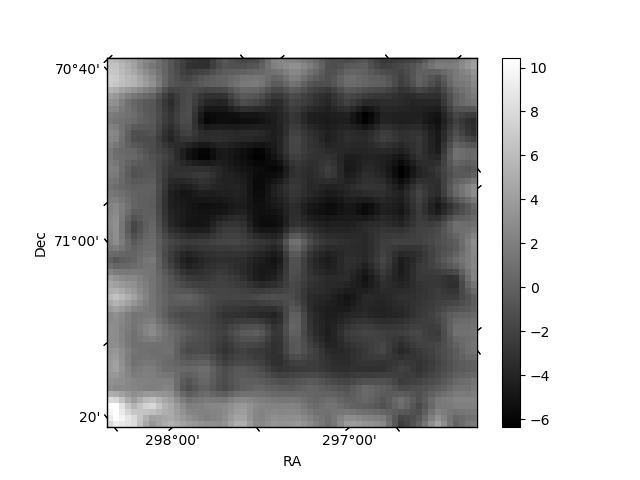
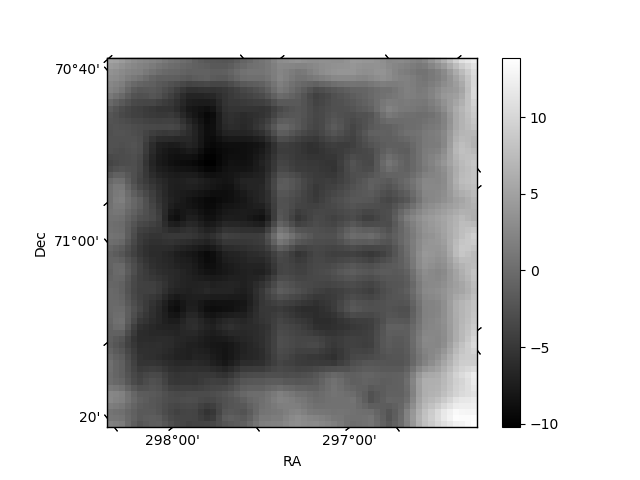
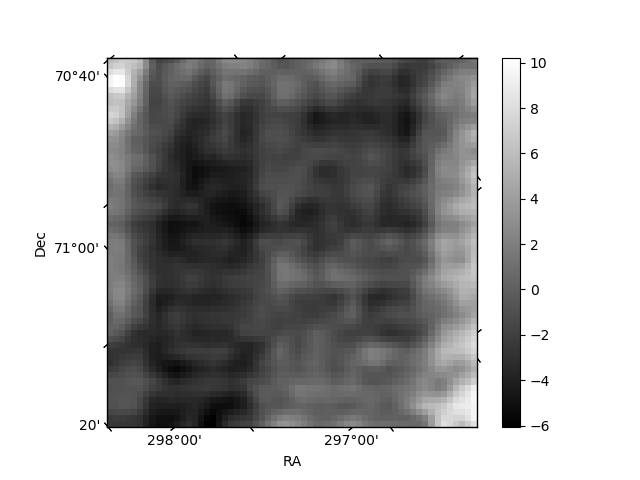
Histogram calculated using DETX and DETY for each event in the final _common_clean file
| Quadrant A | 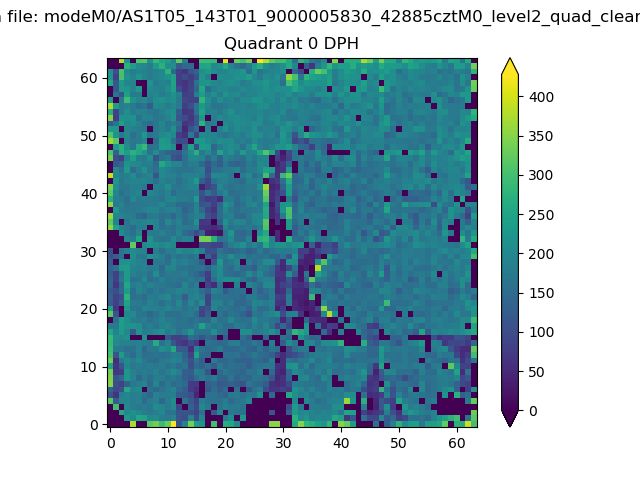 |
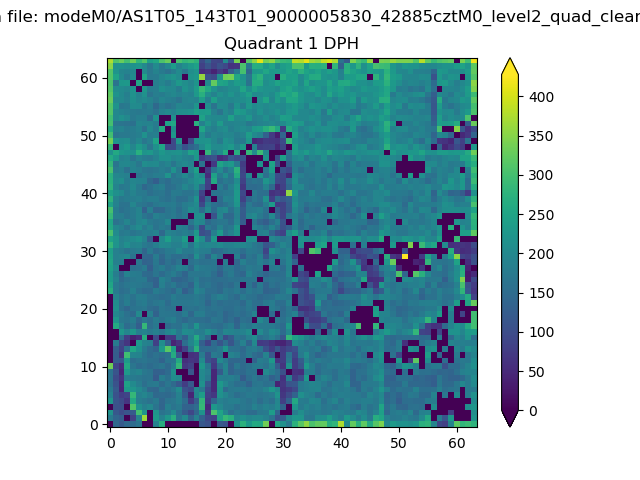 |
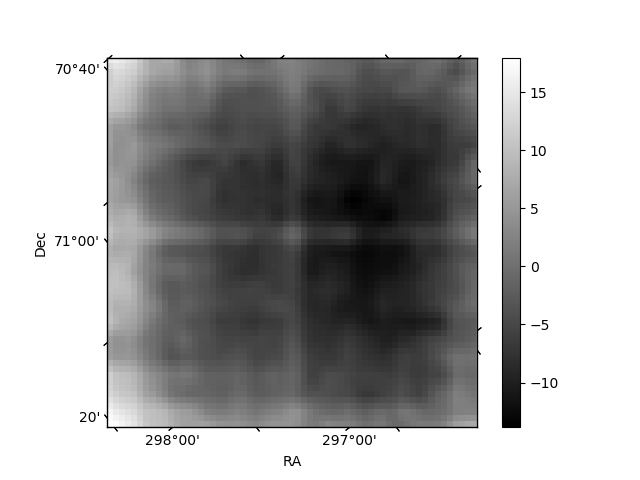
Quadrant B |
|---|---|---|---|
| Quadrant D | 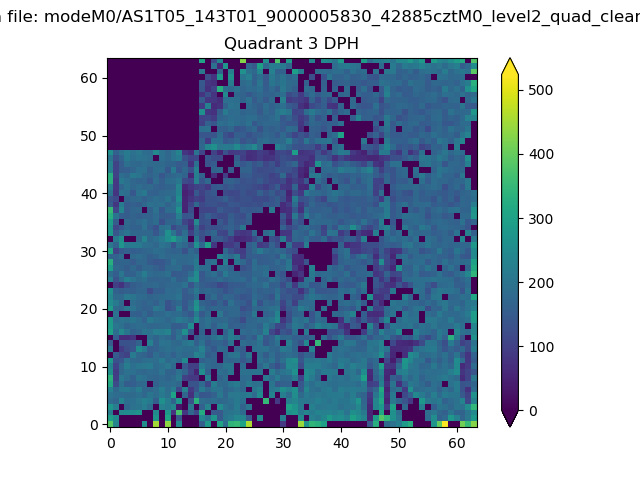 |
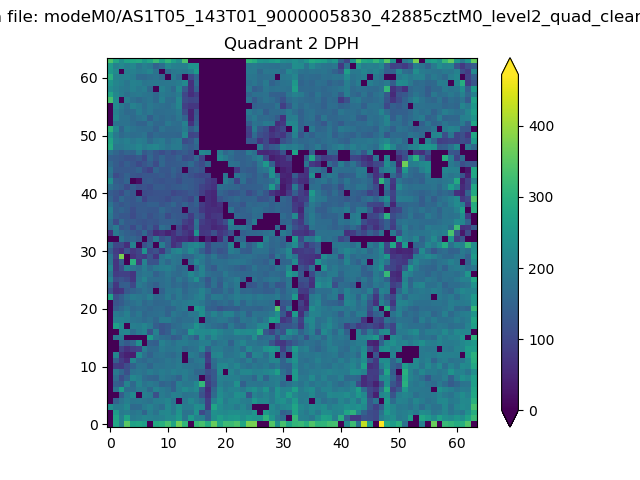 |
Quadrant C |
| Plot type | Count rate plots | Images |
|---|---|---|
| Comparison with Poisson distribution Blue bars denote a histogram of data divided into 1 sec bins. Red curve is a Poisson curve with rate = median count rate of data. |
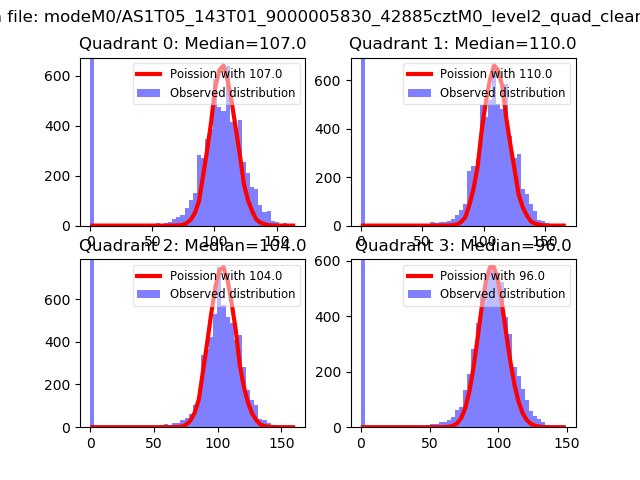 |
 |
| Quadrant-wise count rates Data is divided into 100 sec bins |
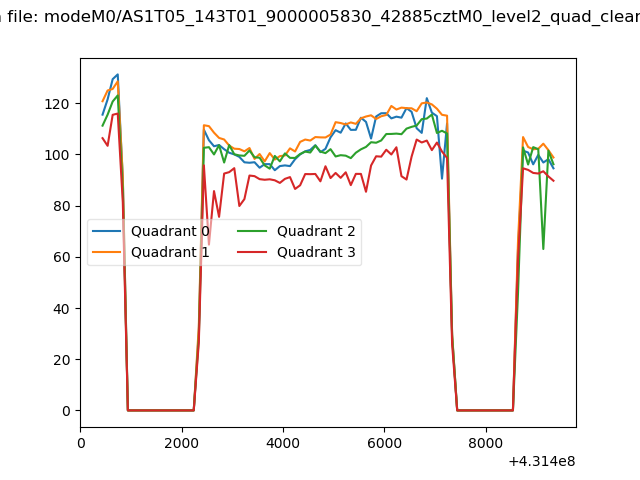 |
|
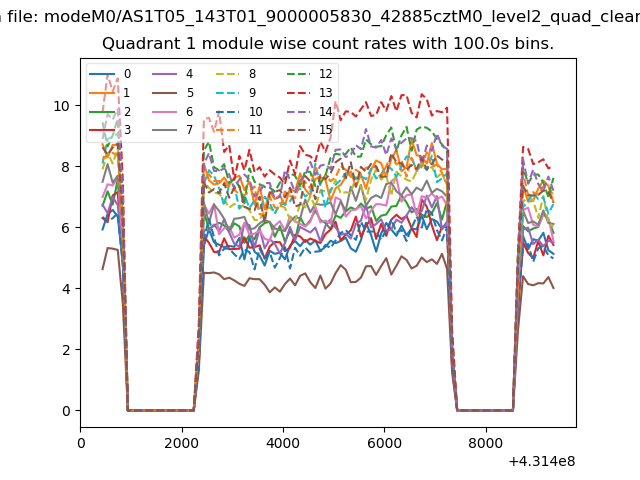
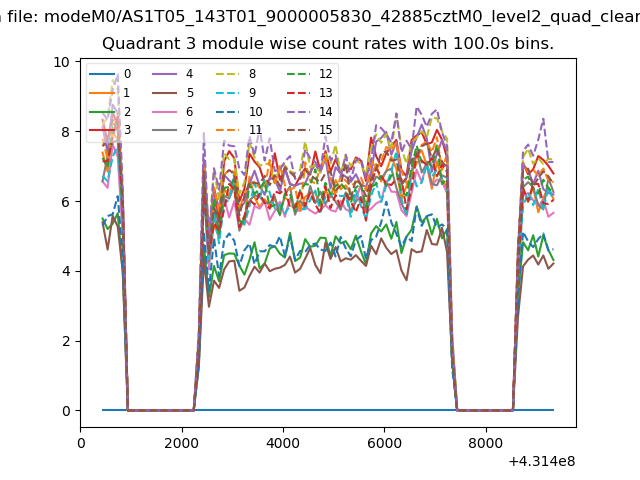
| Module-wise count rates for Quadrant A Data is divided into 100 sec bins |
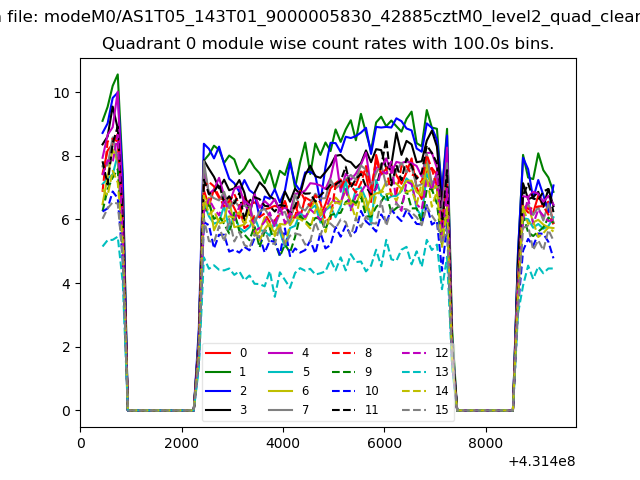 |
 |
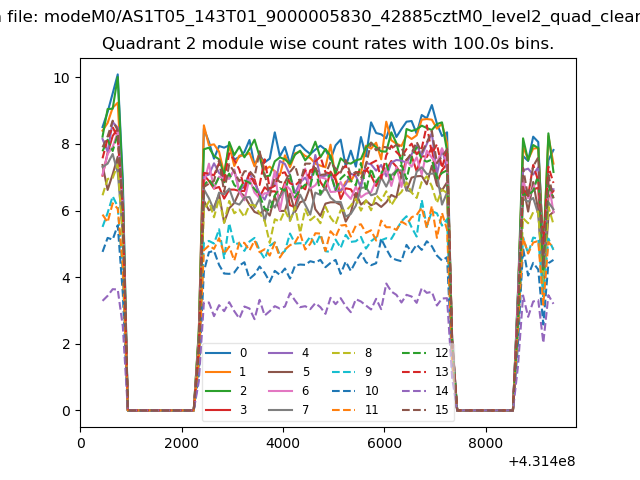
| Module-wise count rates for Quadrant B Data is divided into 100 sec bins |
 |
 |
| Module-wise count rates for Quadrant C Data is divided into 100 sec bins |
 |
 |
| Module-wise count rates for Quadrant D Data is divided into 100 sec bins |
 |
 |
| Parameter | Plot |
|---|---|
| CZT HV Monitor | 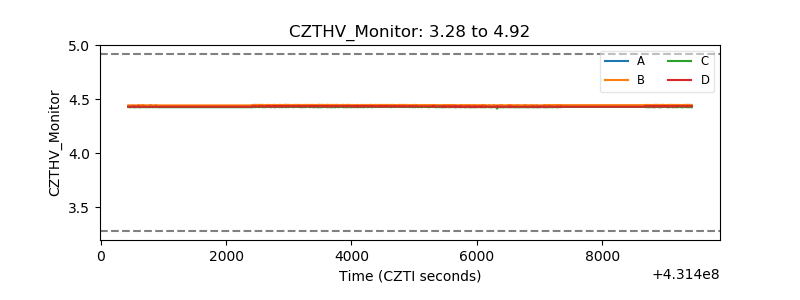 |
| D_VDD | 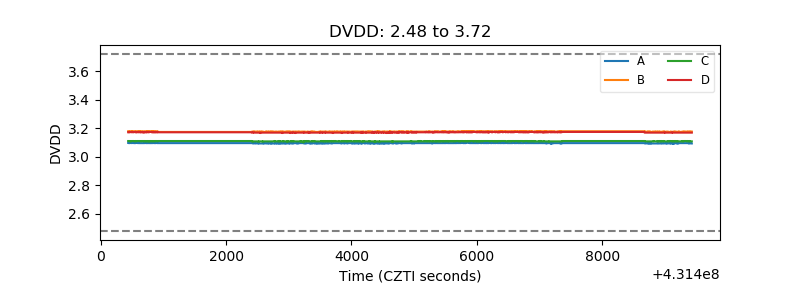 |
| Temperature 1 | 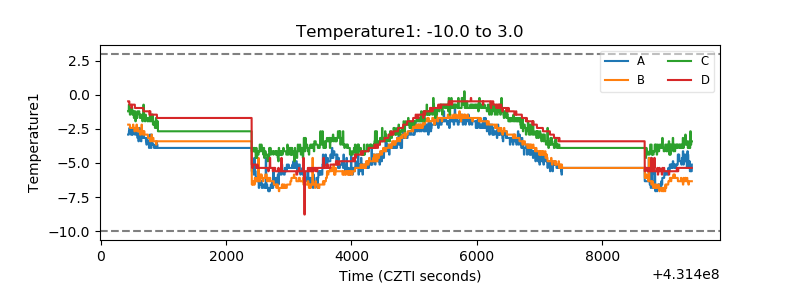 |
| Veto HV Monitor | 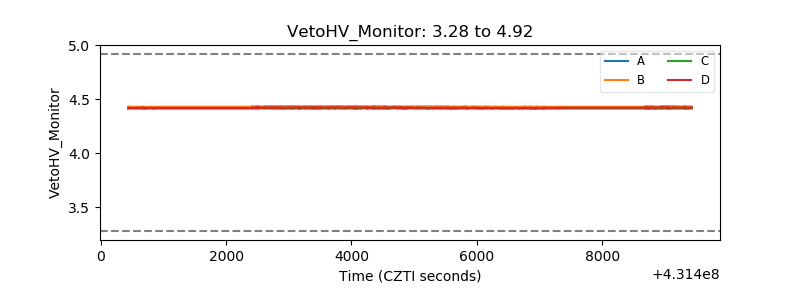 |
| Veto LLD | 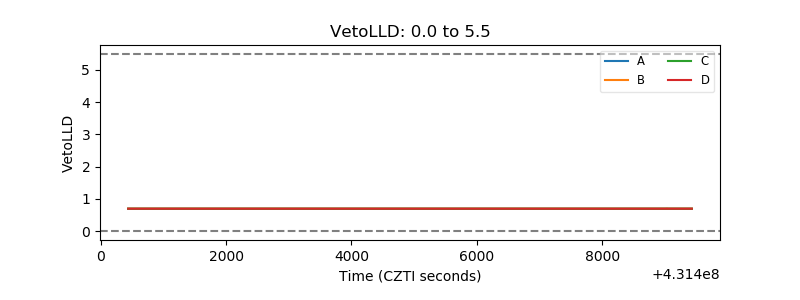 |
| Alpha Counter |  |
| _CPM_Rate | 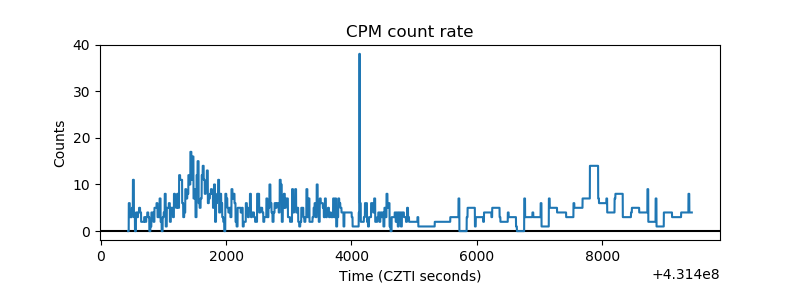 |
| CZT Counter | 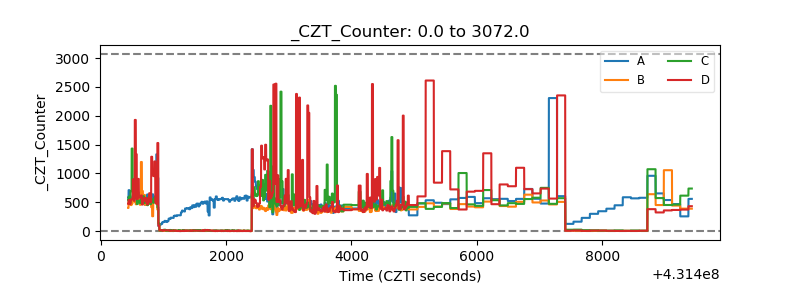 |
| +2.5 Volts monitor | 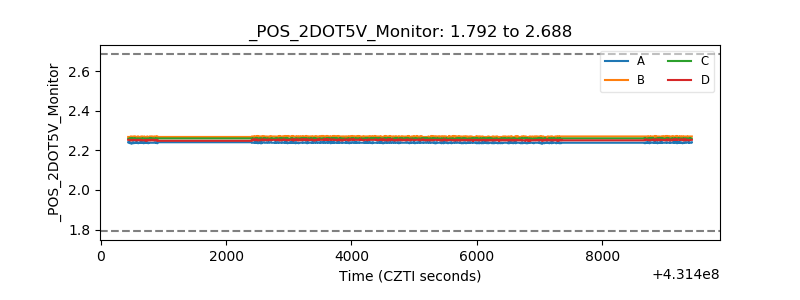 |
| +5 Volts monitor | 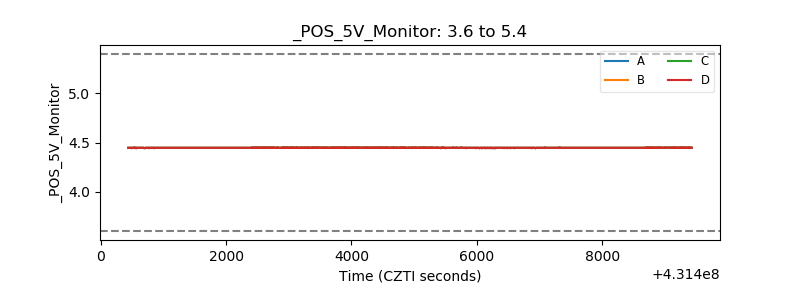 |
| _ROLL_ROT | 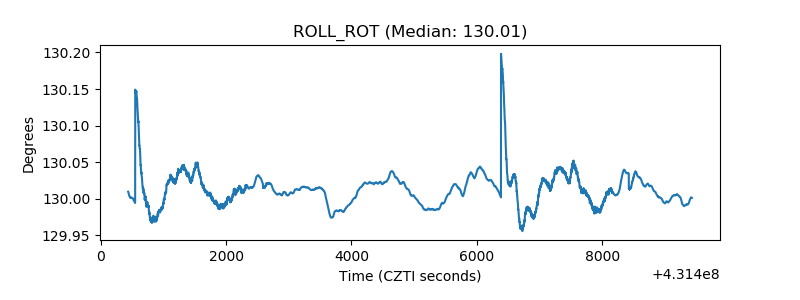 |
| _Roll_DEC | 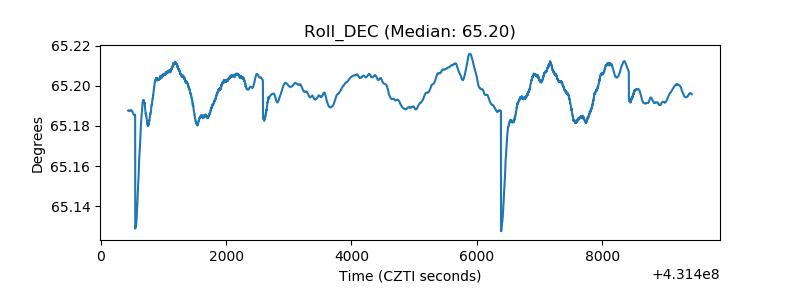 |
| _Roll_RA | 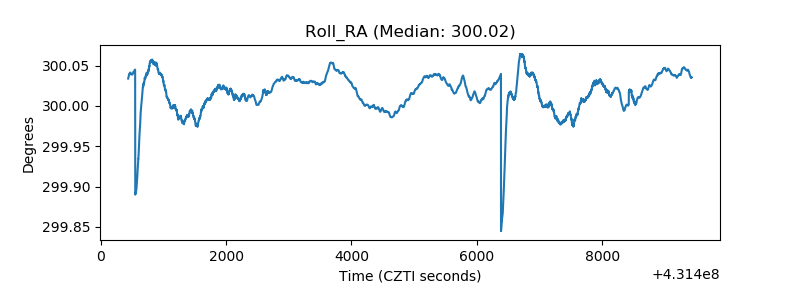 |
| Veto Counter | 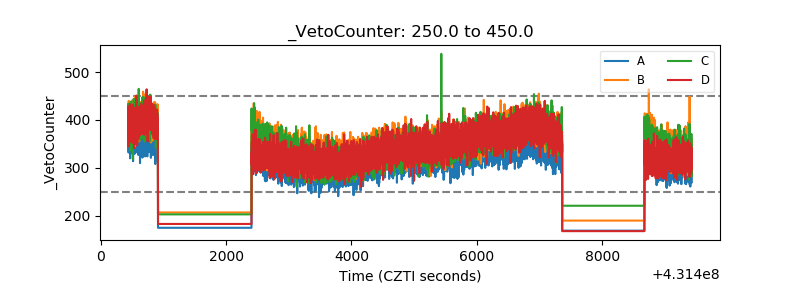 |