| Param | Original file | Final file |
|---|---|---|
| Filename | modeM0/AS1T05_143T01_9000005830_42888cztM0_level2.fits | modeM0/AS1T05_143T01_9000005830_42888cztM0_level2_quad_clean.evt |
| Size (bytes) | 1,163,422,080 | 259,015,680 |
| Size | 1.1 GB | 247.0 MB |
| Events in quadrant A | 10,576,226 | 1,705,961 |
| Events in quadrant B | 7,638,391 | 1,805,470 |
| Events in quadrant C | 13,472,267 | 1,644,717 |
| Events in quadrant D | 10,106,645 | 1,551,055 |
| Mode M0 | |||
|---|---|---|---|
| Quadrant | BADHDUFLAG | Total packets | Discarded packets |
| A | 0 | 41185 | 4 |
| B | 0 | 34208 | 4 |
| C | 0 | 50998 | 4 |
| D | 0 | 41622 | 4 |
| Mode M9 | |||
|---|---|---|---|
| Quadrant | BADHDUFLAG | Total packets | Discarded packets |
| A | 0 | 55 | 0 |
| B | 0 | 55 | 0 |
| C | 0 | 55 | 0 |
| D | 0 | 55 | 0 |
| Mode SS | |||
|---|---|---|---|
| Quadrant | BADHDUFLAG | Total packets | Discarded packets |
| A | 0 | 336 | 0 |
| B | 0 | 336 | 0 |
| C | 0 | 336 | 0 |
| D | 0 | 336 | 0 |
| Quadrant | Total seconds | Saturated seconds | Saturation percentage |
|---|---|---|---|
| A | 16455 | 730 | 4.436342% |
| B | 16456 | 66 | 0.401070% |
| C | 16455 | 889 | 5.402613% |
| D | 16455 | 403 | 2.449104% |
Noise dominated data is calculated using 1-second bins in cleaned event files. If a bin has >2000 counts, and if more than 50% of those come from <1% of pixels, then it is considered to be noise-dominated and hence unusable.
| Quadrant | # 1 sec bins | Bins with >0 counts | Bins with >2000 counts | High rate bins dominated by noise | Noise dominated (total time) | Noise dominated (detector-on time) | Marked lightcurve |
|---|---|---|---|---|---|---|---|
| A | 21912 | 16459 | 525 | 525 | 2.40% | 3.19% | 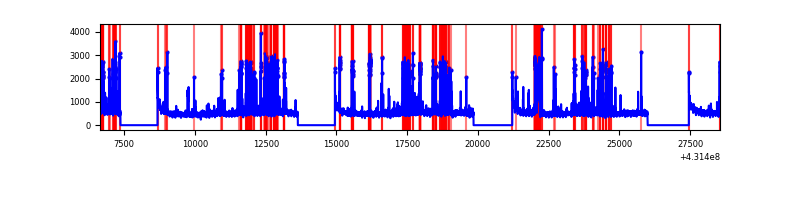 |
| B | 21913 | 16460 | 38 | 38 | 0.17% | 0.23% | 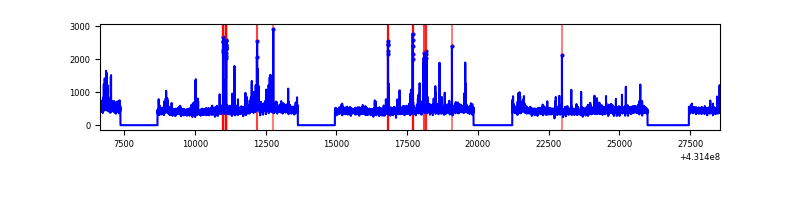 |
| C | 21912 | 16459 | 895 | 895 | 4.08% | 5.44% | 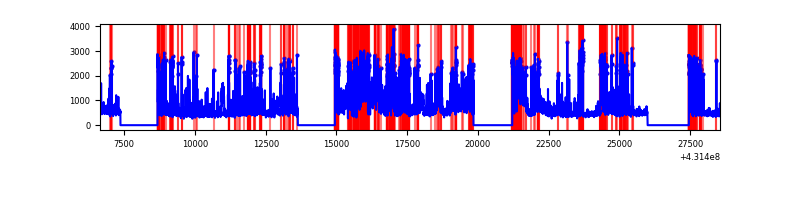 |
| D | 21912 | 16458 | 380 | 380 | 1.73% | 2.31% | 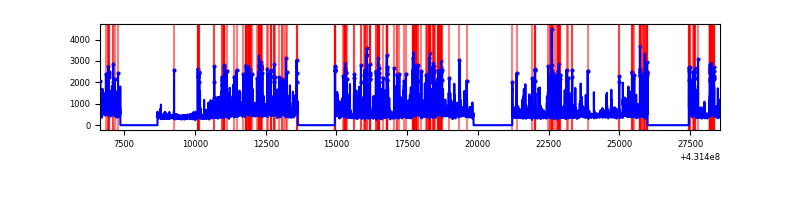 |
Top three noisy pixels from each quadrant. If the there are fewer than three noisy pixels in the level2.evt file, extra rows are filled as -1
| Pixel properties | Quadrant properties | ||||||
|---|---|---|---|---|---|---|---|
| Quadrant | DetID | PixID | Counts | Sigma | Mean | Median | Sigma |
| A | 15 | 237 | 2081617 | 5772.65 | 1754 | 1719 | 360.3 |
| A | 10 | 83 | 1560589 | 4326.57 | 1754 | 1719 | 360.3 |
| A | 13 | 248 | 97534 | 265.93 | 1754 | 1719 | 360.3 |
| B | 0 | 229 | 178715 | 517.15 | 1784 | 1736 | 342.2 |
| B | 0 | 190 | 88139 | 252.48 | 1784 | 1736 | 342.2 |
| B | 5 | 172 | 76332 | 217.98 | 1784 | 1736 | 342.2 |
| C | 5 | 250 | 2595451 | 6545.39 | 1712 | 1720 | 396.3 |
| C | 12 | 2 | 1917081 | 4833.5 | 1712 | 1720 | 396.3 |
| C | 5 | 233 | 863781 | 2175.45 | 1712 | 1720 | 396.3 |
| D | 1 | 52 | 1071646 | 2558.24 | 1732 | 1682 | 418.2 |
| D | 1 | 47 | 686725 | 1637.91 | 1732 | 1682 | 418.2 |
| D | 13 | 249 | 541449 | 1290.56 | 1732 | 1682 | 418.2 |
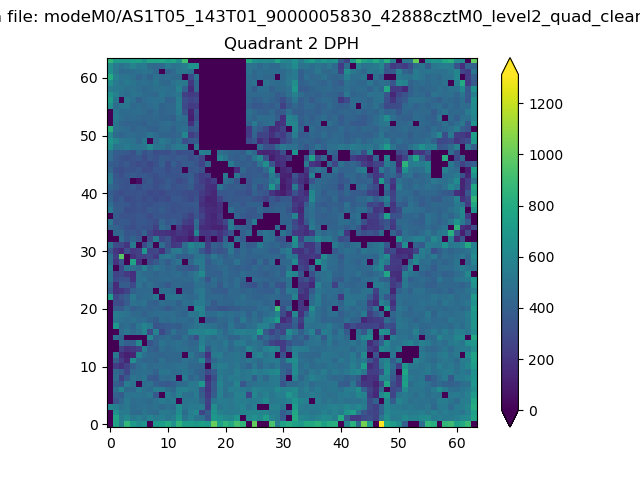
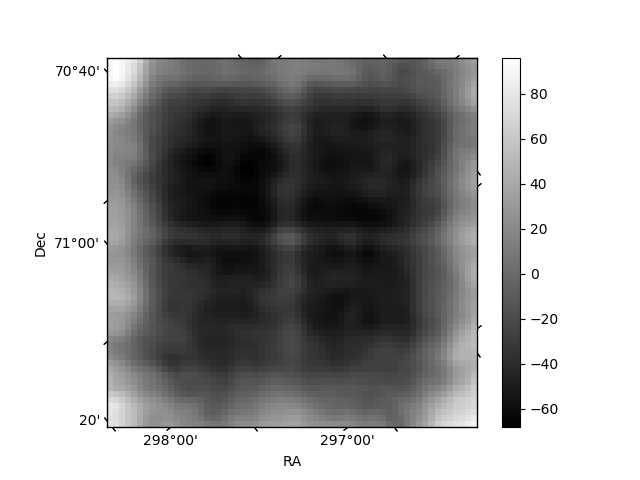
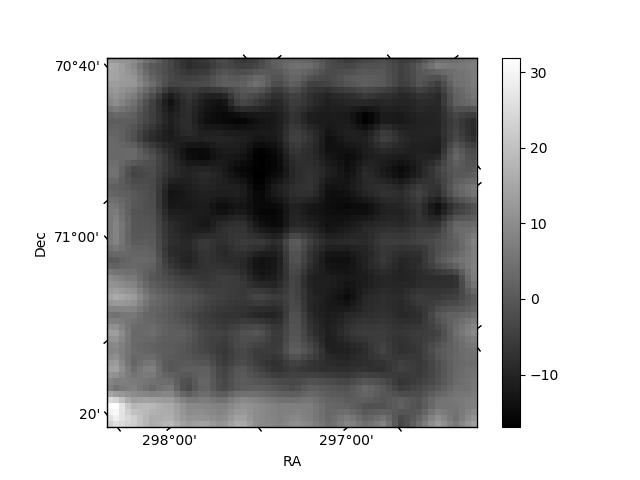
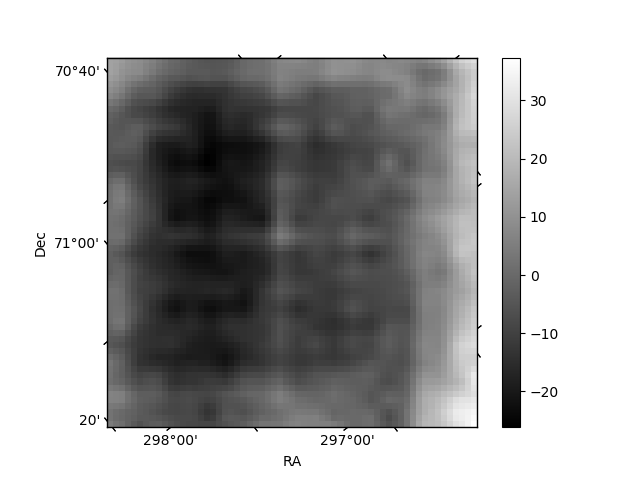
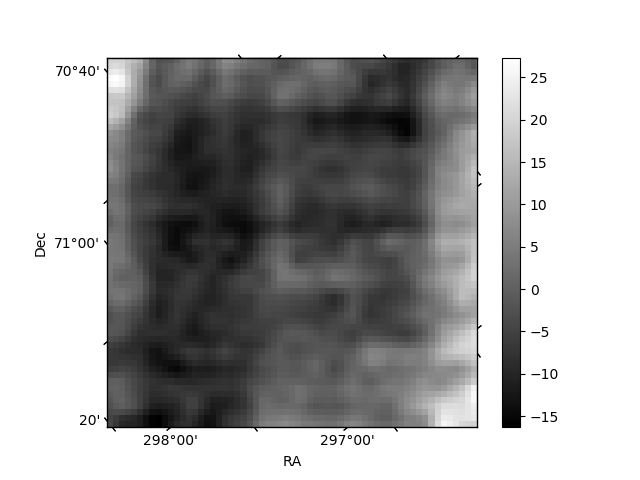
Histogram calculated using DETX and DETY for each event in the final _common_clean file
| Quadrant A | 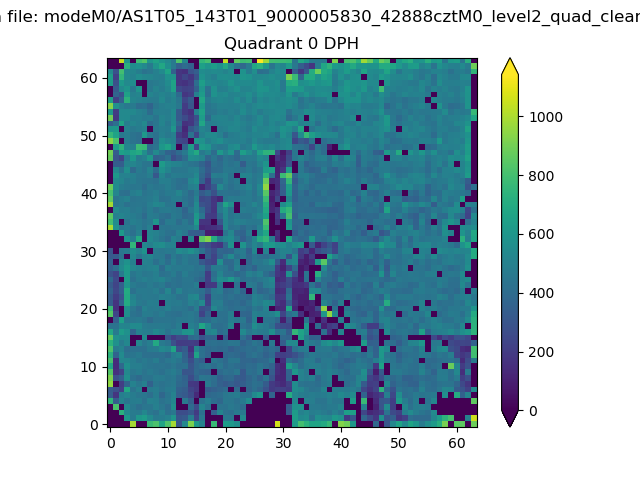 |
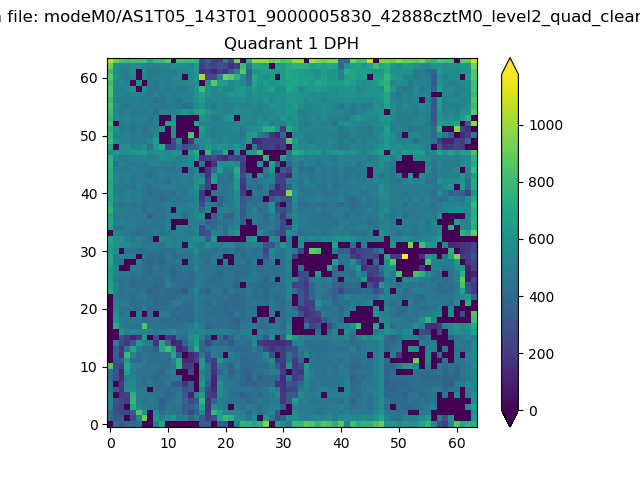 |
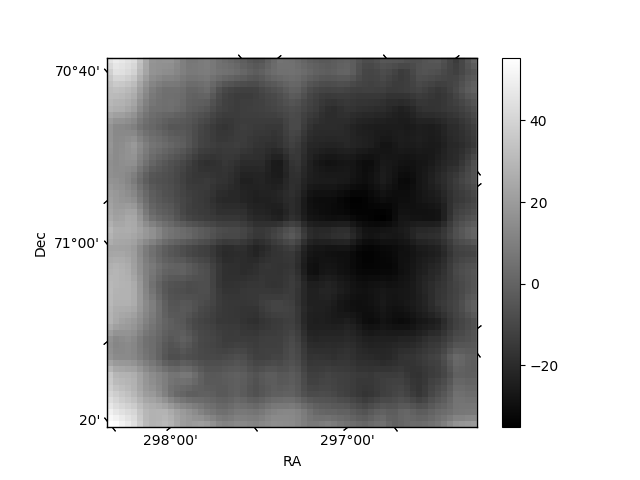
Quadrant B |
|---|---|---|---|
| Quadrant D | 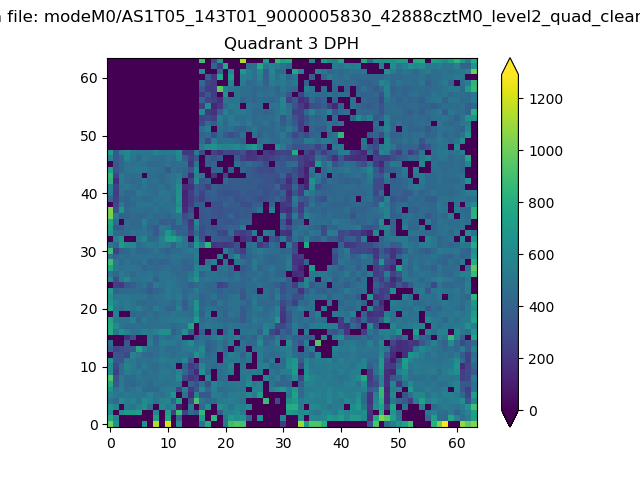 |
 |
Quadrant C |
| Plot type | Count rate plots | Images |
|---|---|---|
| Comparison with Poisson distribution Blue bars denote a histogram of data divided into 1 sec bins. Red curve is a Poisson curve with rate = median count rate of data. |
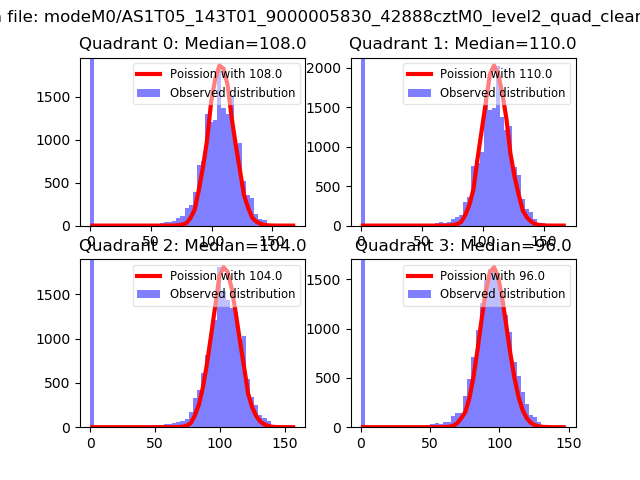 |
 |
| Quadrant-wise count rates Data is divided into 100 sec bins |
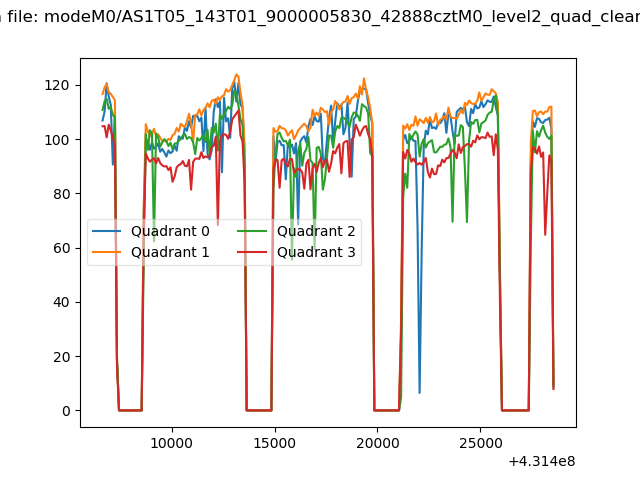 |
|
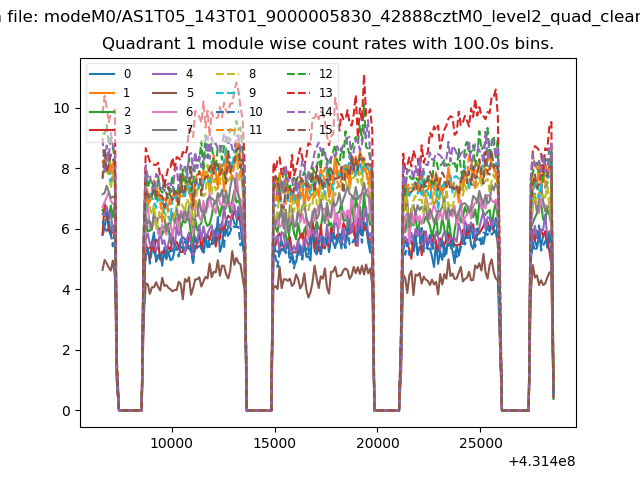
| Module-wise count rates for Quadrant A Data is divided into 100 sec bins |
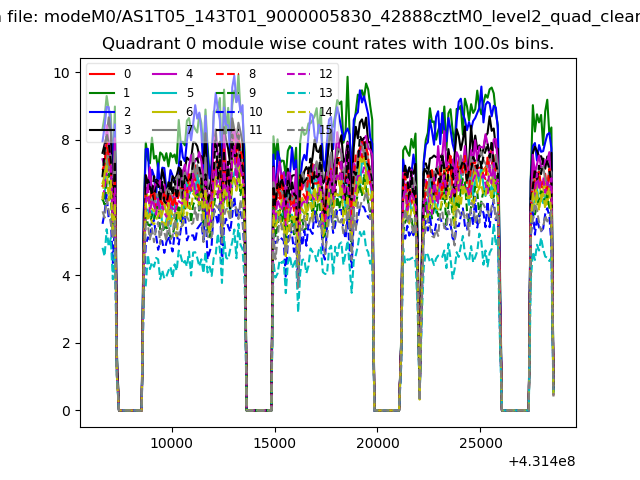 |
 |
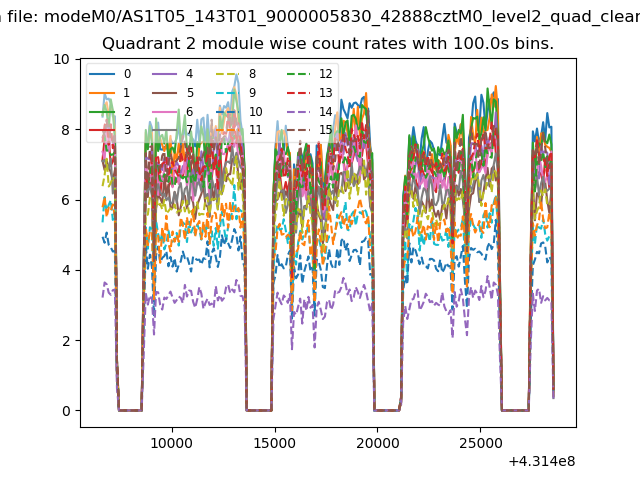
| Module-wise count rates for Quadrant B Data is divided into 100 sec bins |
 |
 |
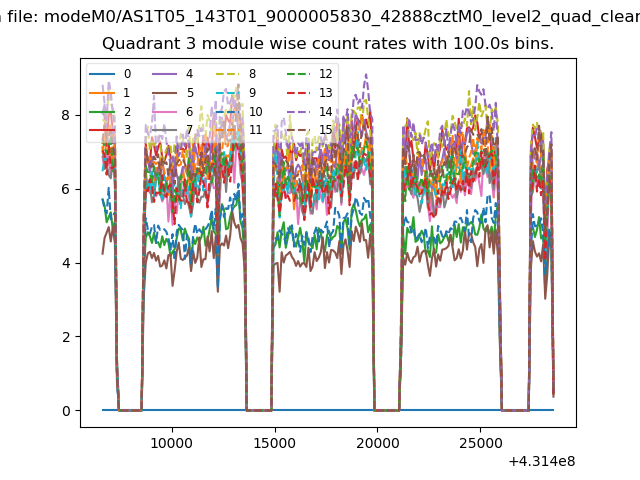
| Module-wise count rates for Quadrant C Data is divided into 100 sec bins |
 |
 |
| Module-wise count rates for Quadrant D Data is divided into 100 sec bins |
 |
 |
| Parameter | Plot |
|---|---|
| CZT HV Monitor | 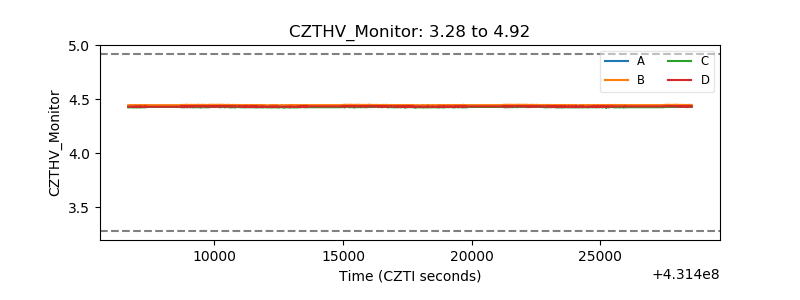 |
| D_VDD | 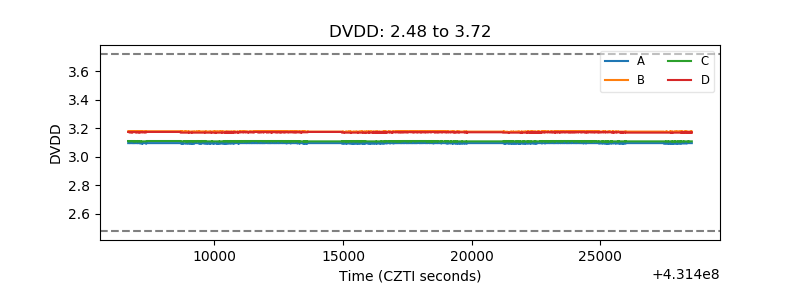 |
| Temperature 1 | 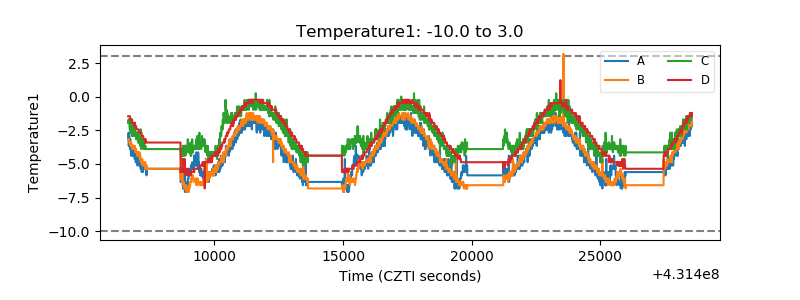 |
| Veto HV Monitor | 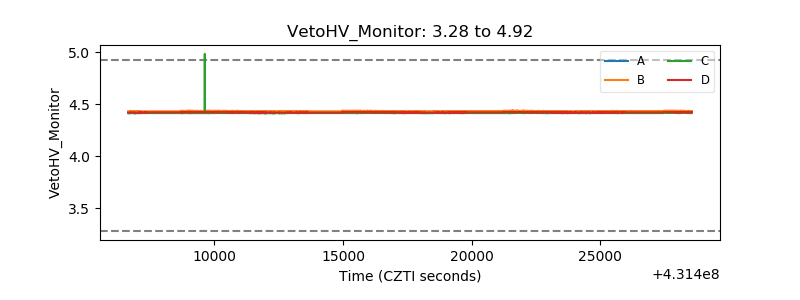 |
| Veto LLD | 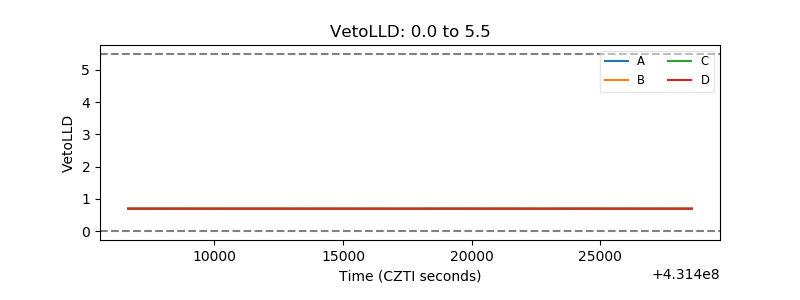 |
| Alpha Counter | 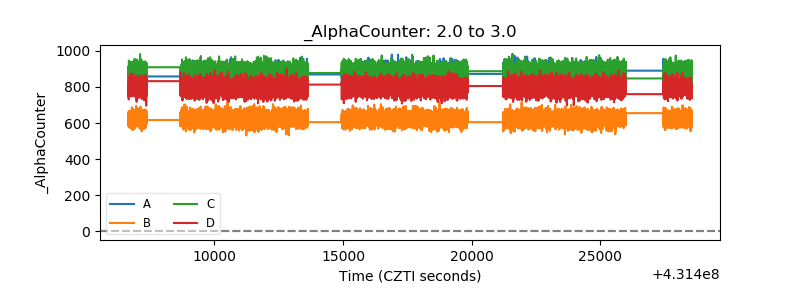 |
| _CPM_Rate | 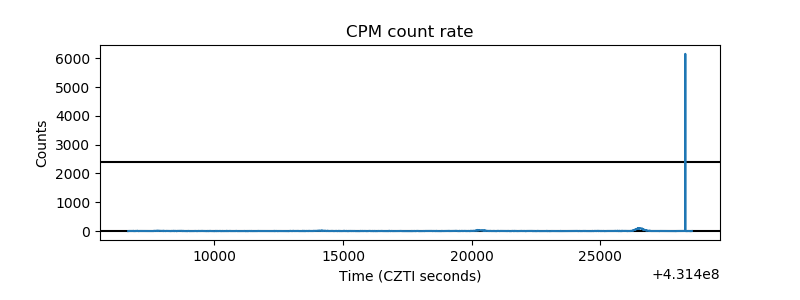 |
| CZT Counter | 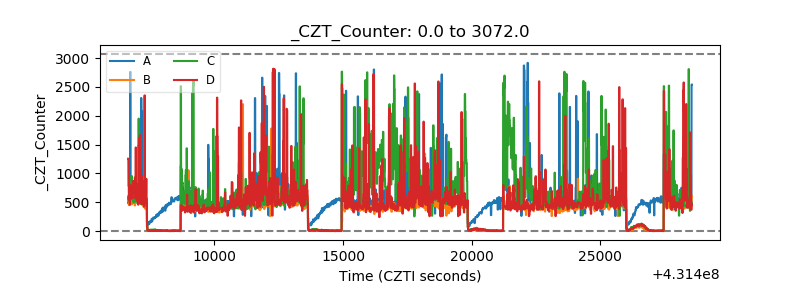 |
| +2.5 Volts monitor |  |
| +5 Volts monitor | 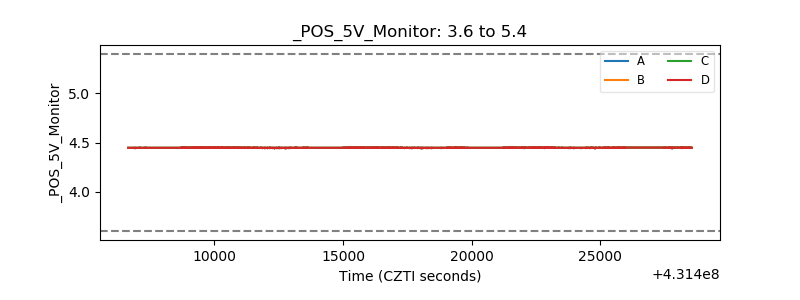 |
| _ROLL_ROT | 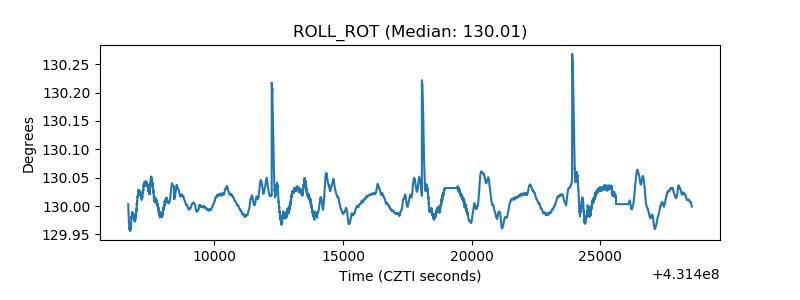 |
| _Roll_DEC | 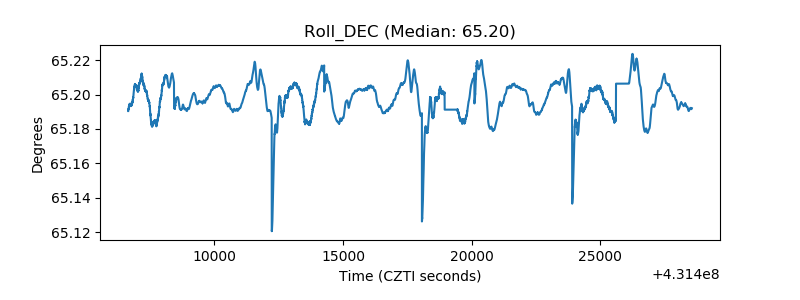 |
| _Roll_RA | 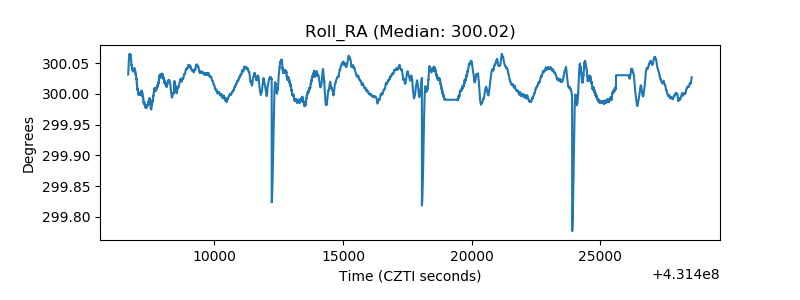 |
| Veto Counter | 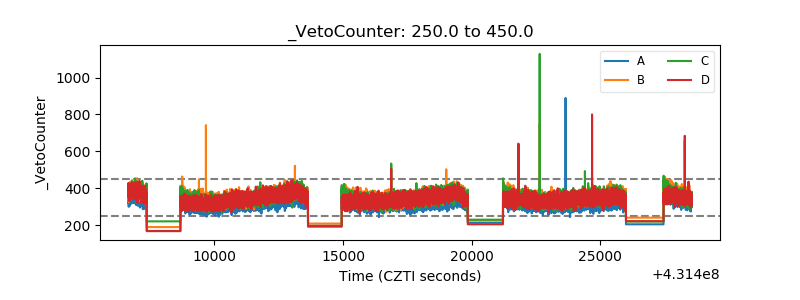 |