| Param | Original file | Final file |
|---|---|---|
| Filename | modeM0/AS1T05_143T01_9000005830_42889cztM0_level2.fits | modeM0/AS1T05_143T01_9000005830_42889cztM0_level2_quad_clean.evt |
| Size (bytes) | 390,836,160 | 92,468,160 |
| Size | 372.7 MB | 88.2 MB |
| Events in quadrant A | 3,598,235 | 623,753 |
| Events in quadrant B | 2,764,577 | 641,683 |
| Events in quadrant C | 3,741,184 | 587,755 |
| Events in quadrant D | 3,917,464 | 545,858 |
| Mode M0 | |||
|---|---|---|---|
| Quadrant | BADHDUFLAG | Total packets | Discarded packets |
| A | 0 | 14148 | 2 |
| B | 0 | 12225 | 2 |
| C | 0 | 14844 | 2 |
| D | 0 | 15514 | 2 |
| Mode M9 | |||
|---|---|---|---|
| Quadrant | BADHDUFLAG | Total packets | Discarded packets |
| A | 0 | 29 | 0 |
| B | 0 | 30 | 0 |
| C | 0 | 30 | 0 |
| D | 0 | 30 | 0 |
| Mode SS | |||
|---|---|---|---|
| Quadrant | BADHDUFLAG | Total packets | Discarded packets |
| A | 0 | 116 | 0 |
| B | 0 | 116 | 0 |
| C | 0 | 116 | 0 |
| D | 0 | 116 | 0 |
| Quadrant | Total seconds | Saturated seconds | Saturation percentage |
|---|---|---|---|
| A | 5734 | 133 | 2.319498% |
| B | 5734 | 68 | 1.185909% |
| C | 5734 | 157 | 2.738054% |
| D | 5734 | 216 | 3.767004% |
Noise dominated data is calculated using 1-second bins in cleaned event files. If a bin has >2000 counts, and if more than 50% of those come from <1% of pixels, then it is considered to be noise-dominated and hence unusable.
| Quadrant | # 1 sec bins | Bins with >0 counts | Bins with >2000 counts | High rate bins dominated by noise | Noise dominated (total time) | Noise dominated (detector-on time) | Marked lightcurve |
|---|---|---|---|---|---|---|---|
| A | 7317 | 5735 | 111 | 111 | 1.52% | 1.94% | 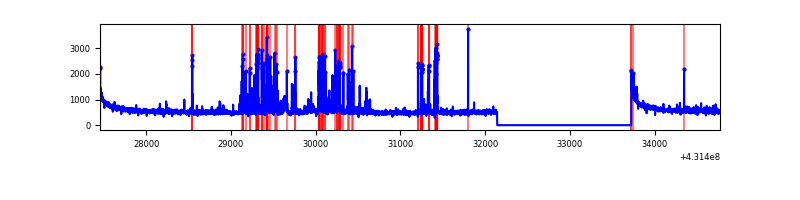 |
| B | 7317 | 5735 | 51 | 51 | 0.70% | 0.89% | 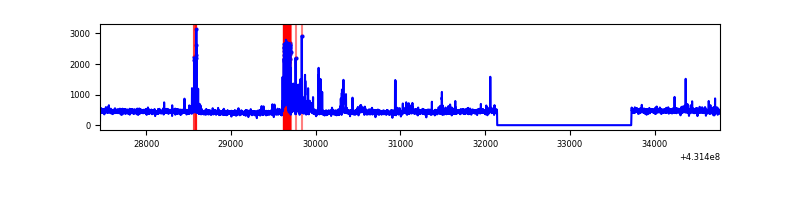 |
| C | 7317 | 5735 | 147 | 147 | 2.01% | 2.56% | 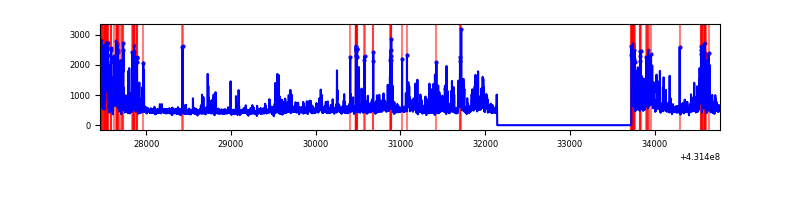 |
| D | 7317 | 5735 | 220 | 220 | 3.01% | 3.84% | 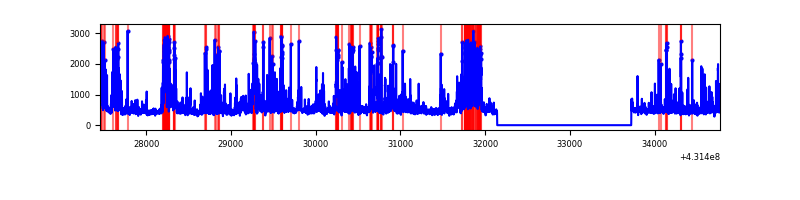 |
Top three noisy pixels from each quadrant. If the there are fewer than three noisy pixels in the level2.evt file, extra rows are filled as -1
| Pixel properties | Quadrant properties | ||||||
|---|---|---|---|---|---|---|---|
| Quadrant | DetID | PixID | Counts | Sigma | Mean | Median | Sigma |
| A | 10 | 83 | 608051 | 4742.27 | 625 | 612 | 128.1 |
| A | 15 | 237 | 518760 | 4045.18 | 625 | 612 | 128.1 |
| A | 13 | 248 | 23943 | 182.14 | 625 | 612 | 128.1 |
| B | 15 | 85 | 134511 | 1106.17 | 621 | 605 | 121.1 |
| B | 3 | 112 | 97832 | 803.17 | 621 | 605 | 121.1 |
| B | 5 | 172 | 44564 | 363.14 | 621 | 605 | 121.1 |
| C | 12 | 2 | 645272 | 4586.11 | 599 | 601 | 140.6 |
| C | 15 | 214 | 246967 | 1752.62 | 599 | 601 | 140.6 |
| C | 5 | 250 | 194331 | 1378.17 | 599 | 601 | 140.6 |
| D | 1 | 52 | 456730 | 3077.6 | 603 | 585 | 148.2 |
| D | 12 | 6 | 375514 | 2529.63 | 603 | 585 | 148.2 |
| D | 13 | 249 | 257578 | 1733.92 | 603 | 585 | 148.2 |
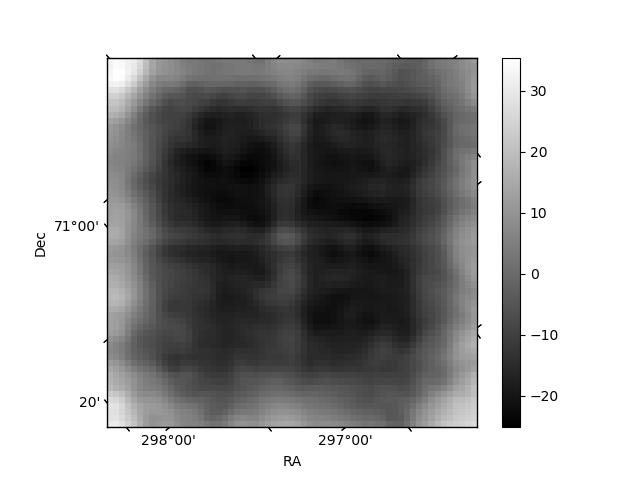
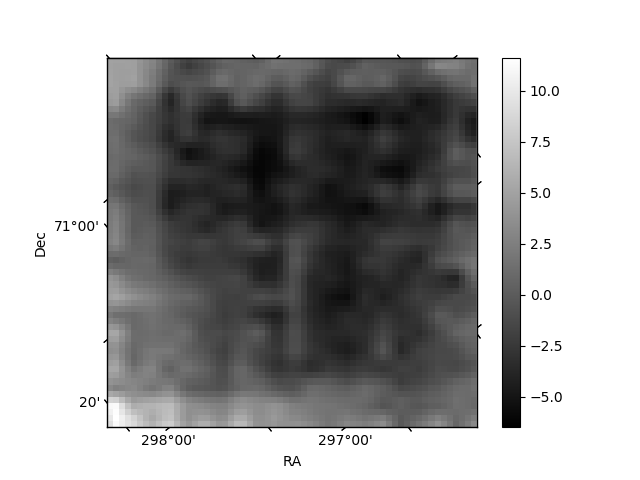
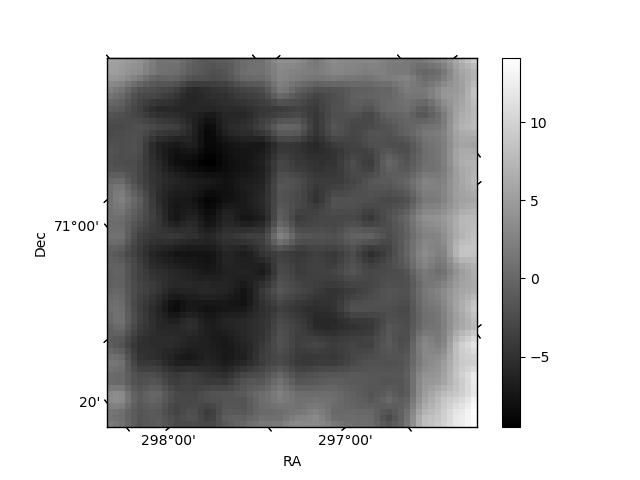
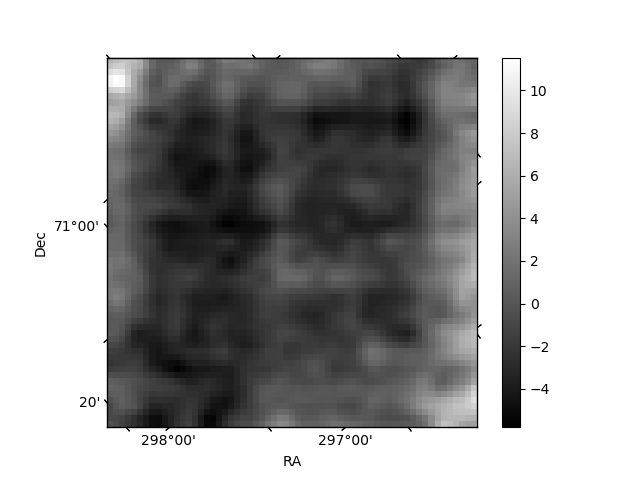
Histogram calculated using DETX and DETY for each event in the final _common_clean file
| Quadrant A | 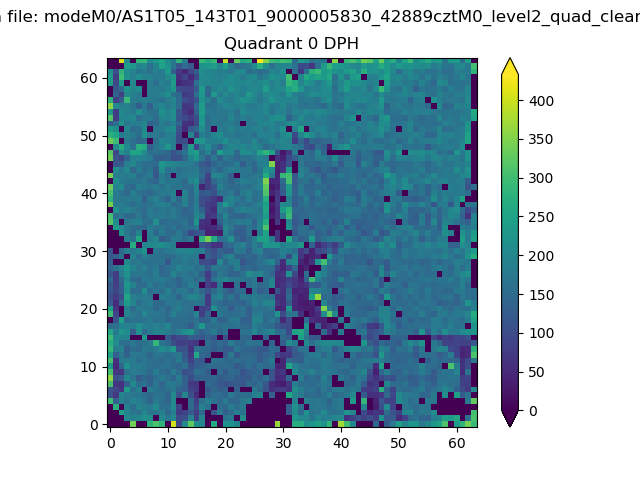 |
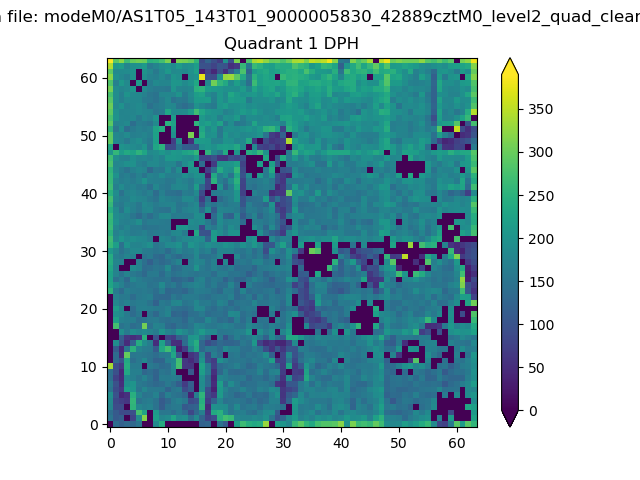 |
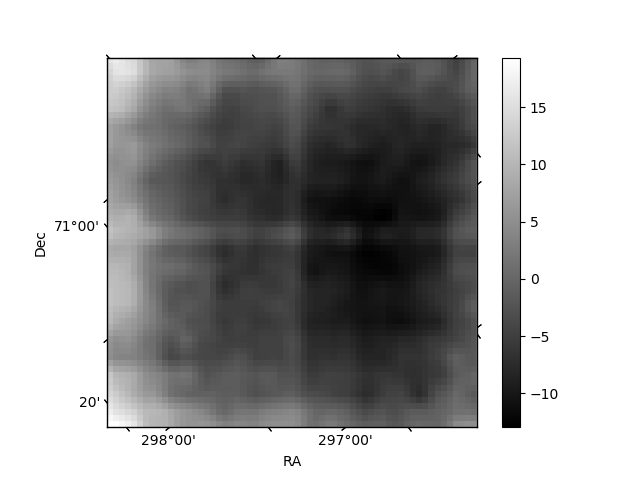
Quadrant B |
|---|---|---|---|
| Quadrant D | 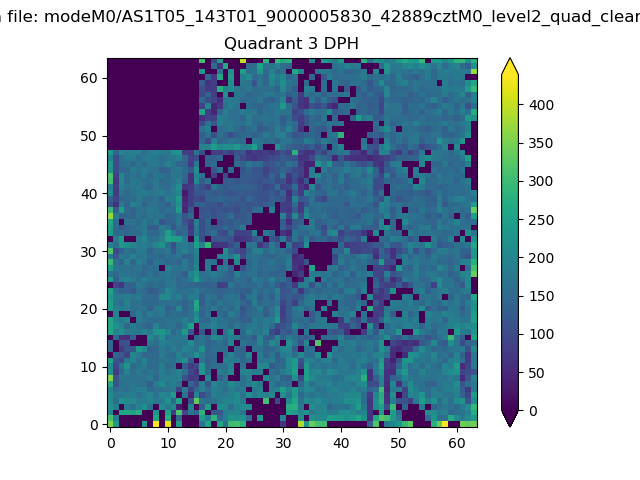 |
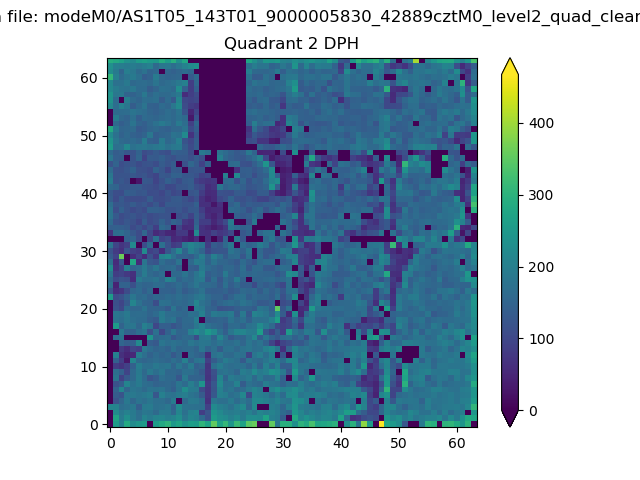 |
Quadrant C |
| Plot type | Count rate plots | Images |
|---|---|---|
| Comparison with Poisson distribution Blue bars denote a histogram of data divided into 1 sec bins. Red curve is a Poisson curve with rate = median count rate of data. |
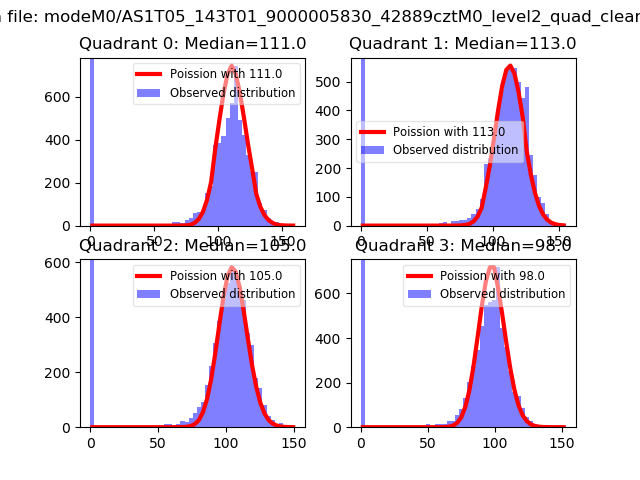 |
 |
| Quadrant-wise count rates Data is divided into 100 sec bins |
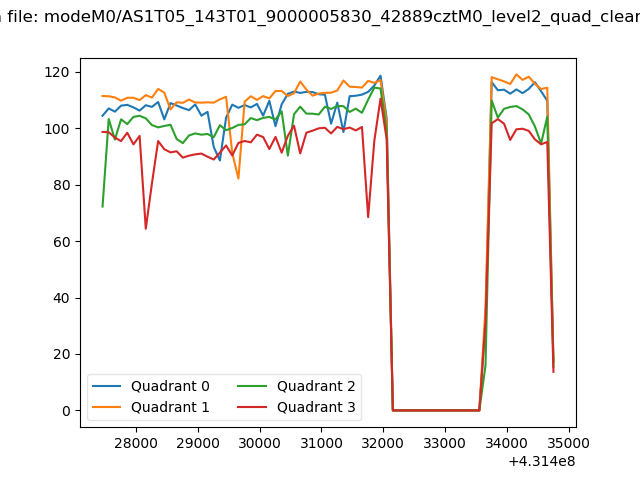 |
|
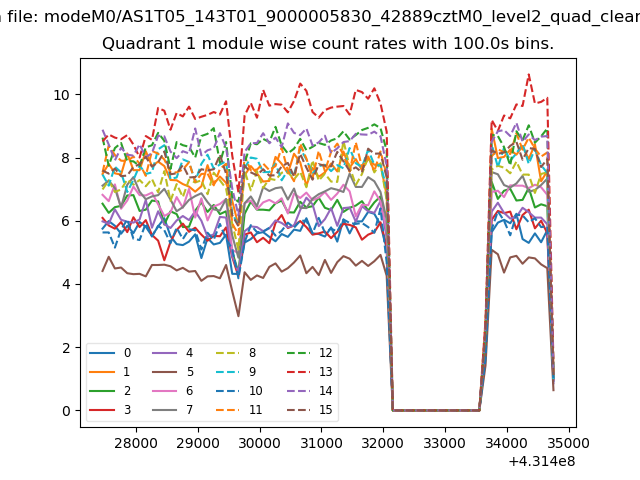
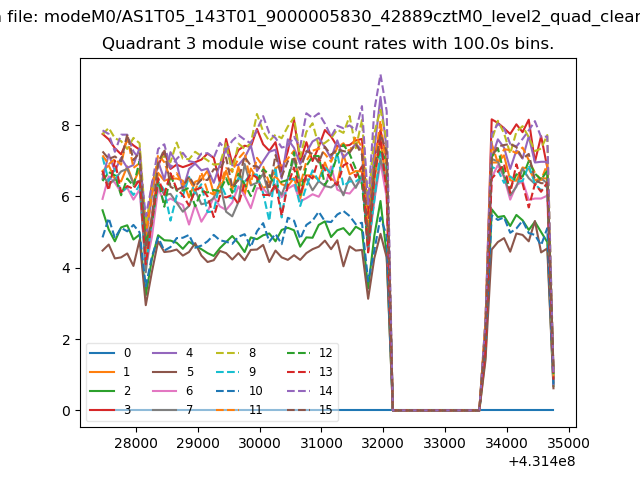
| Module-wise count rates for Quadrant A Data is divided into 100 sec bins |
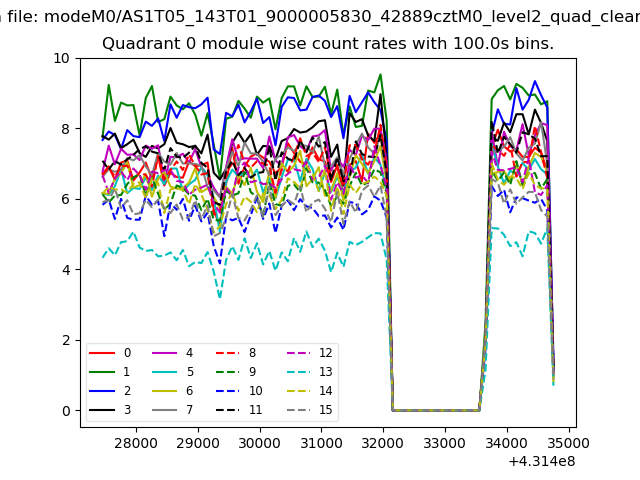 |
 |
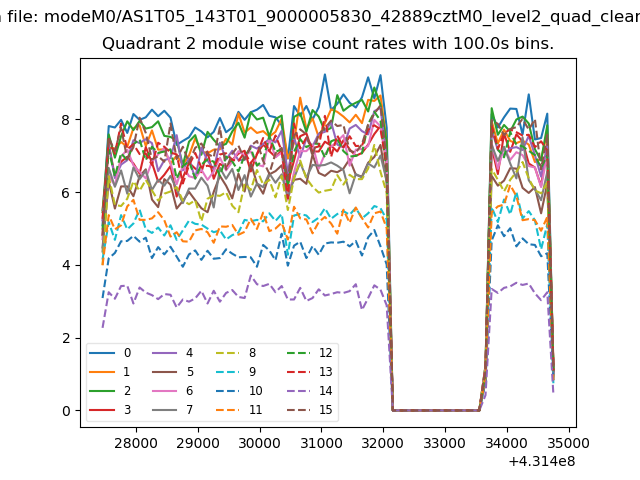
| Module-wise count rates for Quadrant B Data is divided into 100 sec bins |
 |
 |
| Module-wise count rates for Quadrant C Data is divided into 100 sec bins |
 |
 |
| Module-wise count rates for Quadrant D Data is divided into 100 sec bins |
 |
 |
| Parameter | Plot |
|---|---|
| CZT HV Monitor | 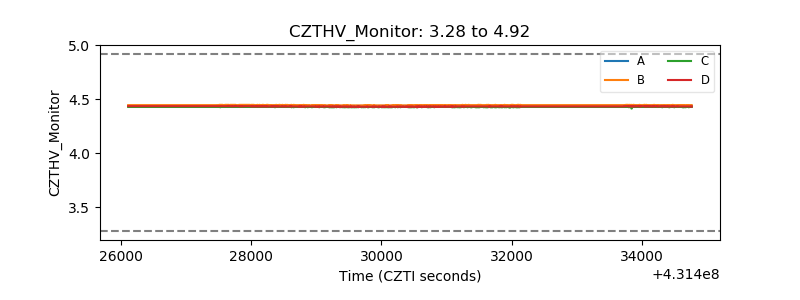 |
| D_VDD | 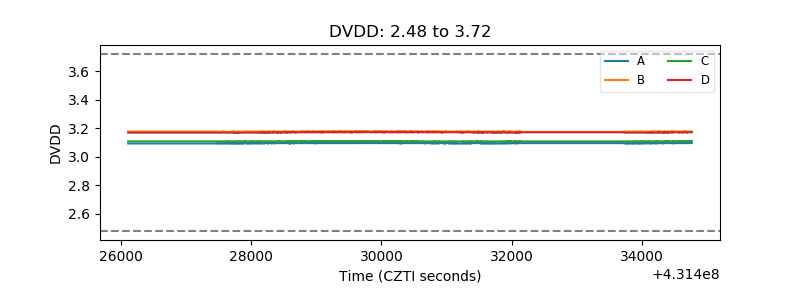 |
| Temperature 1 | 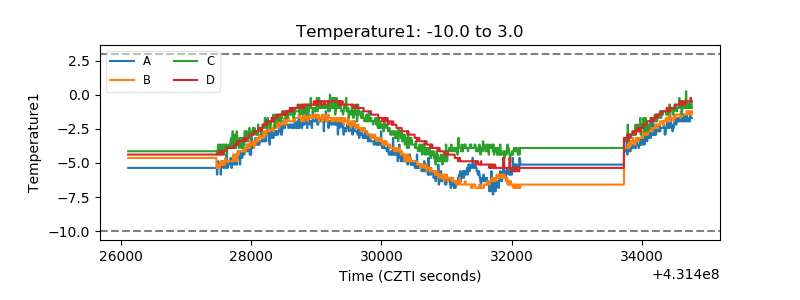 |
| Veto HV Monitor | 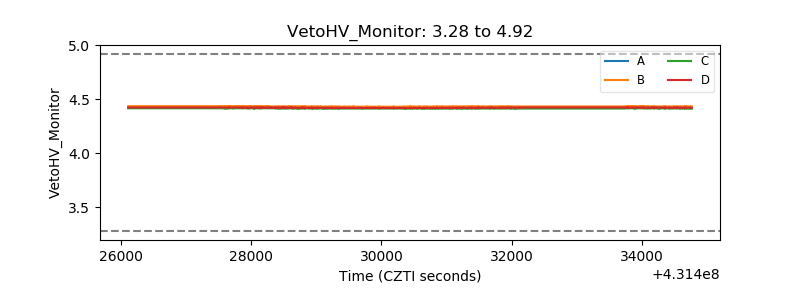 |
| Veto LLD | 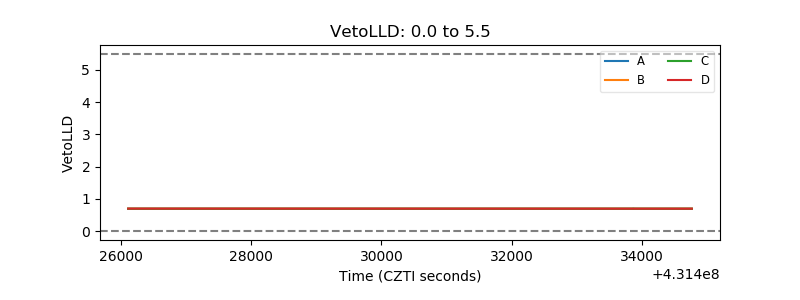 |
| Alpha Counter | 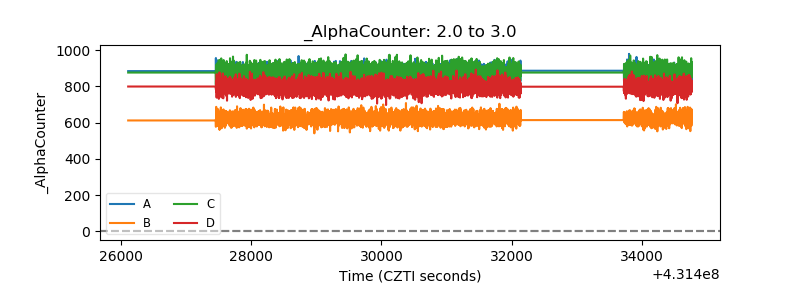 |
| _CPM_Rate | 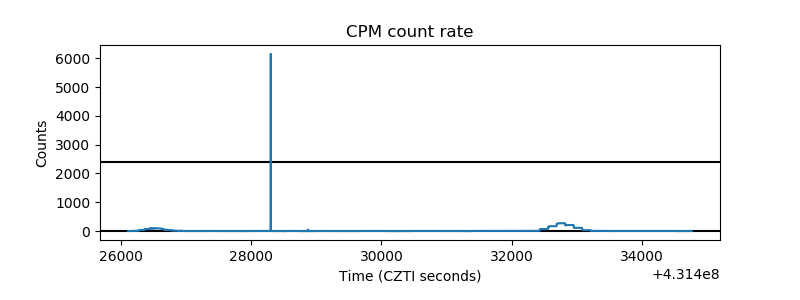 |
| CZT Counter | 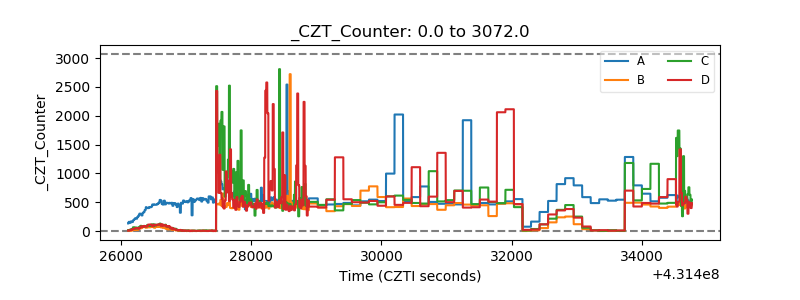 |
| +2.5 Volts monitor | 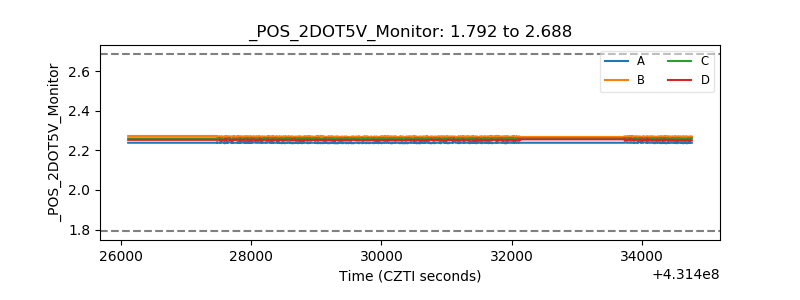 |
| +5 Volts monitor | 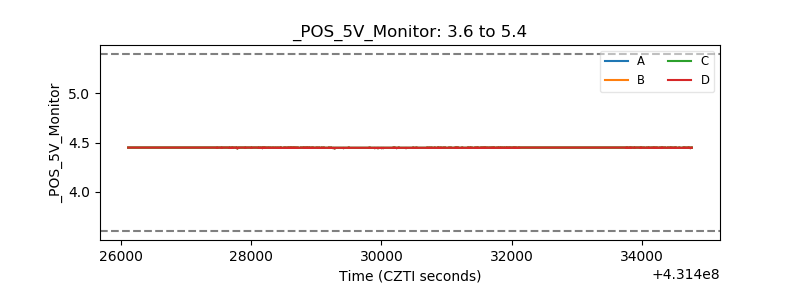 |
| _ROLL_ROT | 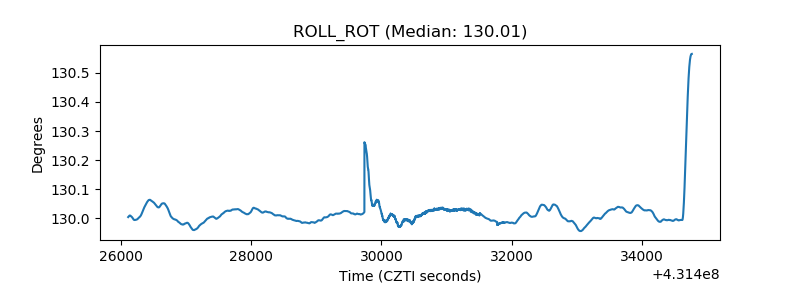 |
| _Roll_DEC | 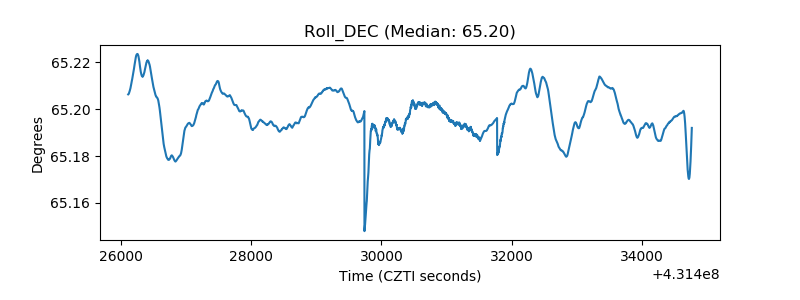 |
| _Roll_RA | 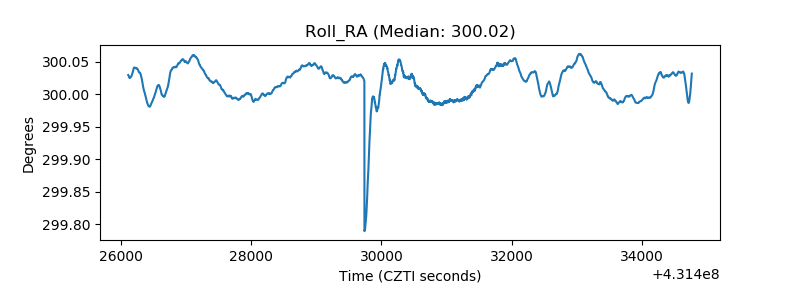 |
| Veto Counter | 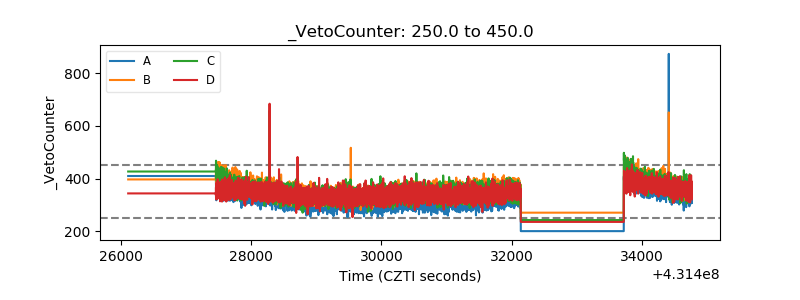 |