| Param | Original file | Final file |
|---|---|---|
| Filename | modeM0/AS1T05_143T01_9000005830_42890cztM0_level2.fits | modeM0/AS1T05_143T01_9000005830_42890cztM0_level2_quad_clean.evt |
| Size (bytes) | 435,358,080 | 85,320,000 |
| Size | 415.2 MB | 81.4 MB |
| Events in quadrant A | 3,356,668 | 596,679 |
| Events in quadrant B | 2,583,869 | 615,543 |
| Events in quadrant C | 5,675,168 | 478,044 |
| Events in quadrant D | 4,078,469 | 513,719 |
| Mode M0 | |||
|---|---|---|---|
| Quadrant | BADHDUFLAG | Total packets | Discarded packets |
| A | 0 | 13322 | 1 |
| B | 0 | 11502 | 1 |
| C | 0 | 20473 | 1 |
| D | 0 | 15819 | 1 |
| Mode M9 | |||
|---|---|---|---|
| Quadrant | BADHDUFLAG | Total packets | Discarded packets |
| A | 0 | 17 | 0 |
| B | 0 | 17 | 0 |
| C | 0 | 17 | 0 |
| D | 0 | 17 | 0 |
| Mode SS | |||
|---|---|---|---|
| Quadrant | BADHDUFLAG | Total packets | Discarded packets |
| A | 0 | 110 | 0 |
| B | 0 | 110 | 0 |
| C | 0 | 110 | 0 |
| D | 0 | 110 | 0 |
| Quadrant | Total seconds | Saturated seconds | Saturation percentage |
|---|---|---|---|
| A | 5419 | 168 | 3.100203% |
| B | 5419 | 64 | 1.181030% |
| C | 5420 | 1028 | 18.966790% |
| D | 5420 | 353 | 6.512915% |
Noise dominated data is calculated using 1-second bins in cleaned event files. If a bin has >2000 counts, and if more than 50% of those come from <1% of pixels, then it is considered to be noise-dominated and hence unusable.
| Quadrant | # 1 sec bins | Bins with >0 counts | Bins with >2000 counts | High rate bins dominated by noise | Noise dominated (total time) | Noise dominated (detector-on time) | Marked lightcurve |
|---|---|---|---|---|---|---|---|
| A | 7122 | 5420 | 124 | 124 | 1.74% | 2.29% | 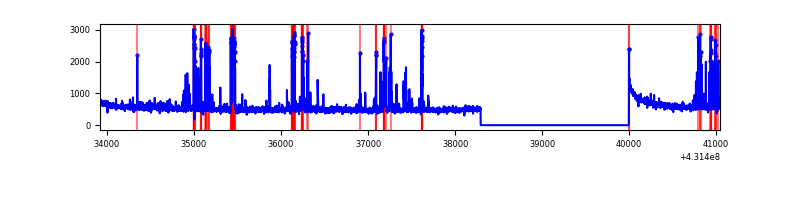 |
| B | 7122 | 5420 | 35 | 35 | 0.49% | 0.65% | 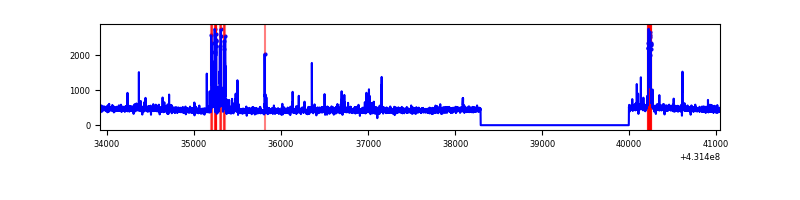 |
| C | 7123 | 5421 | 980 | 980 | 13.76% | 18.08% |  |
| D | 7123 | 5421 | 319 | 319 | 4.48% | 5.88% | 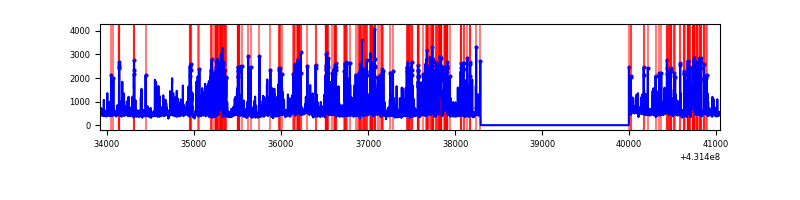 |
Top three noisy pixels from each quadrant. If the there are fewer than three noisy pixels in the level2.evt file, extra rows are filled as -1
| Pixel properties | Quadrant properties | ||||||
|---|---|---|---|---|---|---|---|
| Quadrant | DetID | PixID | Counts | Sigma | Mean | Median | Sigma |
| A | 10 | 83 | 532030 | 4394.2 | 584 | 571 | 120.9 |
| A | 15 | 237 | 524538 | 4332.25 | 584 | 571 | 120.9 |
| A | 13 | 248 | 13176 | 104.22 | 584 | 571 | 120.9 |
| B | 15 | 85 | 102678 | 899.77 | 586 | 571 | 113.5 |
| B | 5 | 172 | 65020 | 567.93 | 586 | 571 | 113.5 |
| B | 3 | 112 | 43890 | 381.73 | 586 | 571 | 113.5 |
| C | 12 | 2 | 2895974 | 24560.19 | 504 | 506 | 117.9 |
| C | 15 | 208 | 231488 | 1959.26 | 504 | 506 | 117.9 |
| C | 15 | 214 | 205838 | 1741.68 | 504 | 506 | 117.9 |
| D | 1 | 52 | 1410605 | 10249.88 | 561 | 544 | 137.6 |
| D | 13 | 249 | 168302 | 1219.45 | 561 | 544 | 137.6 |
| D | 12 | 6 | 117569 | 850.67 | 561 | 544 | 137.6 |
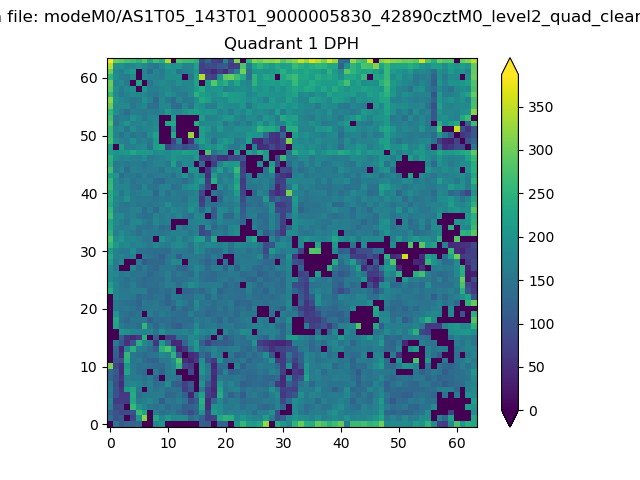
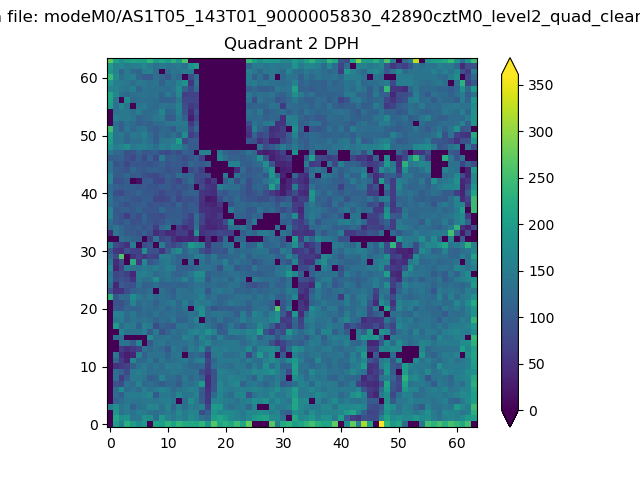
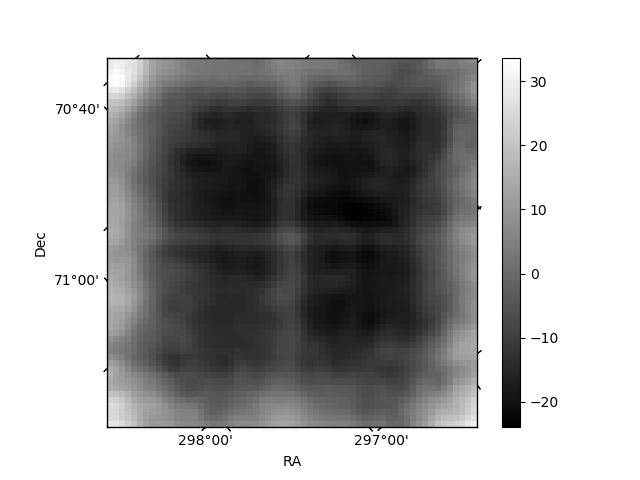
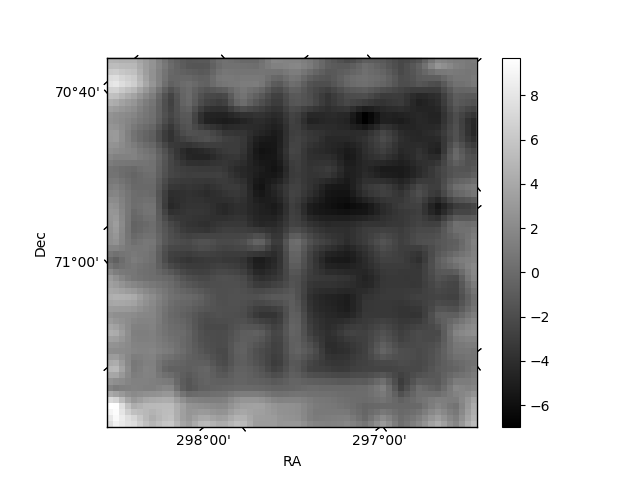
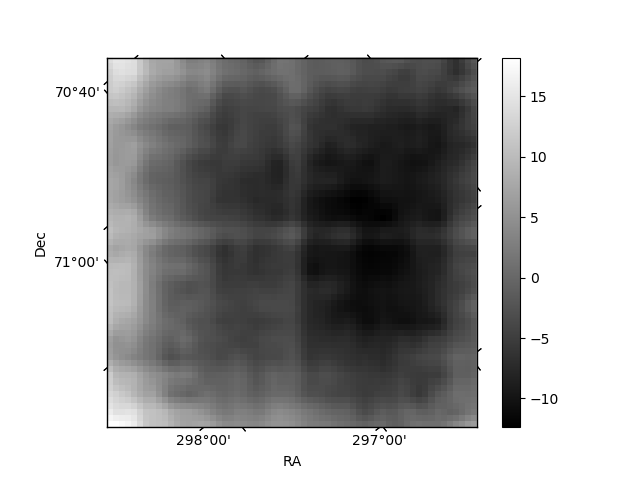
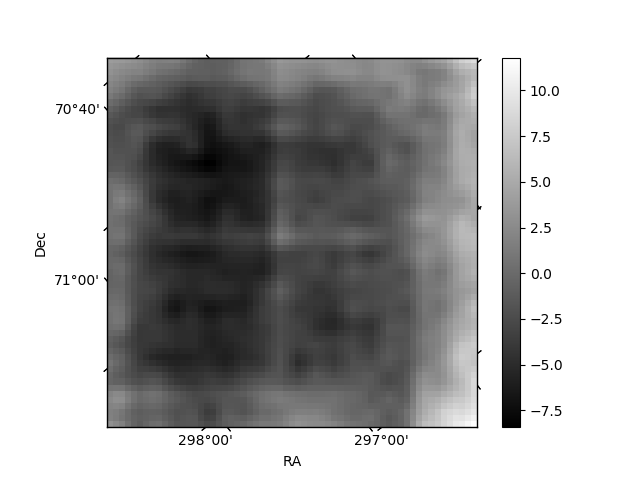
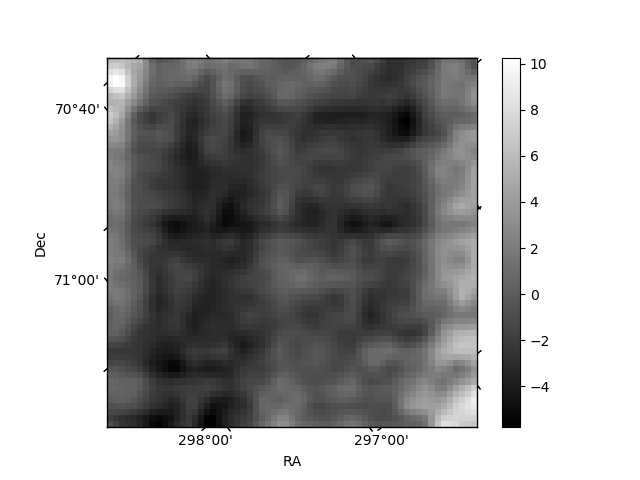
Histogram calculated using DETX and DETY for each event in the final _common_clean file
| Quadrant A | 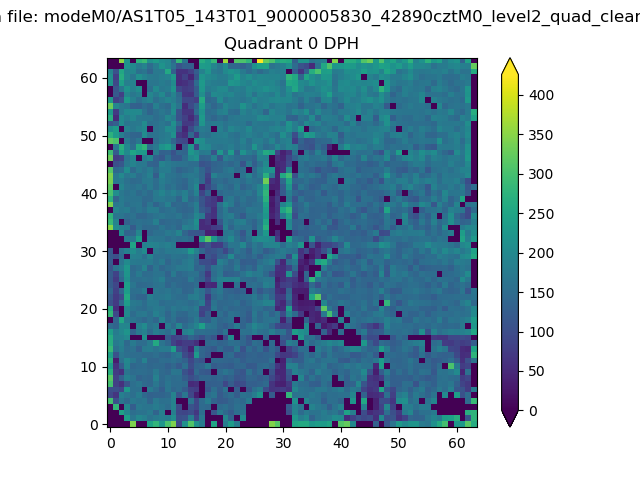 |
 |
Quadrant B |
|---|---|---|---|
| Quadrant D | 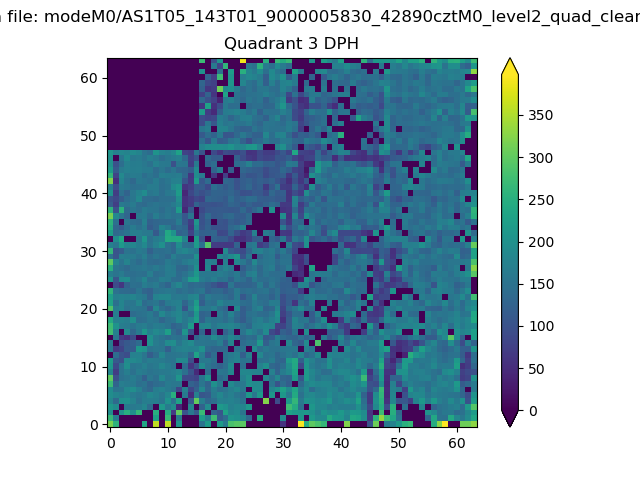 |
 |
Quadrant C |
| Plot type | Count rate plots | Images |
|---|---|---|
| Comparison with Poisson distribution Blue bars denote a histogram of data divided into 1 sec bins. Red curve is a Poisson curve with rate = median count rate of data. |
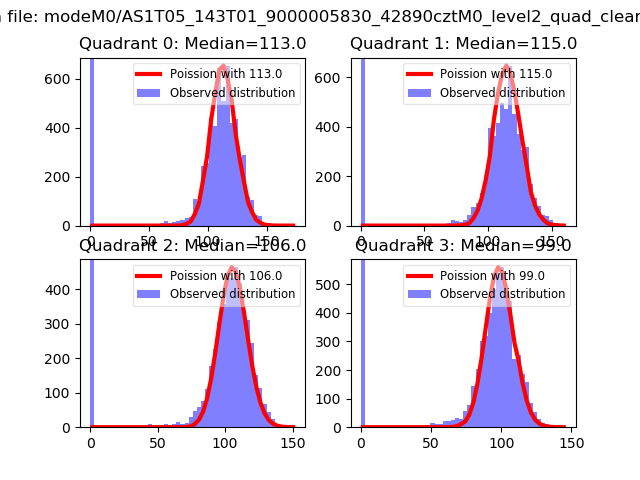 |
 |
| Quadrant-wise count rates Data is divided into 100 sec bins |
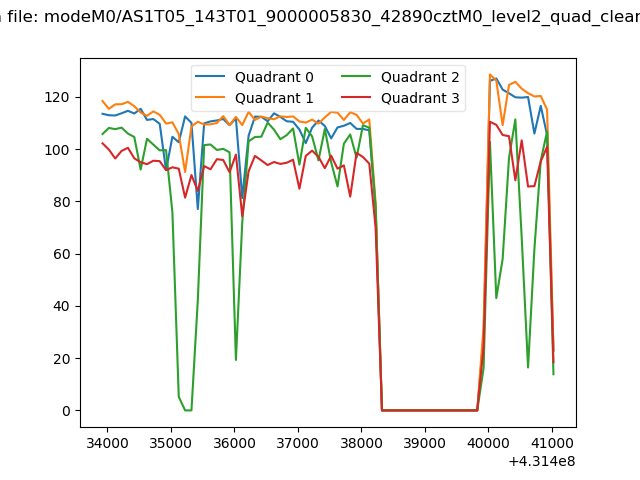 |
|
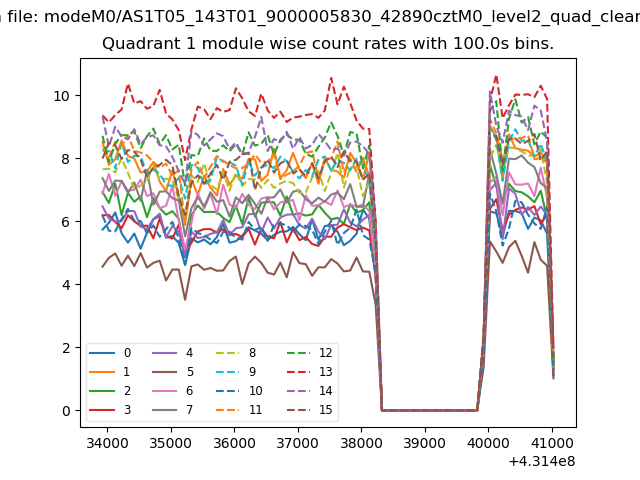
| Module-wise count rates for Quadrant A Data is divided into 100 sec bins |
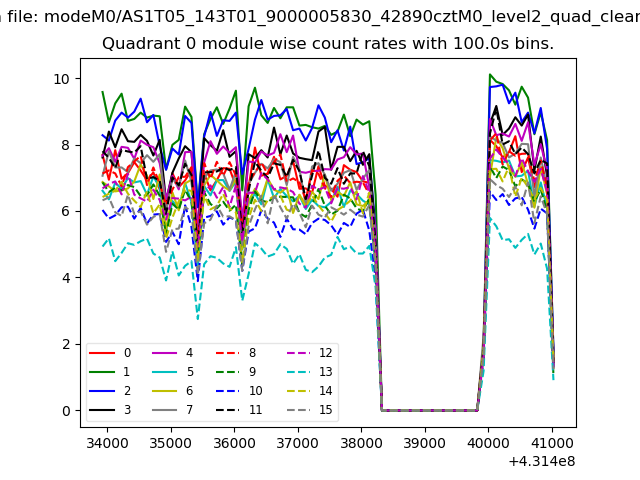 |
 |
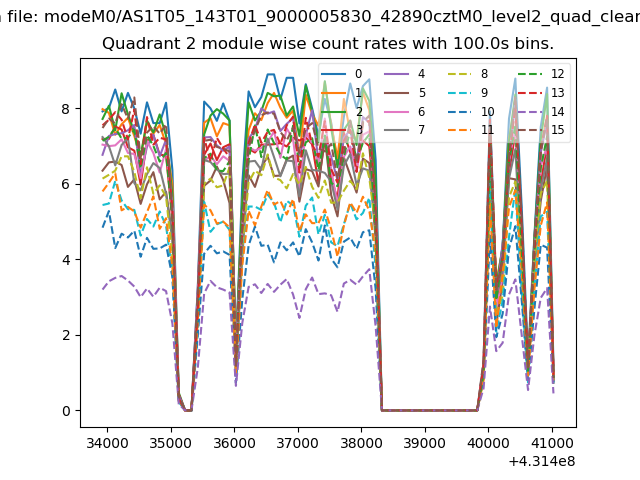
| Module-wise count rates for Quadrant B Data is divided into 100 sec bins |
 |
 |
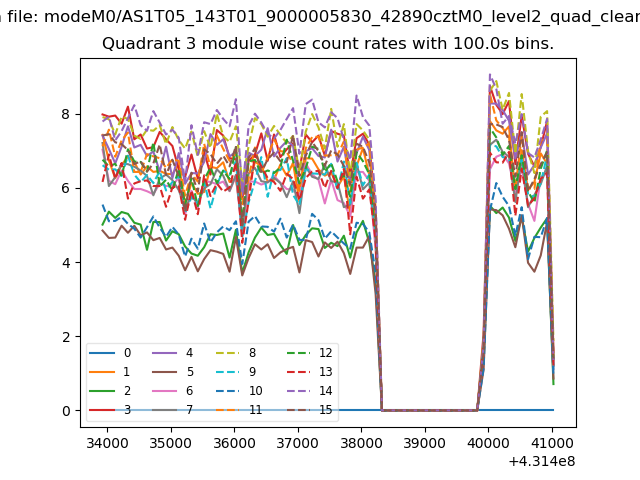
| Module-wise count rates for Quadrant C Data is divided into 100 sec bins |
 |
 |
| Module-wise count rates for Quadrant D Data is divided into 100 sec bins |
 |
 |
| Parameter | Plot |
|---|---|
| CZT HV Monitor | 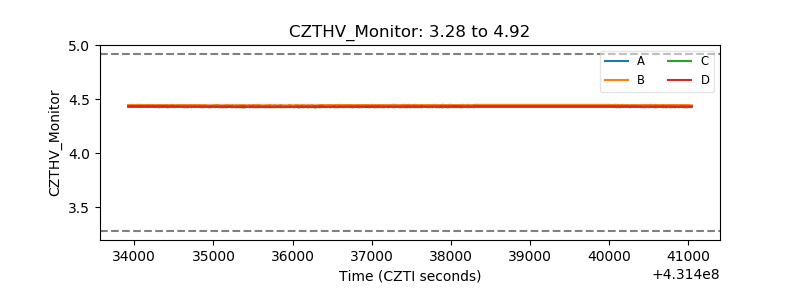 |
| D_VDD | 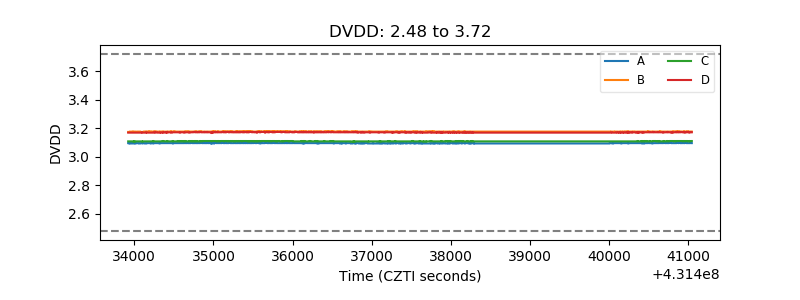 |
| Temperature 1 | 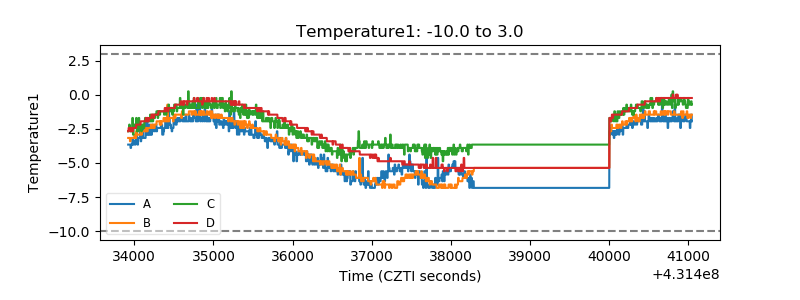 |
| Veto HV Monitor | 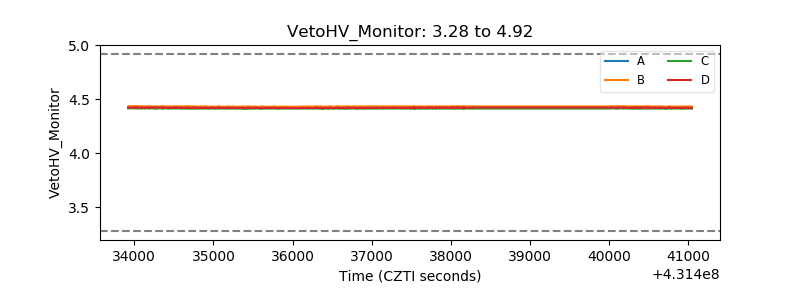 |
| Veto LLD | 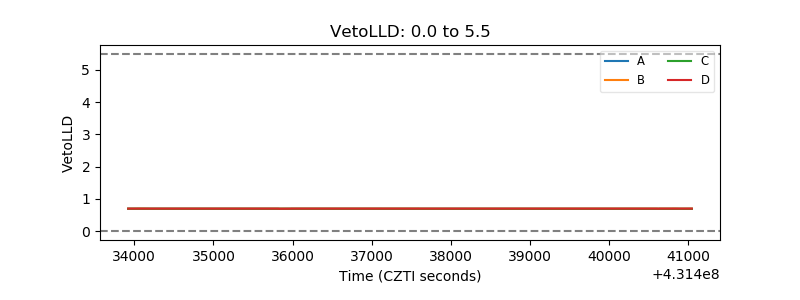 |
| Alpha Counter | 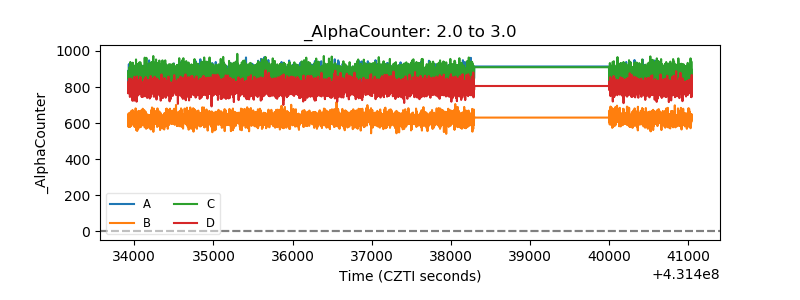 |
| _CPM_Rate | 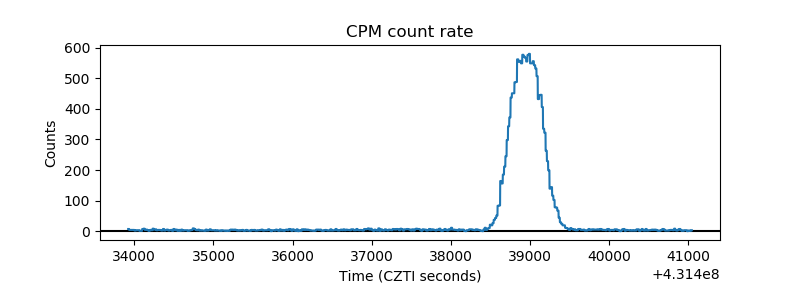 |
| CZT Counter | 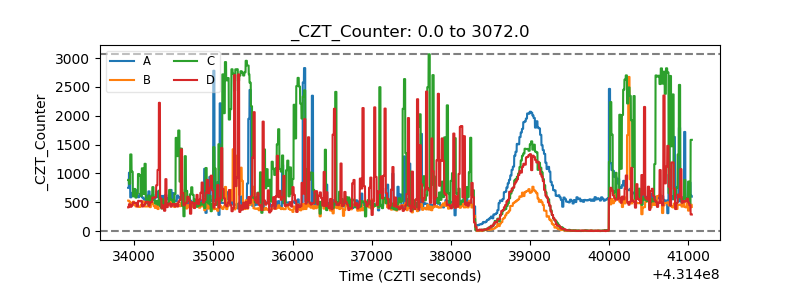 |
| +2.5 Volts monitor | 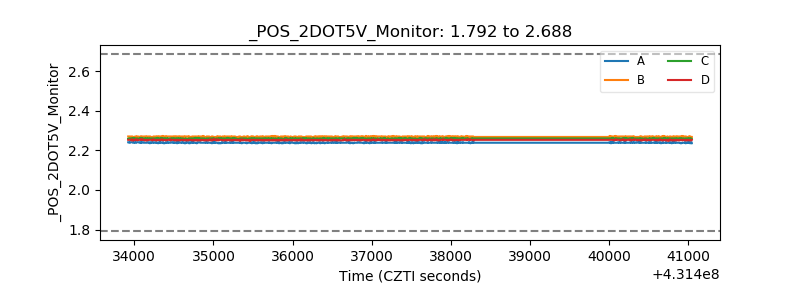 |
| +5 Volts monitor | 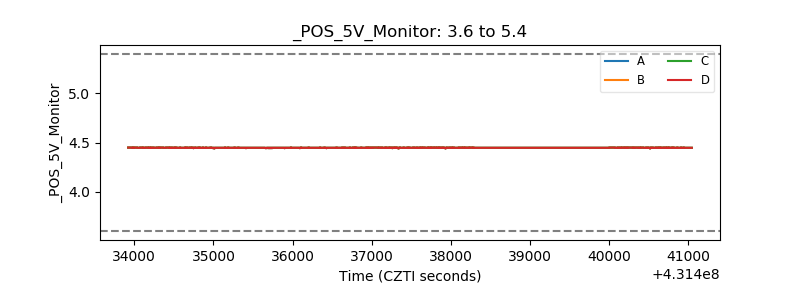 |
| _ROLL_ROT | 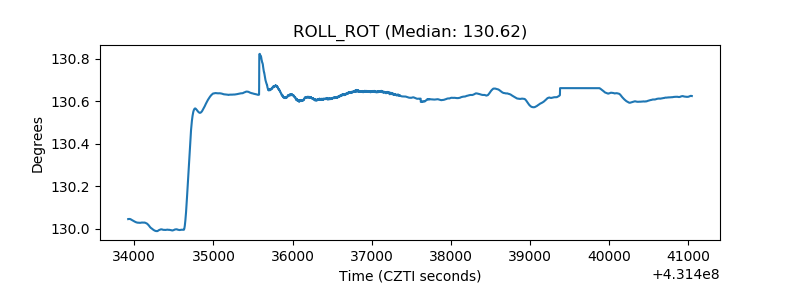 |
| _Roll_DEC | 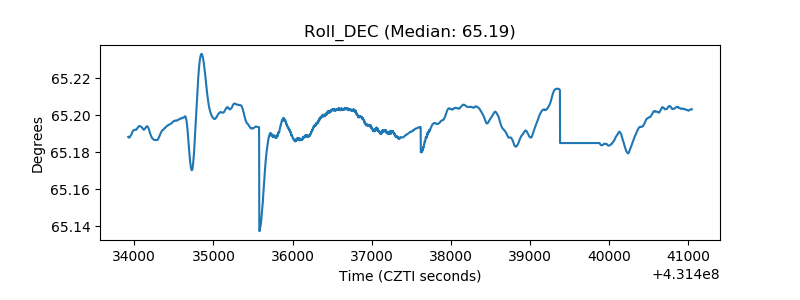 |
| _Roll_RA | 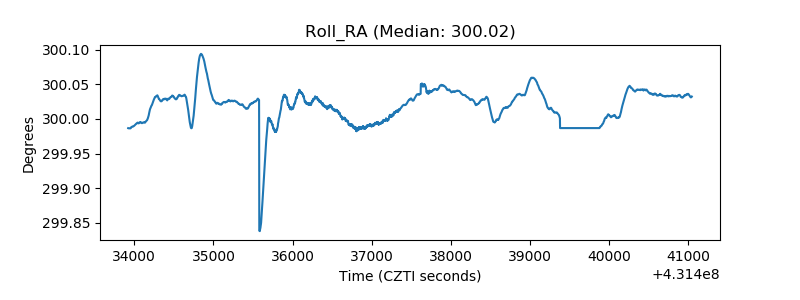 |
| Veto Counter | 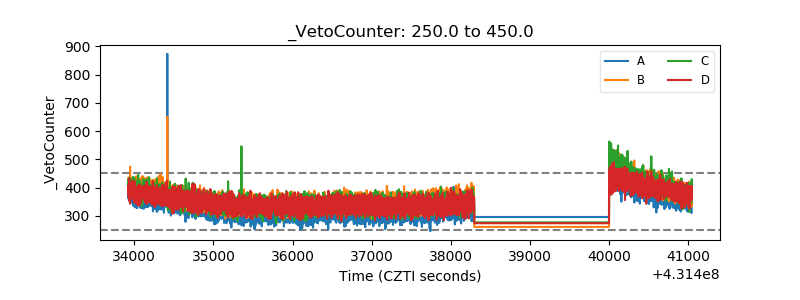 |