| Param | Original file | Final file |
|---|---|---|
| Filename | modeM0/AS1T05_143T01_9000005830_42892cztM0_level2.fits | modeM0/AS1T05_143T01_9000005830_42892cztM0_level2_quad_clean.evt |
| Size (bytes) | 417,977,280 | 87,986,880 |
| Size | 398.6 MB | 83.9 MB |
| Events in quadrant A | 3,434,451 | 611,051 |
| Events in quadrant B | 2,554,523 | 631,873 |
| Events in quadrant C | 4,563,261 | 531,214 |
| Events in quadrant D | 4,503,508 | 514,976 |
| Mode M0 | |||
|---|---|---|---|
| Quadrant | BADHDUFLAG | Total packets | Discarded packets |
| A | 0 | 13564 | 2 |
| B | 0 | 11274 | 2 |
| C | 0 | 17108 | 2 |
| D | 0 | 16989 | 2 |
| Mode M9 | |||
|---|---|---|---|
| Quadrant | BADHDUFLAG | Total packets | Discarded packets |
| A | 0 | 18 | 0 |
| B | 0 | 19 | 0 |
| C | 0 | 19 | 0 |
| D | 0 | 19 | 0 |
| Mode SS | |||
|---|---|---|---|
| Quadrant | BADHDUFLAG | Total packets | Discarded packets |
| A | 0 | 110 | 0 |
| B | 0 | 110 | 0 |
| C | 0 | 110 | 0 |
| D | 0 | 110 | 0 |
| Quadrant | Total seconds | Saturated seconds | Saturation percentage |
|---|---|---|---|
| A | 5353 | 172 | 3.213152% |
| B | 5353 | 33 | 0.616477% |
| C | 5353 | 645 | 12.049318% |
| D | 5353 | 507 | 9.471324% |
Noise dominated data is calculated using 1-second bins in cleaned event files. If a bin has >2000 counts, and if more than 50% of those come from <1% of pixels, then it is considered to be noise-dominated and hence unusable.
| Quadrant | # 1 sec bins | Bins with >0 counts | Bins with >2000 counts | High rate bins dominated by noise | Noise dominated (total time) | Noise dominated (detector-on time) | Marked lightcurve |
|---|---|---|---|---|---|---|---|
| A | 7176 | 5354 | 121 | 121 | 1.69% | 2.26% | 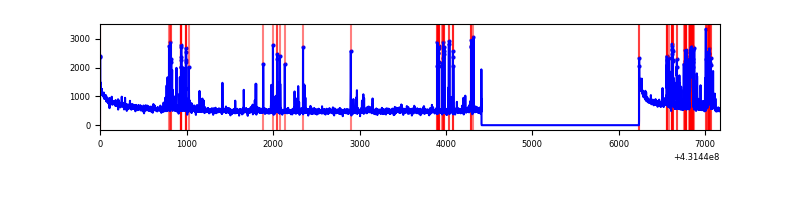 |
| B | 7176 | 5354 | 21 | 21 | 0.29% | 0.39% | 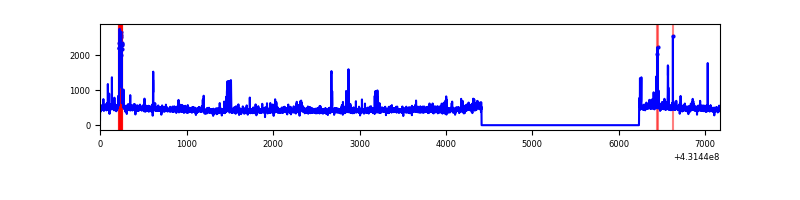 |
| C | 7176 | 5354 | 595 | 595 | 8.29% | 11.11% | 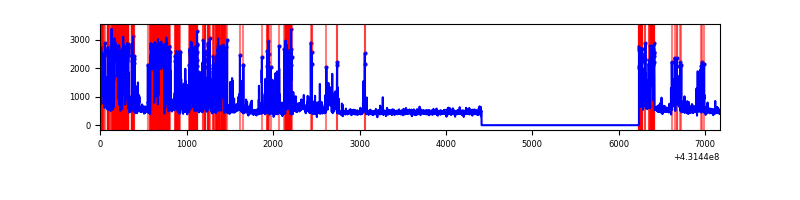 |
| D | 7176 | 5353 | 456 | 456 | 6.35% | 8.52% | 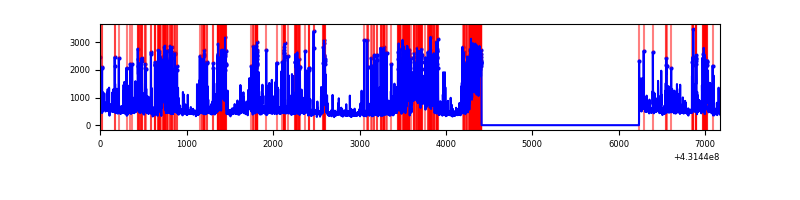 |
Top three noisy pixels from each quadrant. If the there are fewer than three noisy pixels in the level2.evt file, extra rows are filled as -1
| Pixel properties | Quadrant properties | ||||||
|---|---|---|---|---|---|---|---|
| Quadrant | DetID | PixID | Counts | Sigma | Mean | Median | Sigma |
| A | 10 | 83 | 600166 | 4929.81 | 587 | 575 | 121.6 |
| A | 15 | 237 | 406624 | 3338.52 | 587 | 575 | 121.6 |
| A | 2 | 79 | 91361 | 746.44 | 587 | 575 | 121.6 |
| B | 0 | 229 | 76304 | 668.38 | 588 | 573 | 113.3 |
| B | 5 | 172 | 61562 | 538.27 | 588 | 573 | 113.3 |
| B | 4 | 171 | 30961 | 268.2 | 588 | 573 | 113.3 |
| C | 12 | 2 | 2050690 | 16322.37 | 540 | 543 | 125.6 |
| C | 15 | 214 | 218170 | 1732.65 | 540 | 543 | 125.6 |
| C | 5 | 250 | 79946 | 632.17 | 540 | 543 | 125.6 |
| D | 1 | 52 | 1449816 | 10759.83 | 556 | 539 | 134.7 |
| D | 12 | 6 | 471160 | 3494.02 | 556 | 539 | 134.7 |
| D | 12 | 233 | 168783 | 1249.09 | 556 | 539 | 134.7 |
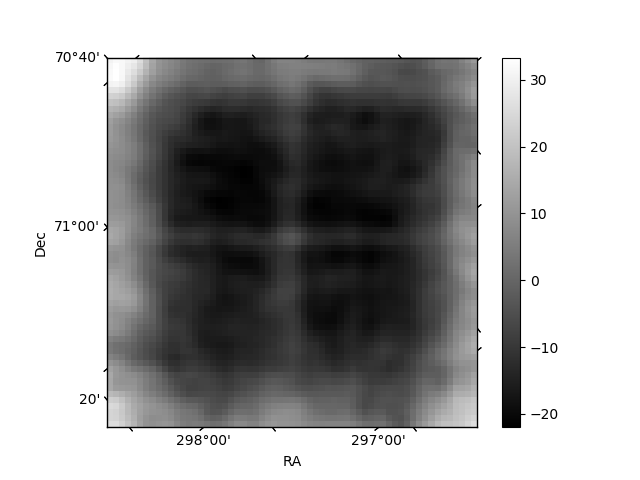
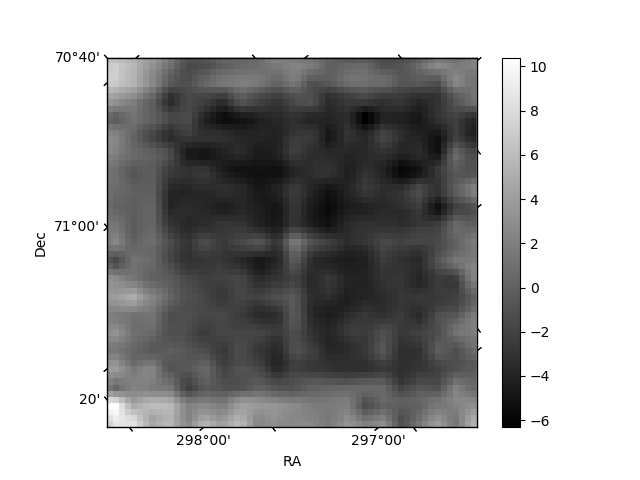
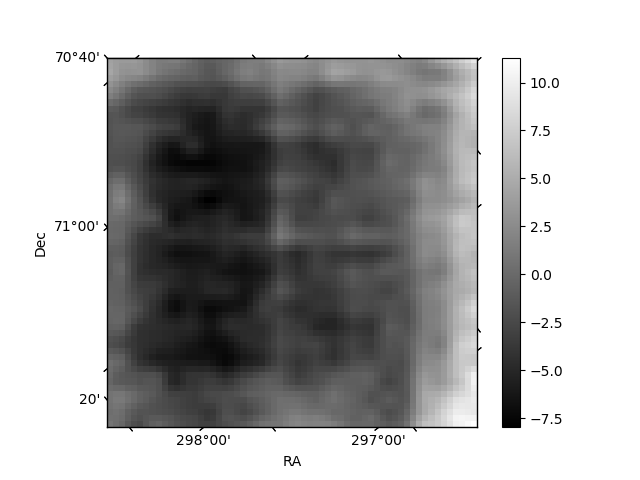
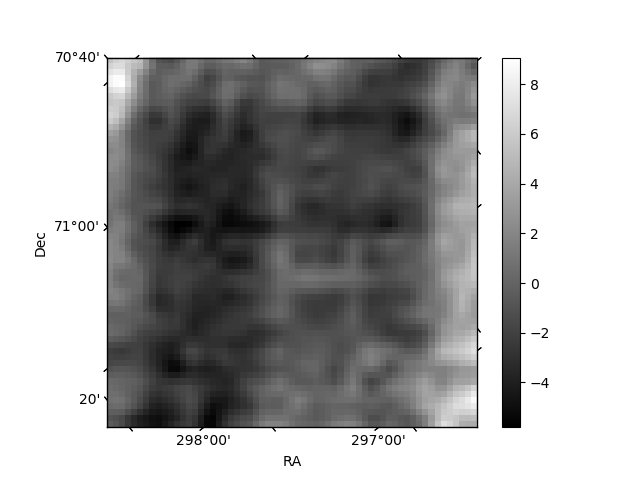
Histogram calculated using DETX and DETY for each event in the final _common_clean file
| Quadrant A | 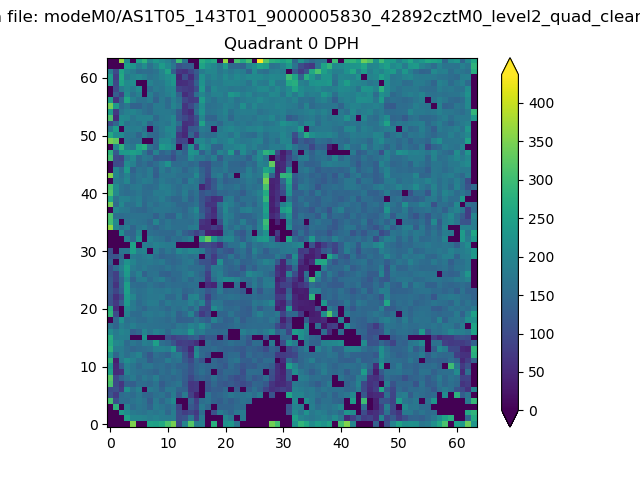 |
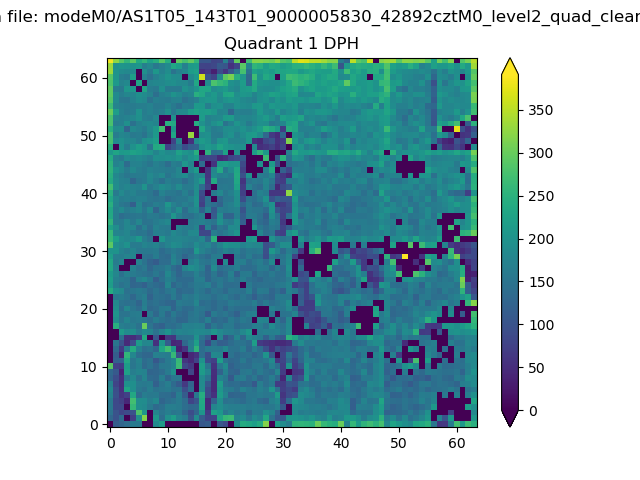 |
Quadrant B |
|---|---|---|---|
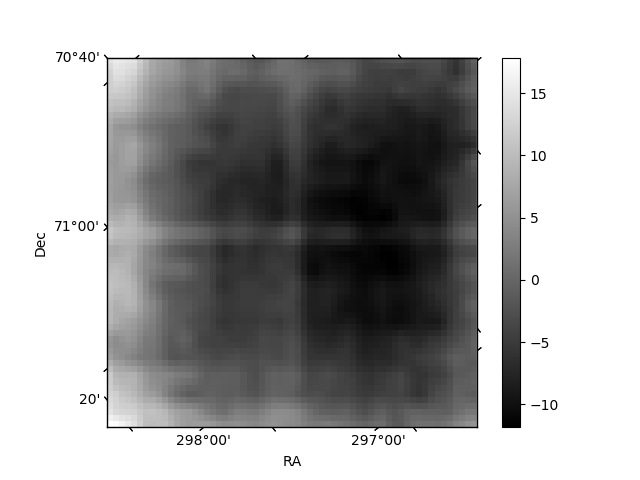
| Quadrant D | 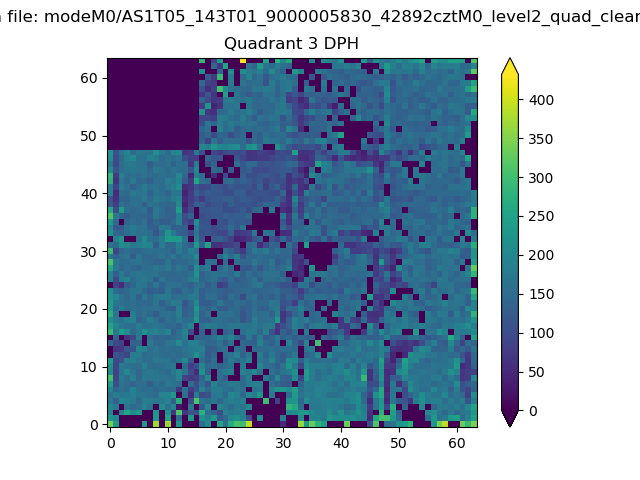 |
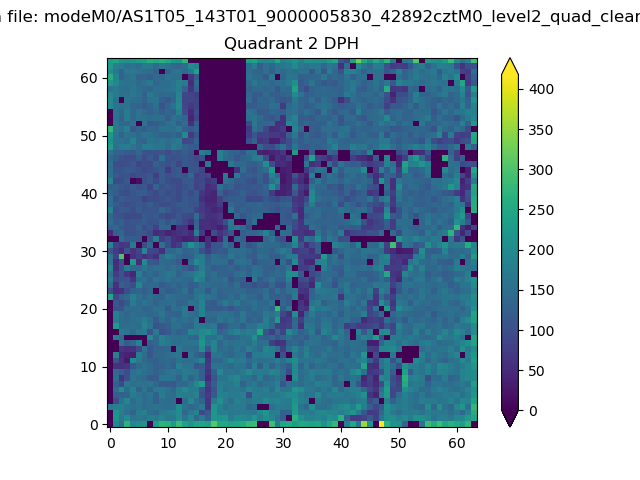 |
Quadrant C |
| Plot type | Count rate plots | Images |
|---|---|---|
| Comparison with Poisson distribution Blue bars denote a histogram of data divided into 1 sec bins. Red curve is a Poisson curve with rate = median count rate of data. |
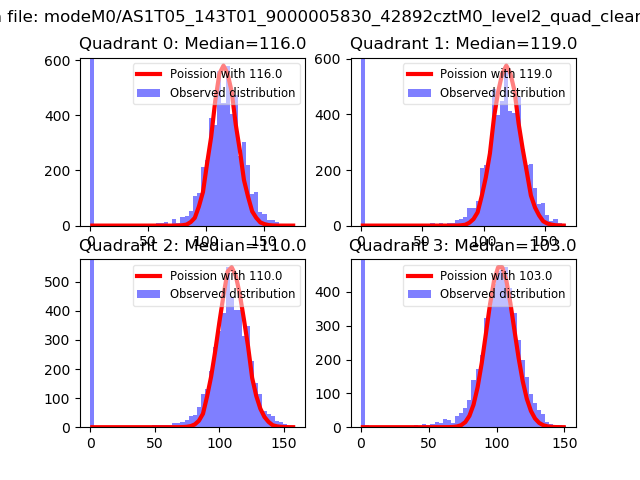 |
 |
| Quadrant-wise count rates Data is divided into 100 sec bins |
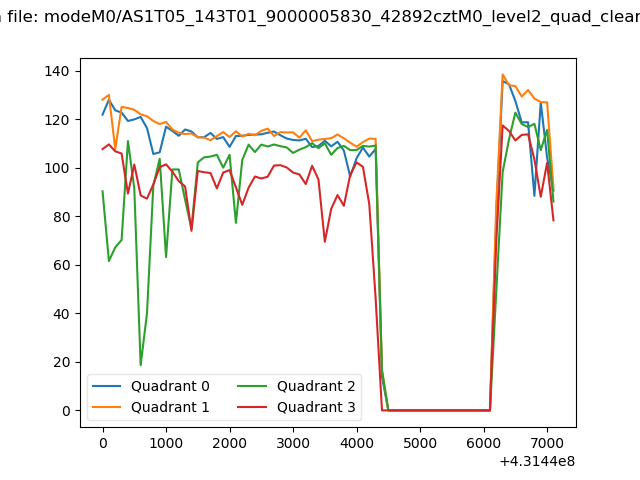 |
|
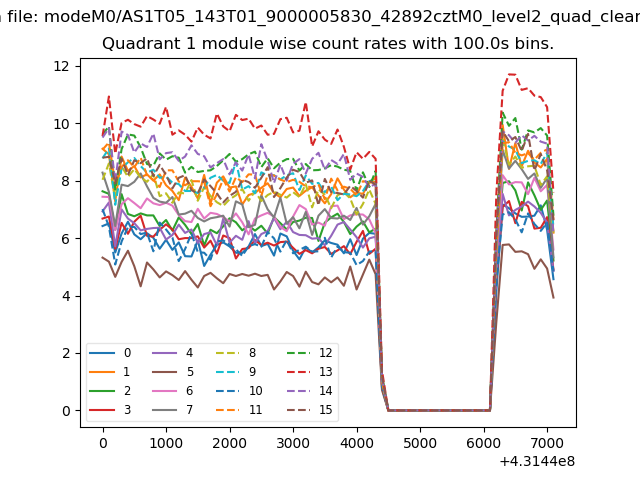
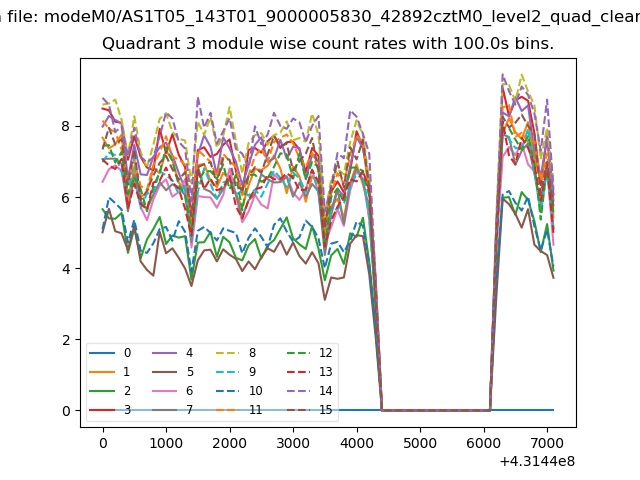
| Module-wise count rates for Quadrant A Data is divided into 100 sec bins |
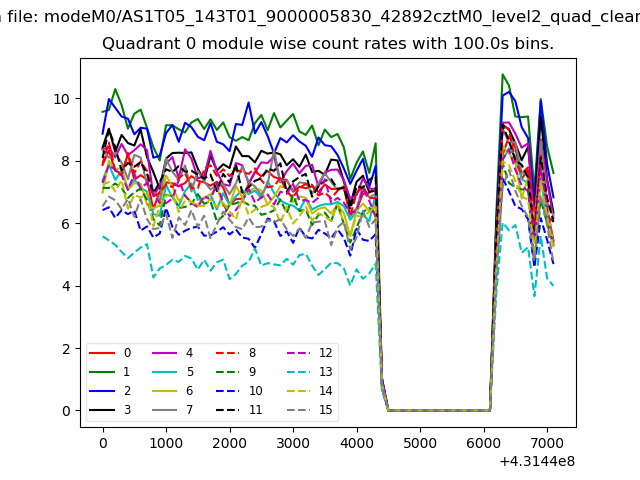 |
 |
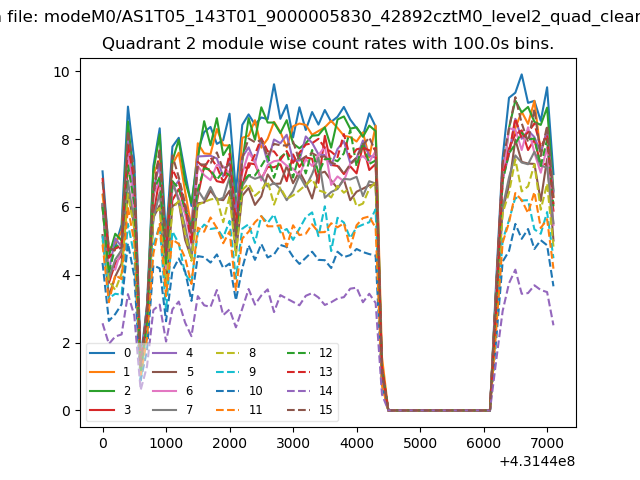
| Module-wise count rates for Quadrant B Data is divided into 100 sec bins |
 |
 |
| Module-wise count rates for Quadrant C Data is divided into 100 sec bins |
 |
 |
| Module-wise count rates for Quadrant D Data is divided into 100 sec bins |
 |
 |
| Parameter | Plot |
|---|---|
| CZT HV Monitor | 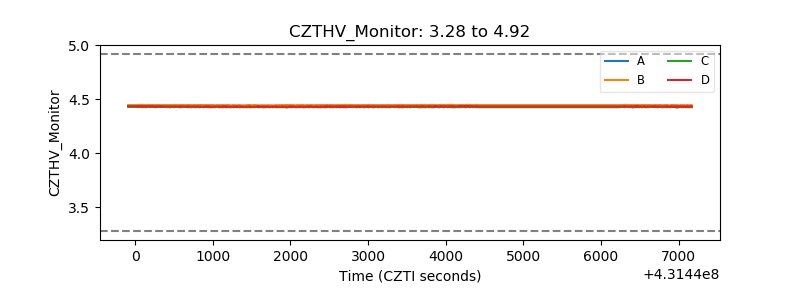 |
| D_VDD | 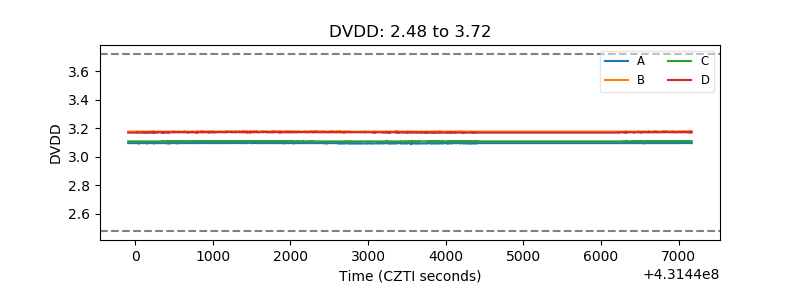 |
| Temperature 1 | 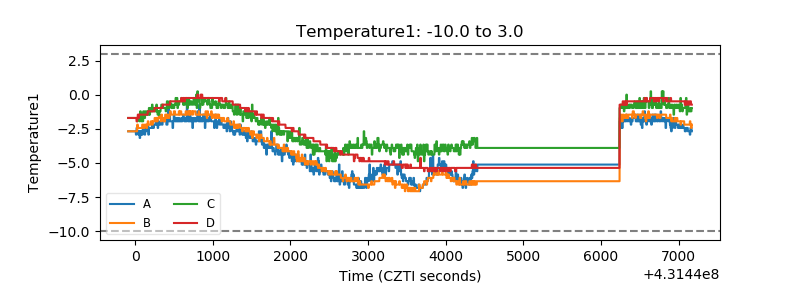 |
| Veto HV Monitor | 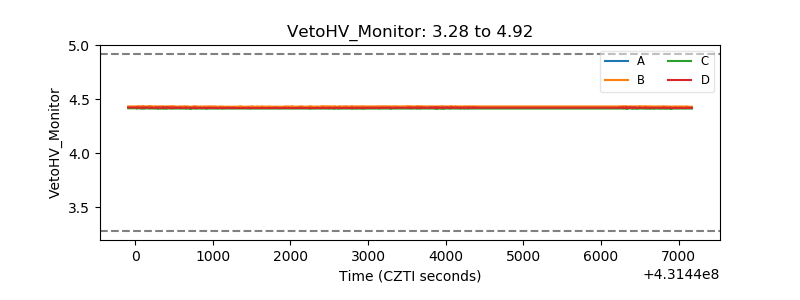 |
| Veto LLD | 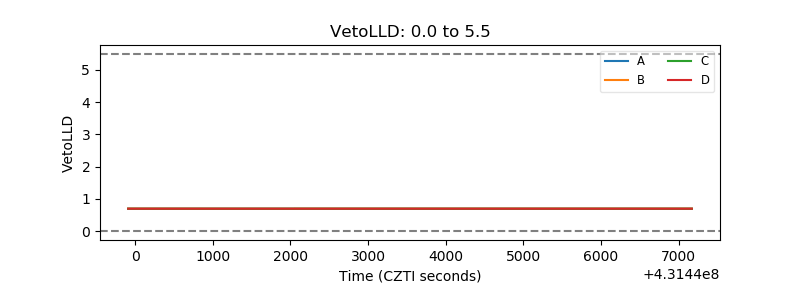 |
| Alpha Counter | 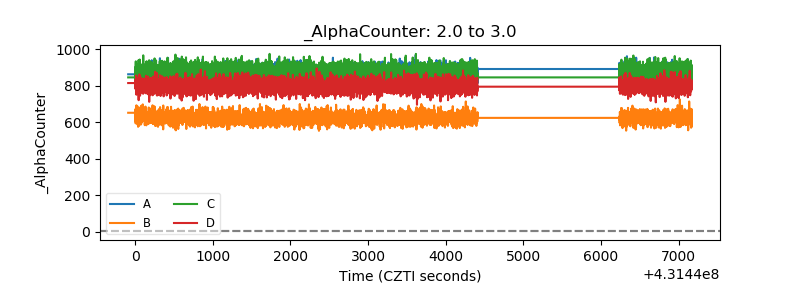 |
| _CPM_Rate | 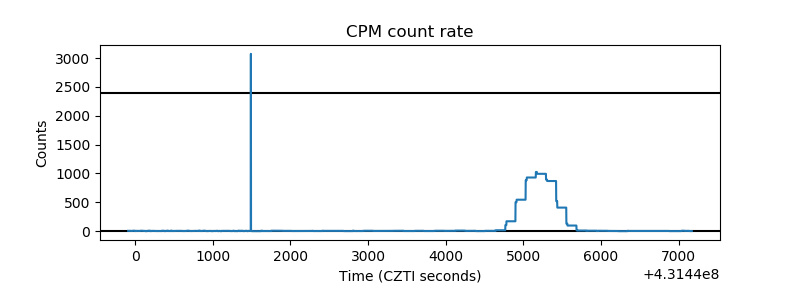 |
| CZT Counter | 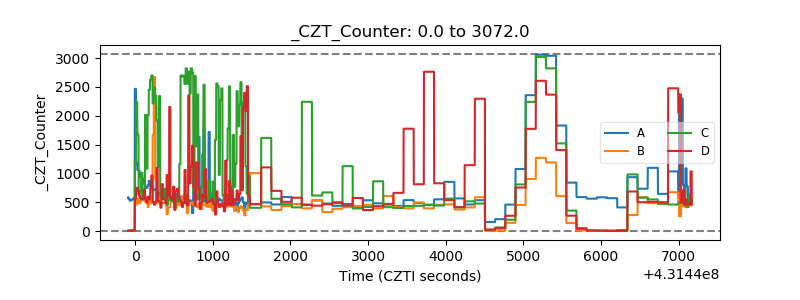 |
| +2.5 Volts monitor | 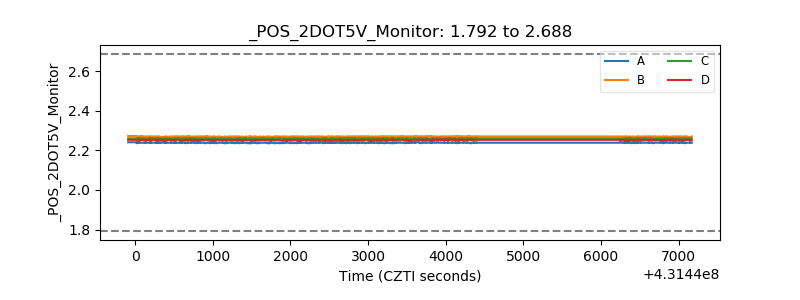 |
| +5 Volts monitor | 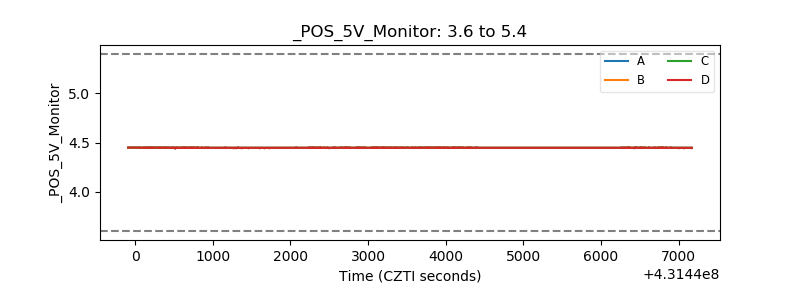 |
| _ROLL_ROT | 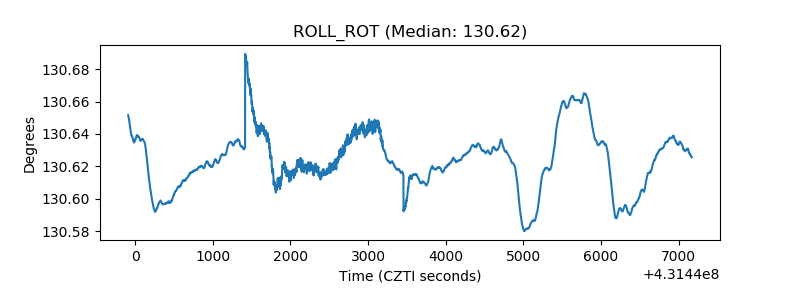 |
| _Roll_DEC | 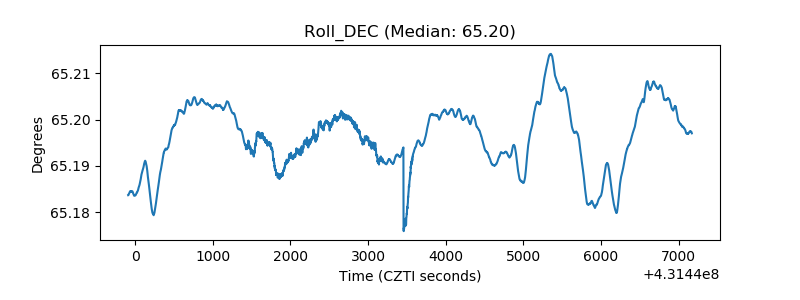 |
| _Roll_RA | 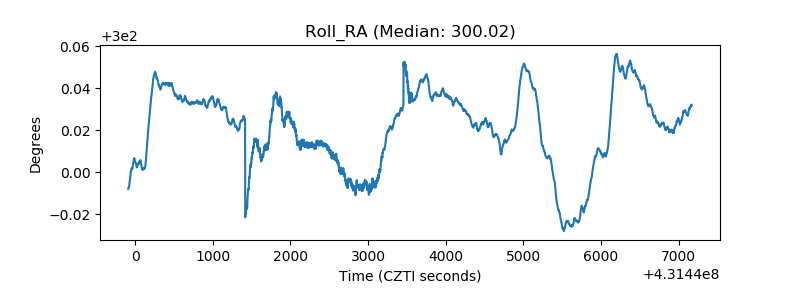 |
| Veto Counter | 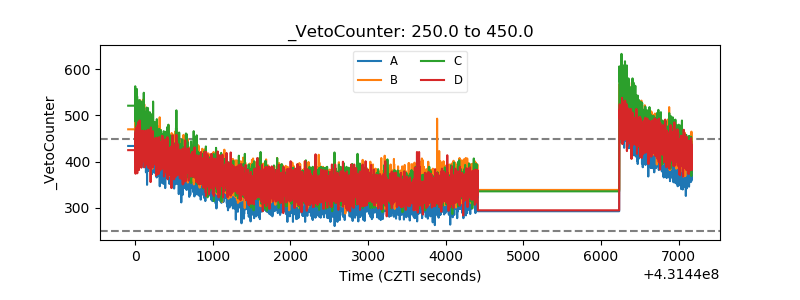 |