| Param | Original file | Final file |
|---|---|---|
| Filename | modeM0/AS1T05_143T01_9000005830_42893cztM0_level2.fits | modeM0/AS1T05_143T01_9000005830_42893cztM0_level2_quad_clean.evt |
| Size (bytes) | 388,307,520 | 89,464,320 |
| Size | 370.3 MB | 85.3 MB |
| Events in quadrant A | 3,664,340 | 604,397 |
| Events in quadrant B | 2,551,254 | 637,076 |
| Events in quadrant C | 3,743,322 | 565,293 |
| Events in quadrant D | 4,007,607 | 535,244 |
| Mode M0 | |||
|---|---|---|---|
| Quadrant | BADHDUFLAG | Total packets | Discarded packets |
| A | 0 | 14205 | 2 |
| B | 0 | 11210 | 2 |
| C | 0 | 14447 | 2 |
| D | 0 | 15520 | 2 |
| Mode M9 | |||
|---|---|---|---|
| Quadrant | BADHDUFLAG | Total packets | Discarded packets |
| A | 0 | 23 | 0 |
| B | 0 | 24 | 0 |
| C | 0 | 24 | 0 |
| D | 0 | 24 | 0 |
| Mode SS | |||
|---|---|---|---|
| Quadrant | BADHDUFLAG | Total packets | Discarded packets |
| A | 0 | 108 | 0 |
| B | 0 | 108 | 0 |
| C | 0 | 108 | 0 |
| D | 0 | 108 | 0 |
| Quadrant | Total seconds | Saturated seconds | Saturation percentage |
|---|---|---|---|
| A | 5232 | 257 | 4.912080% |
| B | 5232 | 24 | 0.458716% |
| C | 5232 | 391 | 7.473242% |
| D | 5232 | 325 | 6.211774% |
Noise dominated data is calculated using 1-second bins in cleaned event files. If a bin has >2000 counts, and if more than 50% of those come from <1% of pixels, then it is considered to be noise-dominated and hence unusable.
| Quadrant | # 1 sec bins | Bins with >0 counts | Bins with >2000 counts | High rate bins dominated by noise | Noise dominated (total time) | Noise dominated (detector-on time) | Marked lightcurve |
|---|---|---|---|---|---|---|---|
| A | 7175 | 5233 | 209 | 209 | 2.91% | 3.99% | 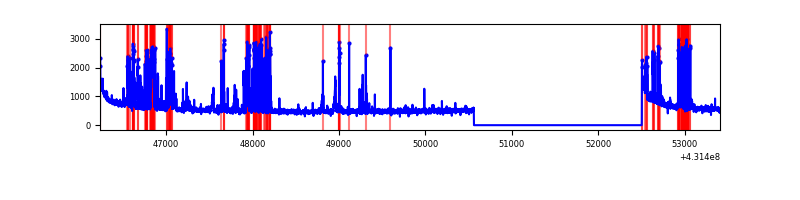 |
| B | 7175 | 5233 | 17 | 17 | 0.24% | 0.32% | 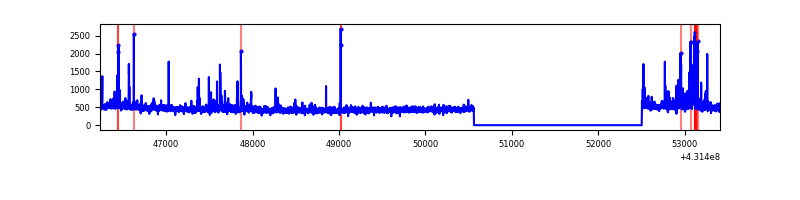 |
| C | 7174 | 5232 | 339 | 339 | 4.73% | 6.48% | 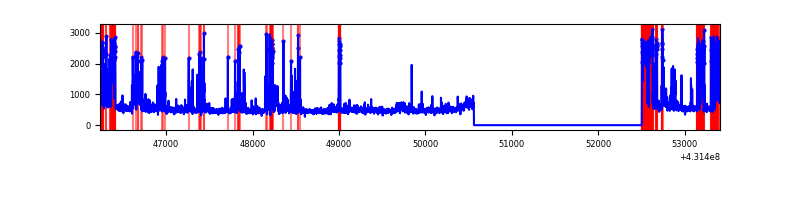 |
| D | 7175 | 5233 | 300 | 300 | 4.18% | 5.73% | 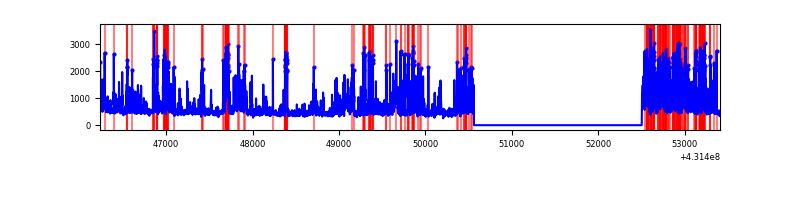 |
Top three noisy pixels from each quadrant. If the there are fewer than three noisy pixels in the level2.evt file, extra rows are filled as -1
| Pixel properties | Quadrant properties | ||||||
|---|---|---|---|---|---|---|---|
| Quadrant | DetID | PixID | Counts | Sigma | Mean | Median | Sigma |
| A | 15 | 237 | 630562 | 5375.77 | 574 | 563 | 117.2 |
| A | 10 | 83 | 593715 | 5061.35 | 574 | 563 | 117.2 |
| A | 13 | 248 | 163828 | 1393.14 | 574 | 563 | 117.2 |
| B | 0 | 229 | 127096 | 1145.69 | 581 | 566 | 110.4 |
| B | 3 | 112 | 34320 | 305.63 | 581 | 566 | 110.4 |
| B | 0 | 245 | 25958 | 229.92 | 581 | 566 | 110.4 |
| C | 12 | 2 | 1286510 | 9993.99 | 554 | 557 | 128.7 |
| C | 15 | 214 | 218094 | 1690.62 | 554 | 557 | 128.7 |
| C | 14 | 254 | 25274 | 192.09 | 554 | 557 | 128.7 |
| D | 1 | 52 | 851357 | 6281.95 | 560 | 544 | 135.4 |
| D | 12 | 6 | 258641 | 1905.65 | 560 | 544 | 135.4 |
| D | 12 | 233 | 254655 | 1876.22 | 560 | 544 | 135.4 |
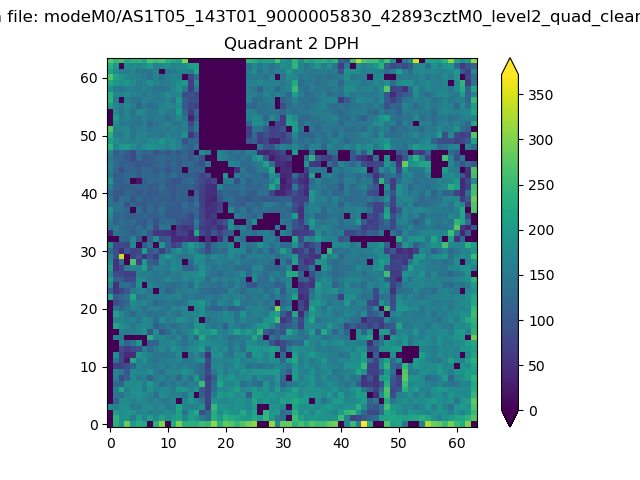
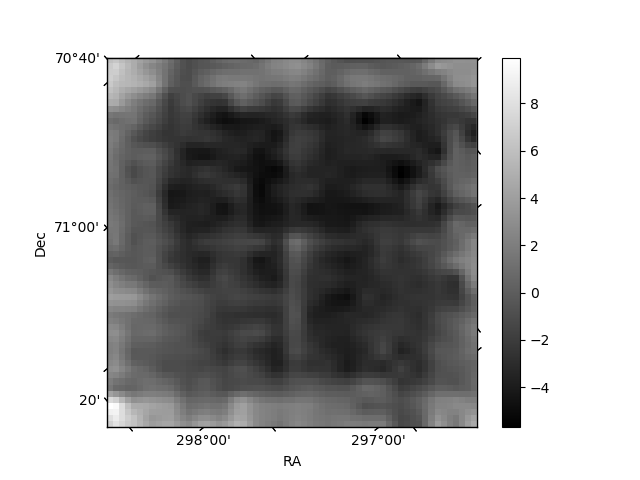
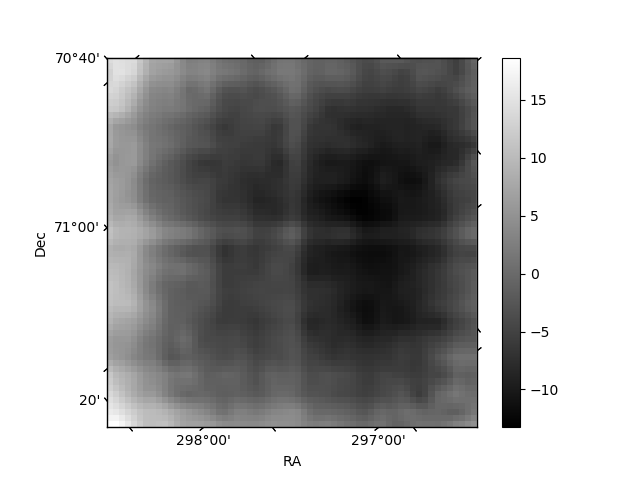
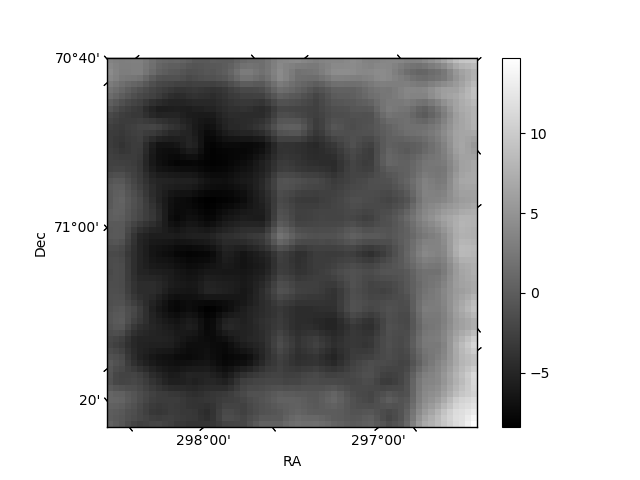
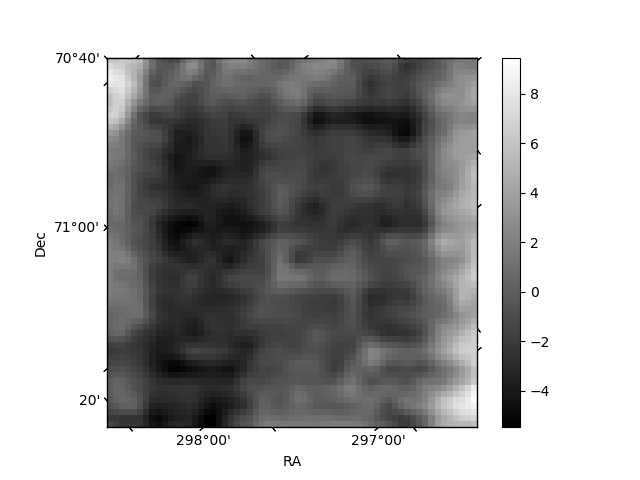
Histogram calculated using DETX and DETY for each event in the final _common_clean file
| Quadrant A | 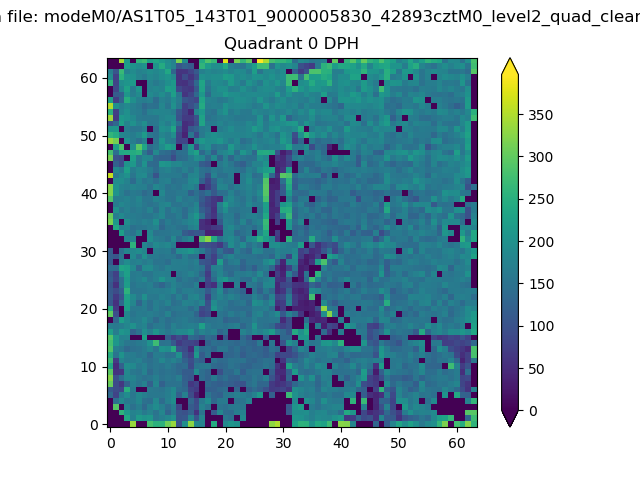 |
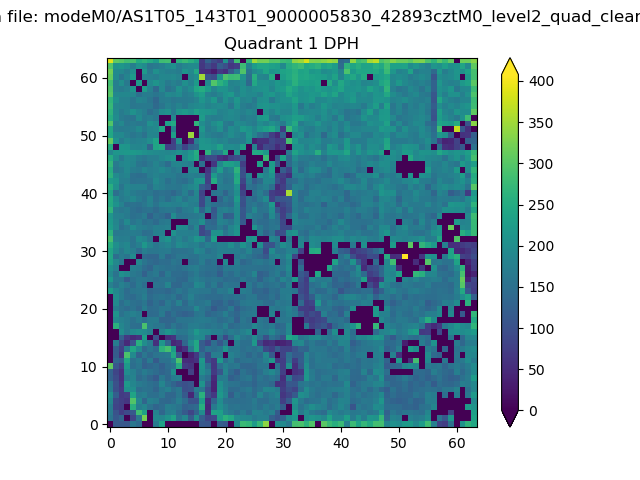 |
Quadrant B |
|---|---|---|---|
| Quadrant D | 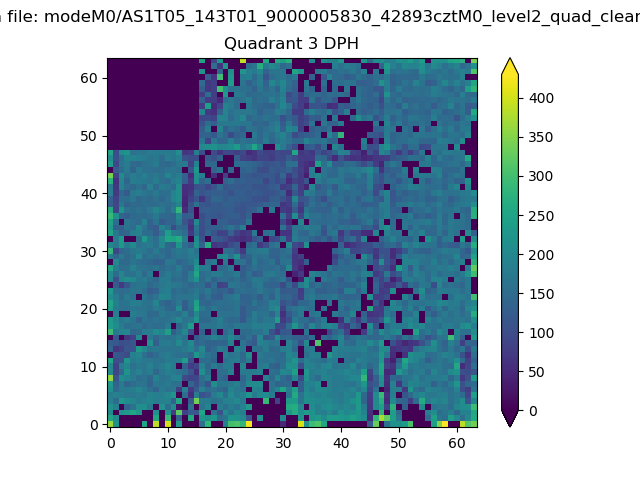 |
 |
Quadrant C |
| Plot type | Count rate plots | Images |
|---|---|---|
| Comparison with Poisson distribution Blue bars denote a histogram of data divided into 1 sec bins. Red curve is a Poisson curve with rate = median count rate of data. |
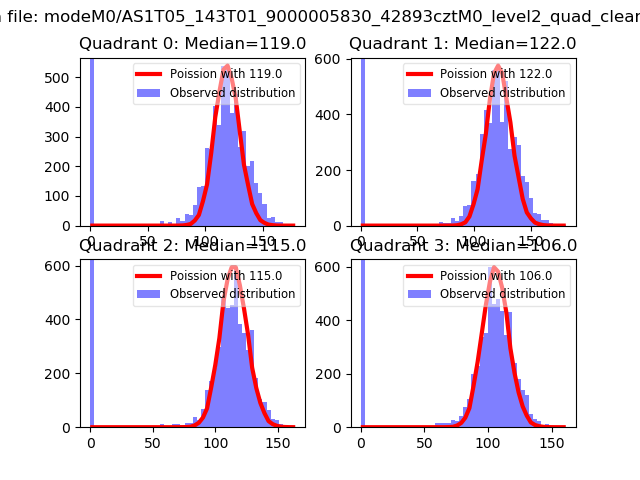 |
 |
| Quadrant-wise count rates Data is divided into 100 sec bins |
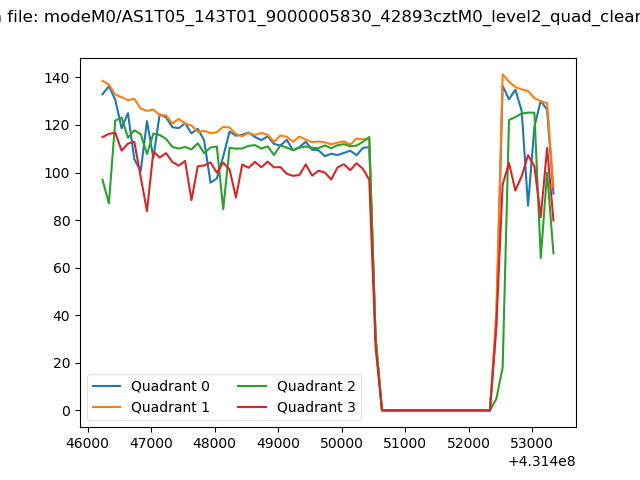 |
|
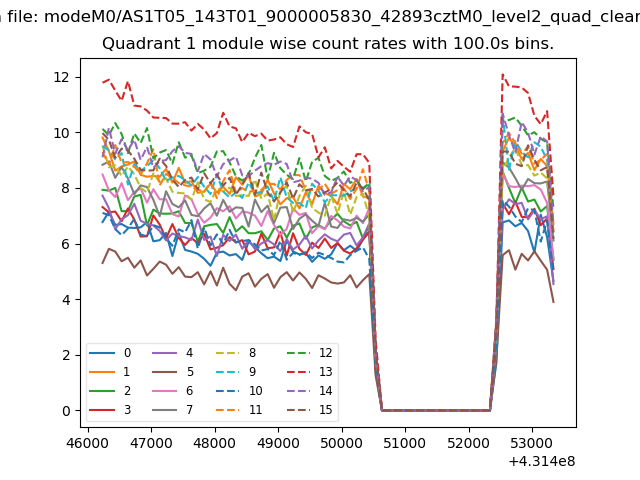
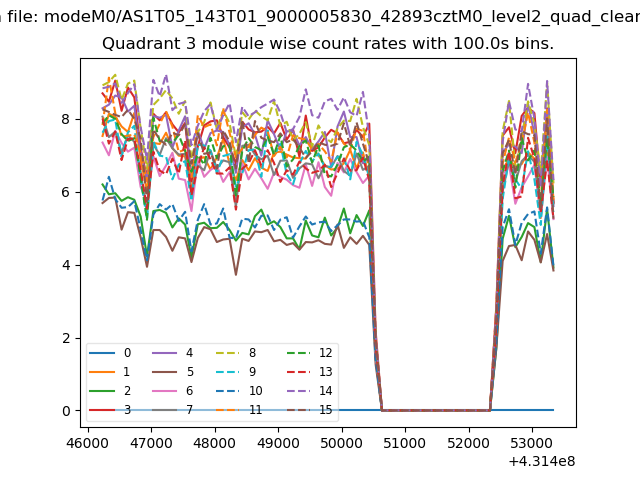
| Module-wise count rates for Quadrant A Data is divided into 100 sec bins |
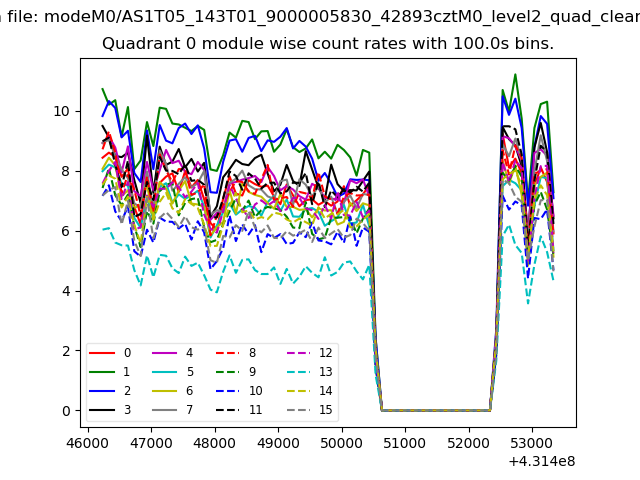 |
 |
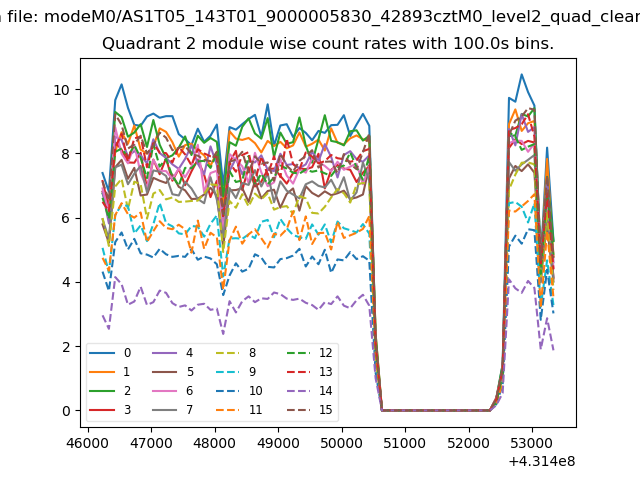
| Module-wise count rates for Quadrant B Data is divided into 100 sec bins |
 |
 |
| Module-wise count rates for Quadrant C Data is divided into 100 sec bins |
 |
 |
| Module-wise count rates for Quadrant D Data is divided into 100 sec bins |
 |
 |
| Parameter | Plot |
|---|---|
| CZT HV Monitor | 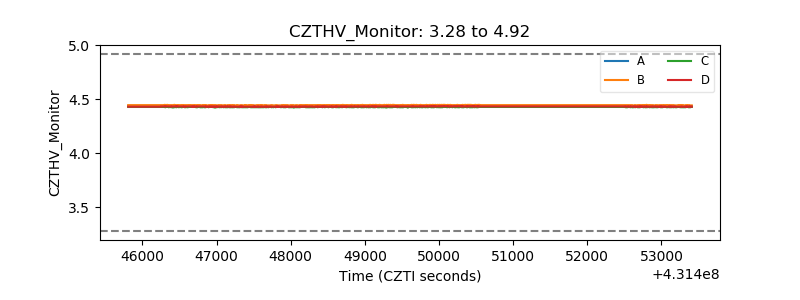 |
| D_VDD | 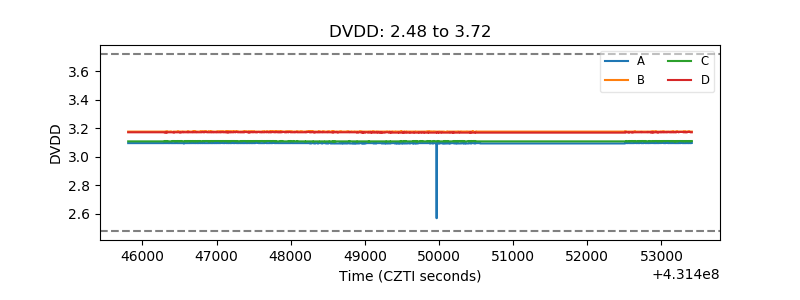 |
| Temperature 1 | 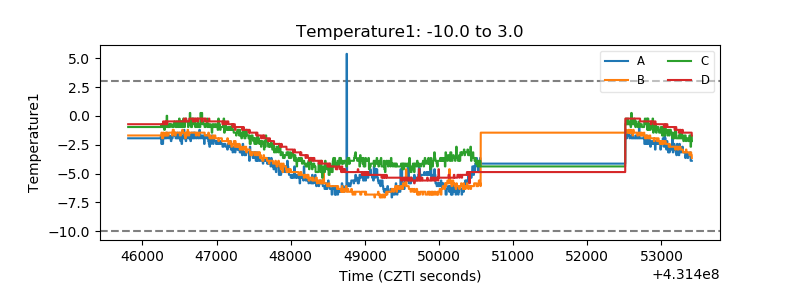 |
| Veto HV Monitor | 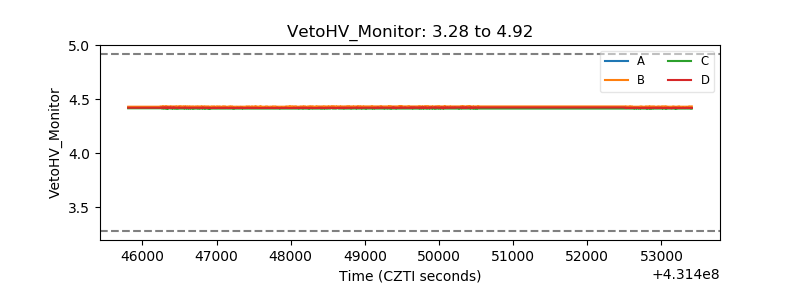 |
| Veto LLD | 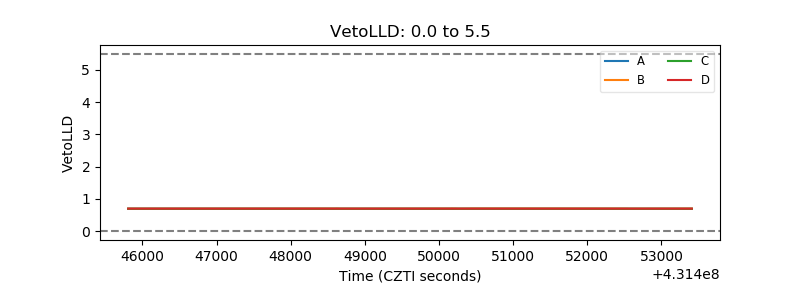 |
| Alpha Counter | 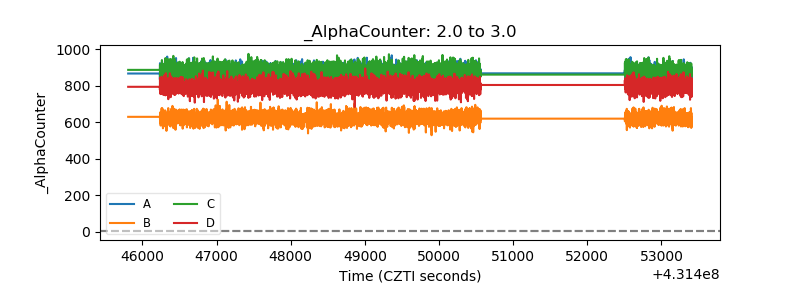 |
| _CPM_Rate |  |
| CZT Counter | 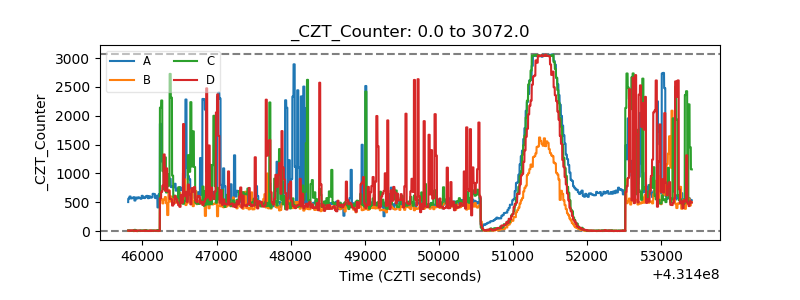 |
| +2.5 Volts monitor | 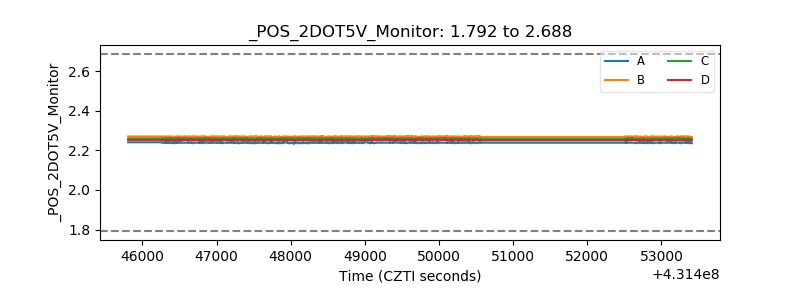 |
| +5 Volts monitor | 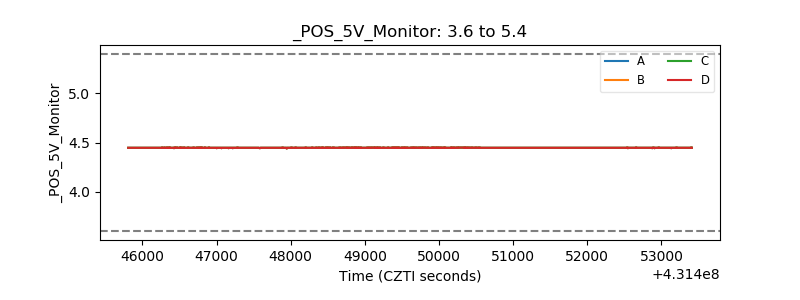 |
| _ROLL_ROT | 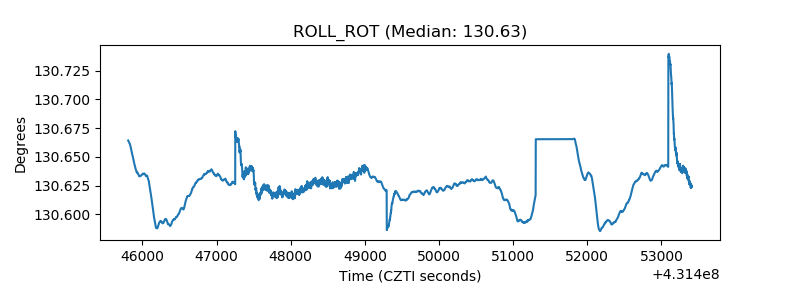 |
| _Roll_DEC | 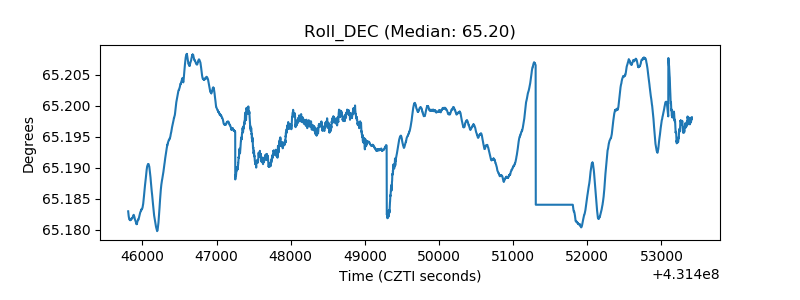 |
| _Roll_RA | 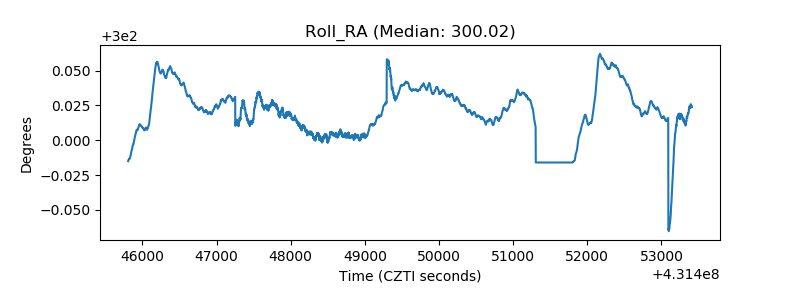 |
| Veto Counter | 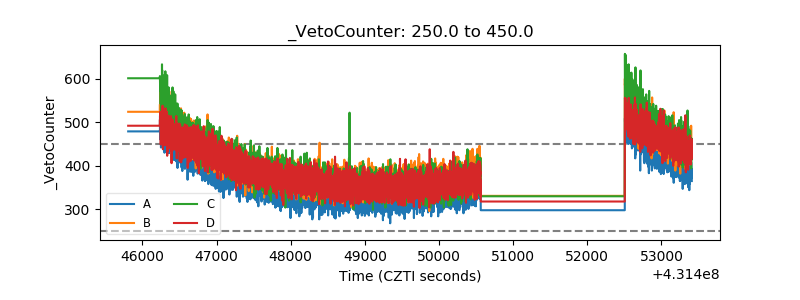 |