| Param | Original file | Final file |
|---|---|---|
| Filename | modeM0/AS1T05_143T01_9000005830_42894cztM0_level2.fits | modeM0/AS1T05_143T01_9000005830_42894cztM0_level2_quad_clean.evt |
| Size (bytes) | 425,871,360 | 84,360,960 |
| Size | 406.1 MB | 80.5 MB |
| Events in quadrant A | 3,443,454 | 582,549 |
| Events in quadrant B | 2,496,323 | 617,251 |
| Events in quadrant C | 5,519,474 | 492,986 |
| Events in quadrant D | 3,915,701 | 510,200 |
| Mode M0 | |||
|---|---|---|---|
| Quadrant | BADHDUFLAG | Total packets | Discarded packets |
| A | 0 | 13386 | 2 |
| B | 0 | 10838 | 3 |
| C | 0 | 19734 | 2 |
| D | 0 | 15100 | 2 |
| Mode M9 | |||
|---|---|---|---|
| Quadrant | BADHDUFLAG | Total packets | Discarded packets |
| A | 0 | 26 | 0 |
| B | 0 | 27 | 0 |
| C | 0 | 27 | 0 |
| D | 0 | 27 | 0 |
| Mode SS | |||
|---|---|---|---|
| Quadrant | BADHDUFLAG | Total packets | Discarded packets |
| A | 0 | 104 | 0 |
| B | 0 | 104 | 0 |
| C | 0 | 104 | 0 |
| D | 0 | 104 | 0 |
| Quadrant | Total seconds | Saturated seconds | Saturation percentage |
|---|---|---|---|
| A | 5006 | 248 | 4.954055% |
| B | 5005 | 21 | 0.419580% |
| C | 5005 | 962 | 19.220779% |
| D | 5005 | 419 | 8.371628% |
Noise dominated data is calculated using 1-second bins in cleaned event files. If a bin has >2000 counts, and if more than 50% of those come from <1% of pixels, then it is considered to be noise-dominated and hence unusable.
| Quadrant | # 1 sec bins | Bins with >0 counts | Bins with >2000 counts | High rate bins dominated by noise | Noise dominated (total time) | Noise dominated (detector-on time) | Marked lightcurve |
|---|---|---|---|---|---|---|---|
| A | 7068 | 5007 | 205 | 205 | 2.90% | 4.09% | 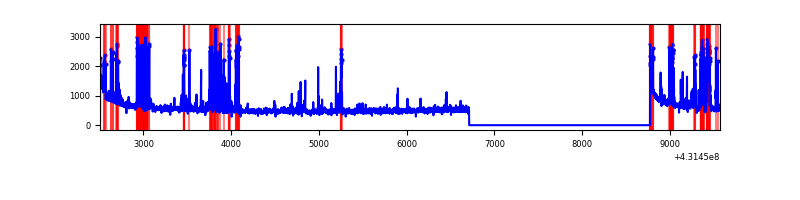 |
| B | 7067 | 5006 | 14 | 14 | 0.20% | 0.28% | 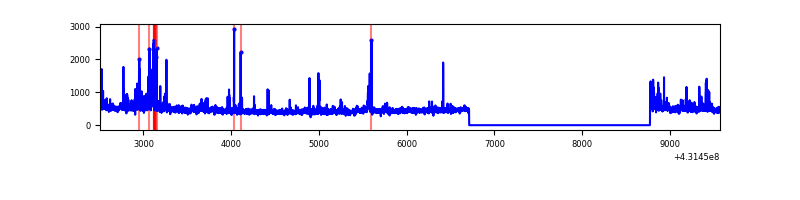 |
| C | 7067 | 5006 | 974 | 974 | 13.78% | 19.46% | 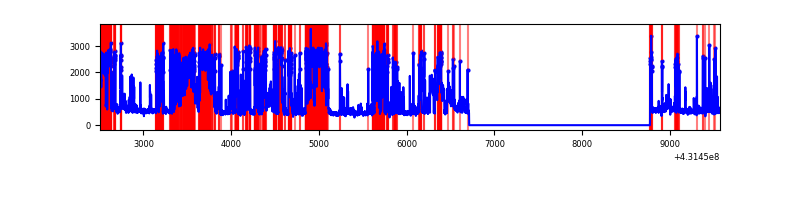 |
| D | 7066 | 5005 | 404 | 404 | 5.72% | 8.07% | 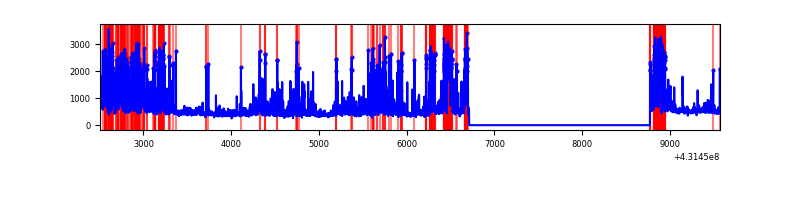 |
Top three noisy pixels from each quadrant. If the there are fewer than three noisy pixels in the level2.evt file, extra rows are filled as -1
| Pixel properties | Quadrant properties | ||||||
|---|---|---|---|---|---|---|---|
| Quadrant | DetID | PixID | Counts | Sigma | Mean | Median | Sigma |
| A | 10 | 83 | 564048 | 5033.35 | 546 | 536 | 112.0 |
| A | 15 | 237 | 537105 | 4792.7 | 546 | 536 | 112.0 |
| A | 13 | 248 | 155200 | 1381.48 | 546 | 536 | 112.0 |
| B | 0 | 229 | 158861 | 1505.65 | 556 | 542 | 105.1 |
| B | 4 | 171 | 53823 | 506.72 | 556 | 542 | 105.1 |
| B | 3 | 112 | 27351 | 254.96 | 556 | 542 | 105.1 |
| C | 12 | 2 | 3144037 | 26920.96 | 504 | 507 | 116.8 |
| C | 15 | 214 | 197850 | 1690.03 | 504 | 507 | 116.8 |
| C | 14 | 254 | 137325 | 1171.7 | 504 | 507 | 116.8 |
| D | 1 | 52 | 1203105 | 9218.35 | 529 | 513 | 130.5 |
| D | 12 | 6 | 251723 | 1925.63 | 529 | 513 | 130.5 |
| D | 13 | 249 | 150235 | 1147.68 | 529 | 513 | 130.5 |
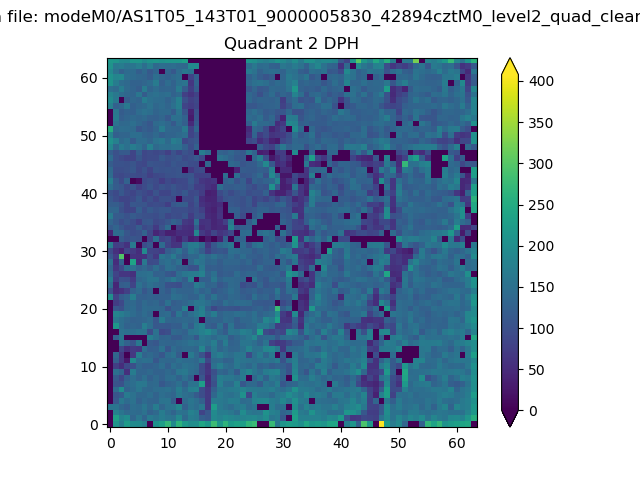
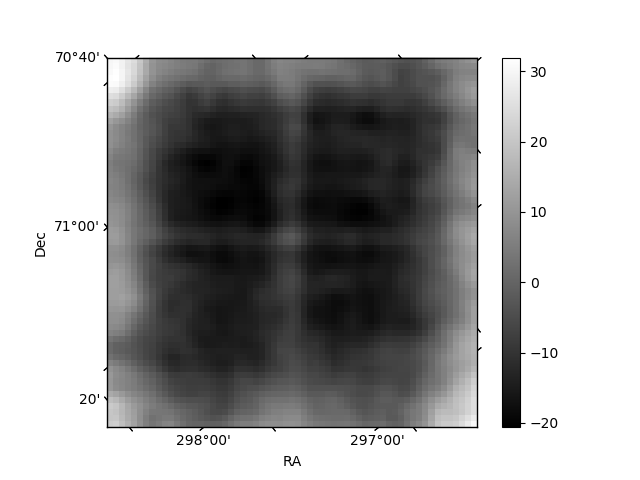
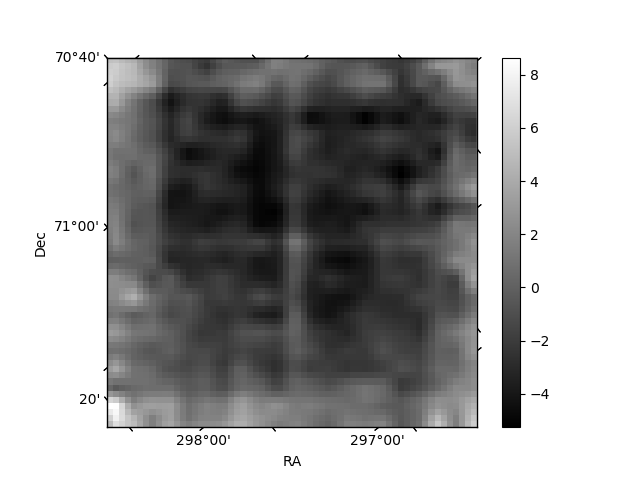
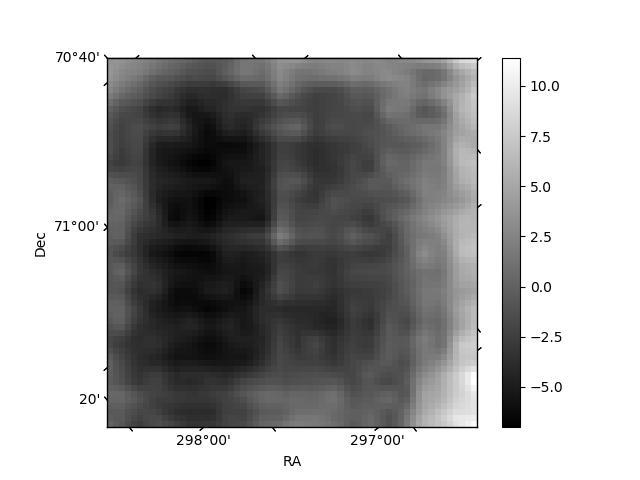
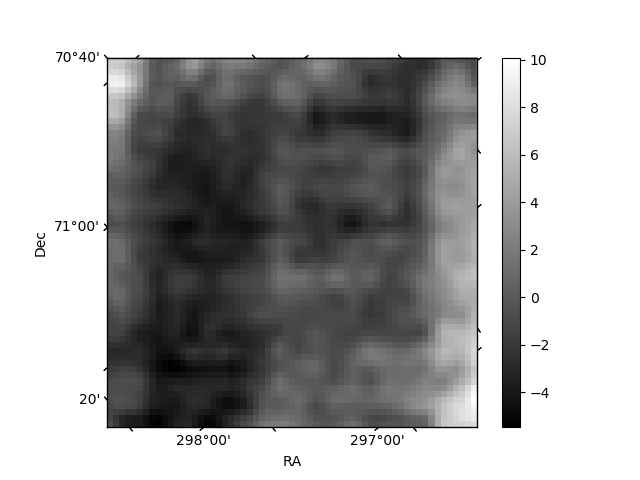
Histogram calculated using DETX and DETY for each event in the final _common_clean file
| Quadrant A | 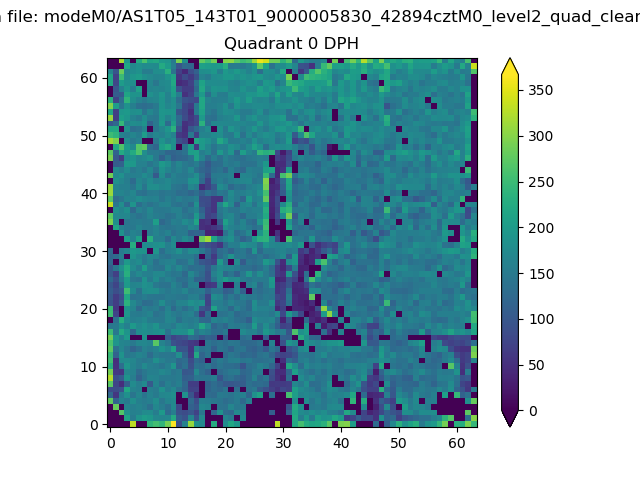 |
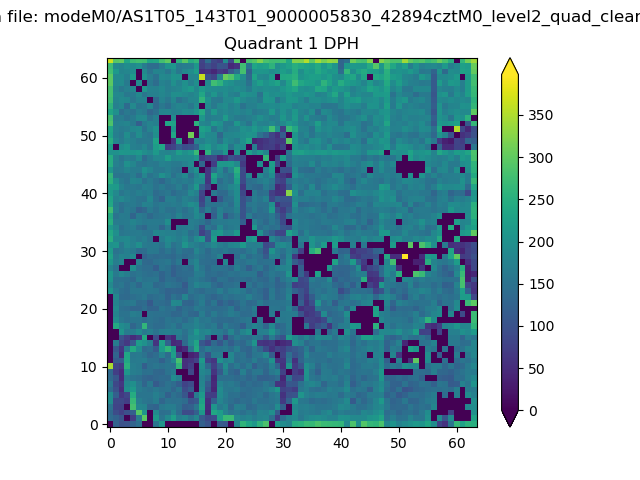 |
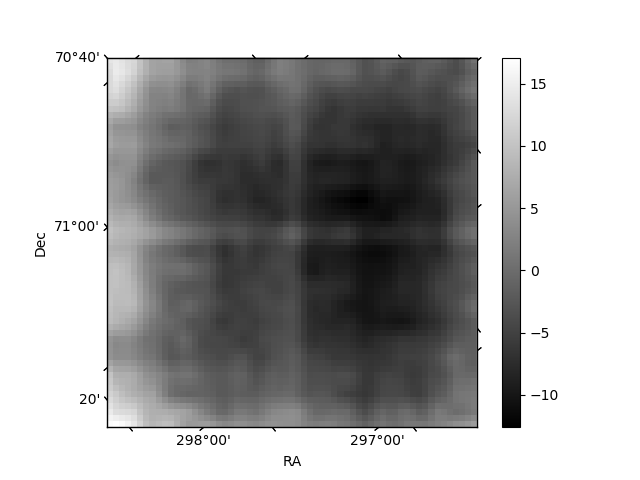
Quadrant B |
|---|---|---|---|
| Quadrant D | 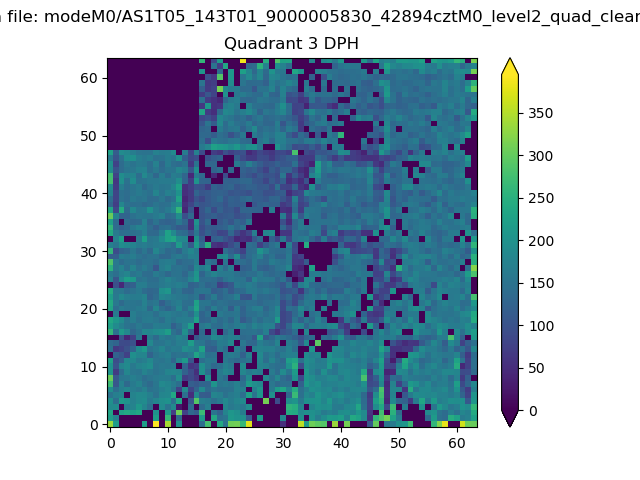 |
 |
Quadrant C |
| Plot type | Count rate plots | Images |
|---|---|---|
| Comparison with Poisson distribution Blue bars denote a histogram of data divided into 1 sec bins. Red curve is a Poisson curve with rate = median count rate of data. |
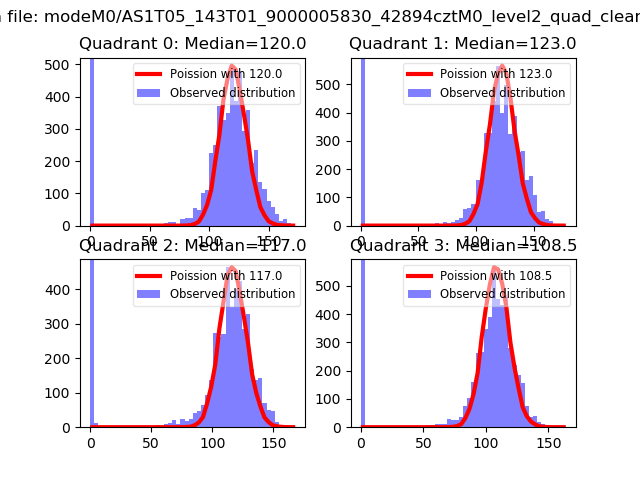 |
 |
| Quadrant-wise count rates Data is divided into 100 sec bins |
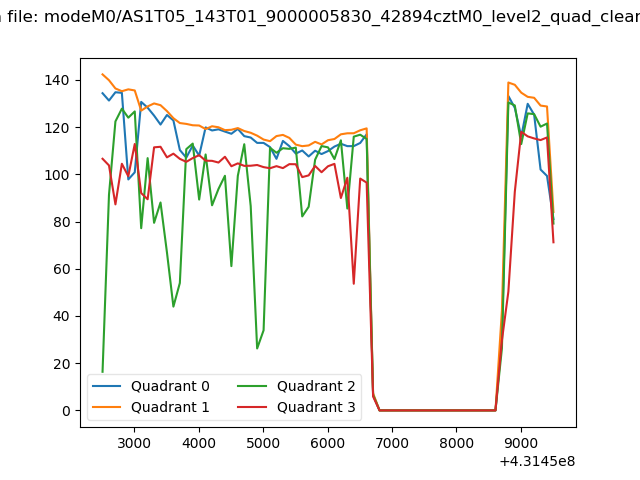 |
|
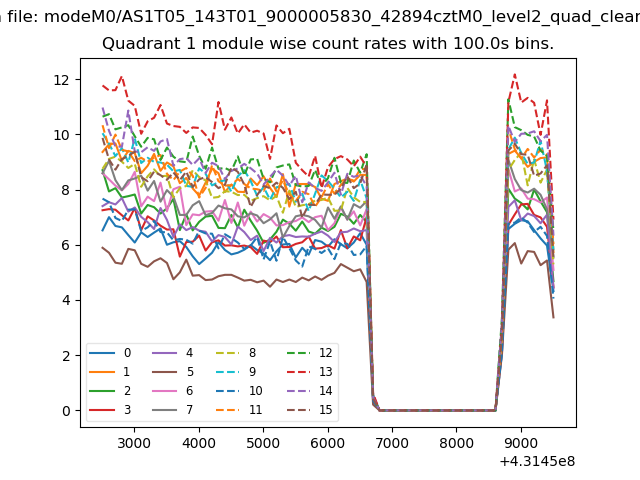
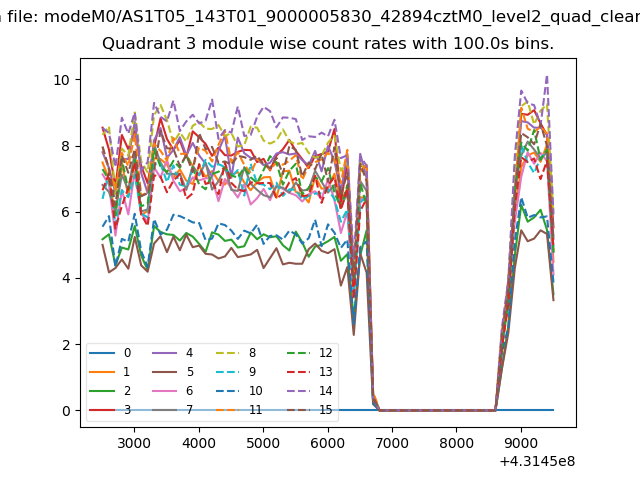
| Module-wise count rates for Quadrant A Data is divided into 100 sec bins |
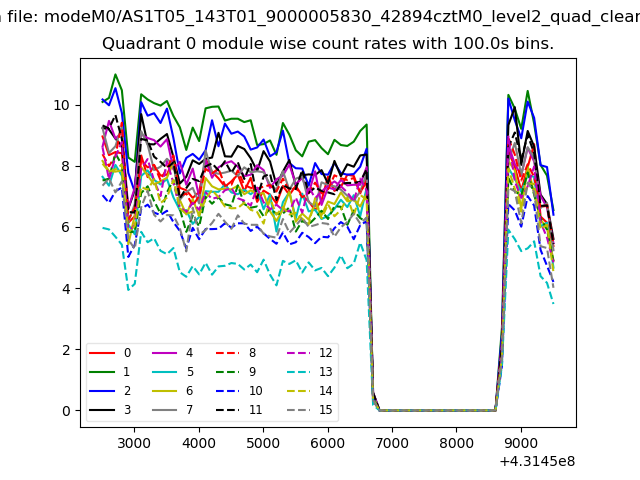 |
 |
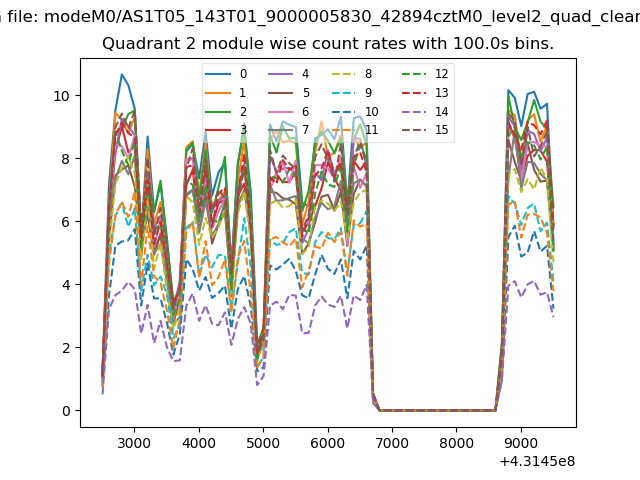
| Module-wise count rates for Quadrant B Data is divided into 100 sec bins |
 |
 |
| Module-wise count rates for Quadrant C Data is divided into 100 sec bins |
 |
 |
| Module-wise count rates for Quadrant D Data is divided into 100 sec bins |
 |
 |
| Parameter | Plot |
|---|---|
| CZT HV Monitor | 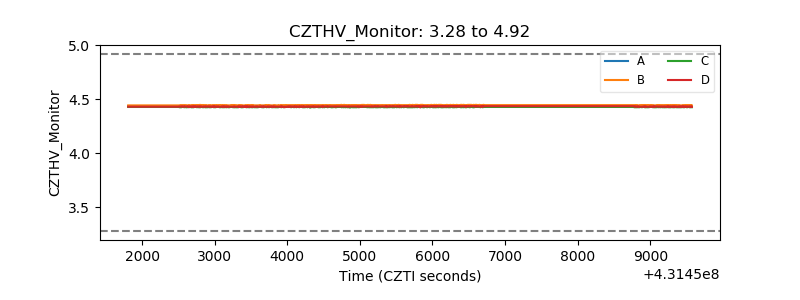 |
| D_VDD | 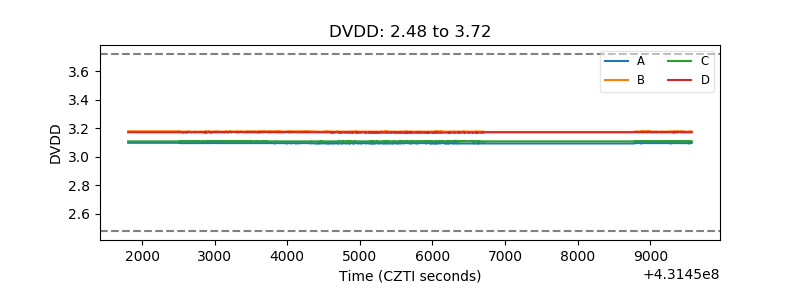 |
| Temperature 1 | 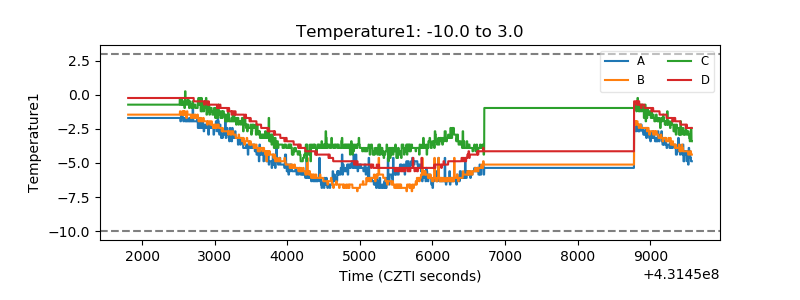 |
| Veto HV Monitor | 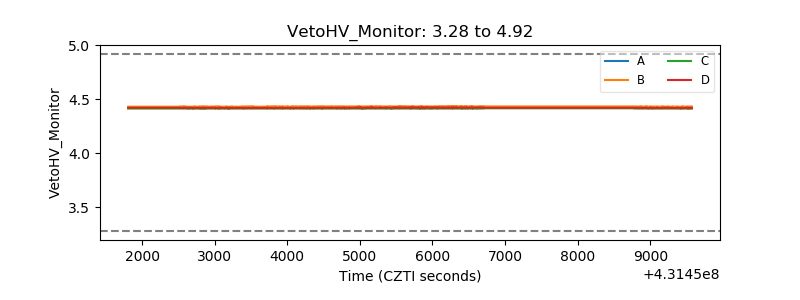 |
| Veto LLD | 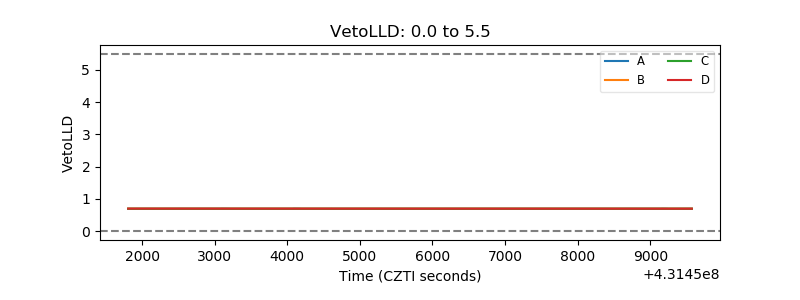 |
| Alpha Counter | 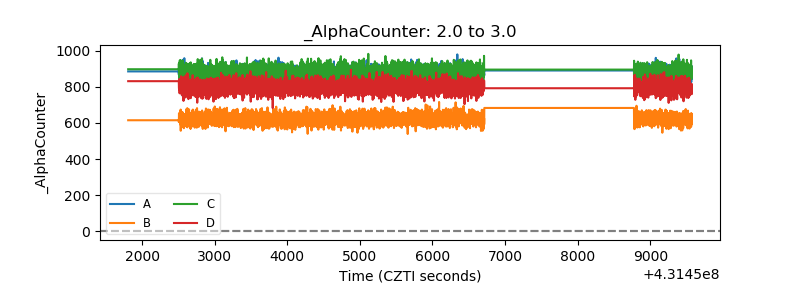 |
| _CPM_Rate | 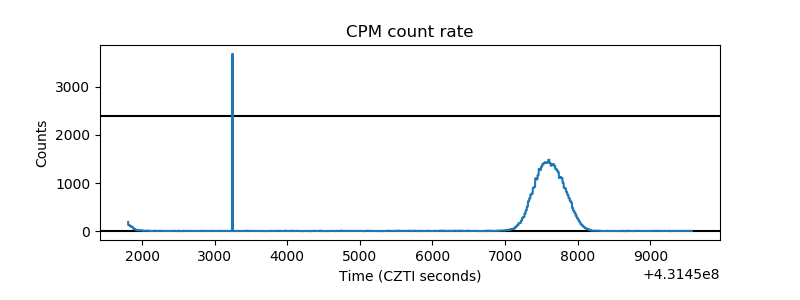 |
| CZT Counter | 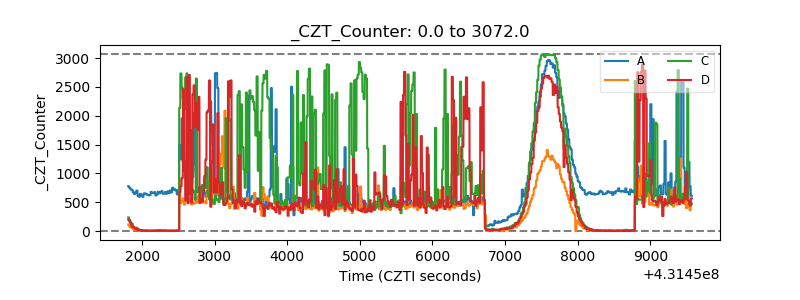 |
| +2.5 Volts monitor |  |
| +5 Volts monitor | 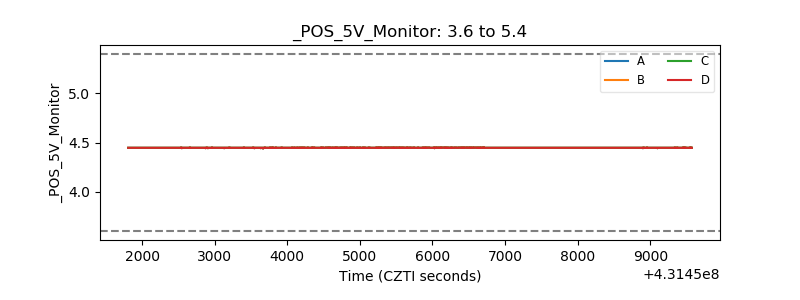 |
| _ROLL_ROT | 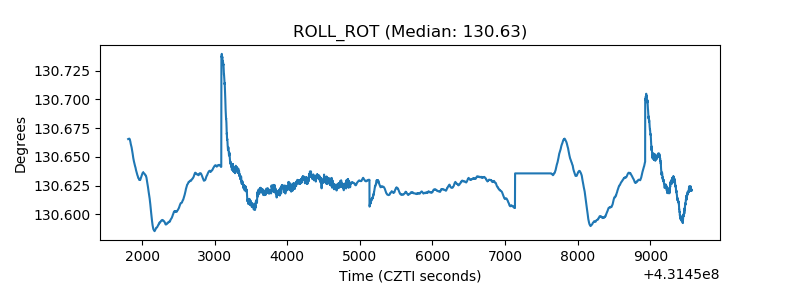 |
| _Roll_DEC | 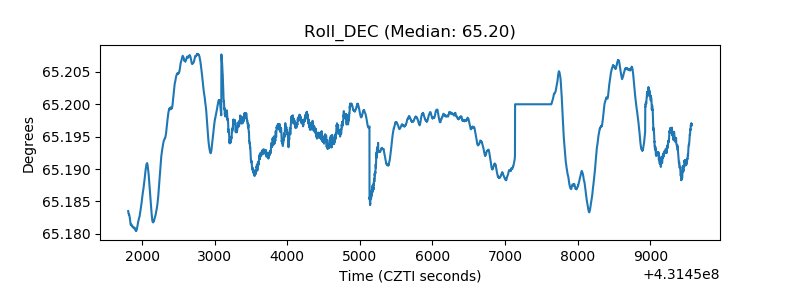 |
| _Roll_RA | 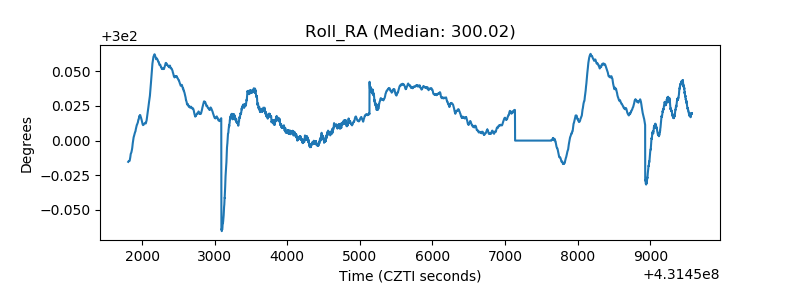 |
| Veto Counter | 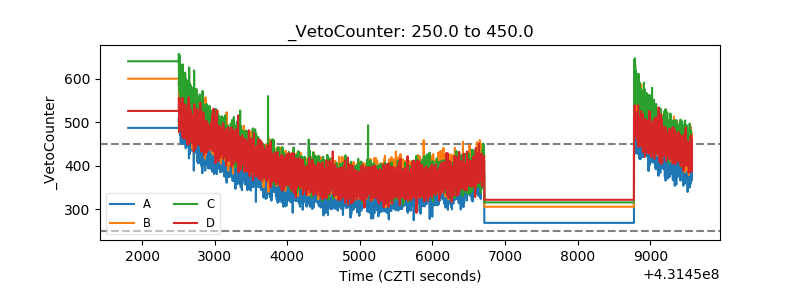 |