| Param | Original file | Final file |
|---|---|---|
| Filename | modeM0/AS1T05_143T01_9000005830_42895cztM0_level2.fits | modeM0/AS1T05_143T01_9000005830_42895cztM0_level2_quad_clean.evt |
| Size (bytes) | 333,224,640 | 84,516,480 |
| Size | 317.8 MB | 80.6 MB |
| Events in quadrant A | 3,146,819 | 561,339 |
| Events in quadrant B | 2,287,754 | 593,367 |
| Events in quadrant C | 2,959,519 | 563,369 |
| Events in quadrant D | 3,560,220 | 498,468 |
| Mode M0 | |||
|---|---|---|---|
| Quadrant | BADHDUFLAG | Total packets | Discarded packets |
| A | 0 | 12499 | 2 |
| B | 0 | 10170 | 2 |
| C | 0 | 11792 | 2 |
| D | 0 | 13927 | 2 |
| Mode M9 | |||
|---|---|---|---|
| Quadrant | BADHDUFLAG | Total packets | Discarded packets |
| A | 0 | 31 | 0 |
| B | 0 | 32 | 0 |
| C | 0 | 32 | 0 |
| D | 0 | 32 | 0 |
| Mode SS | |||
|---|---|---|---|
| Quadrant | BADHDUFLAG | Total packets | Discarded packets |
| A | 0 | 100 | 0 |
| B | 0 | 100 | 0 |
| C | 0 | 100 | 0 |
| D | 0 | 100 | 0 |
| Quadrant | Total seconds | Saturated seconds | Saturation percentage |
|---|---|---|---|
| A | 4884 | 164 | 3.357903% |
| B | 4884 | 12 | 0.245700% |
| C | 4884 | 82 | 1.678952% |
| D | 4884 | 309 | 6.326781% |
Noise dominated data is calculated using 1-second bins in cleaned event files. If a bin has >2000 counts, and if more than 50% of those come from <1% of pixels, then it is considered to be noise-dominated and hence unusable.
| Quadrant | # 1 sec bins | Bins with >0 counts | Bins with >2000 counts | High rate bins dominated by noise | Noise dominated (total time) | Noise dominated (detector-on time) | Marked lightcurve |
|---|---|---|---|---|---|---|---|
| A | 7008 | 4885 | 138 | 138 | 1.97% | 2.82% | 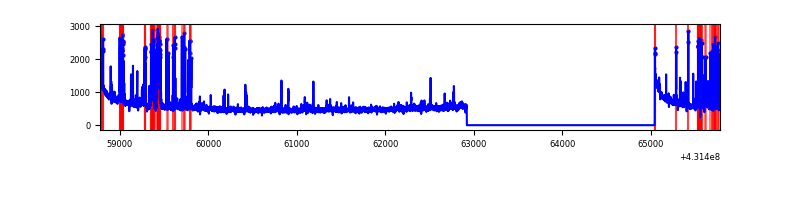 |
| B | 7008 | 4885 | 6 | 6 | 0.09% | 0.12% | 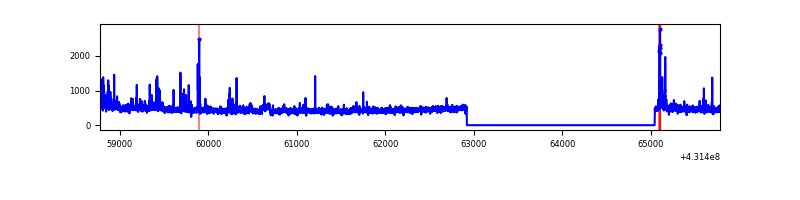 |
| C | 7007 | 4884 | 75 | 75 | 1.07% | 1.54% | 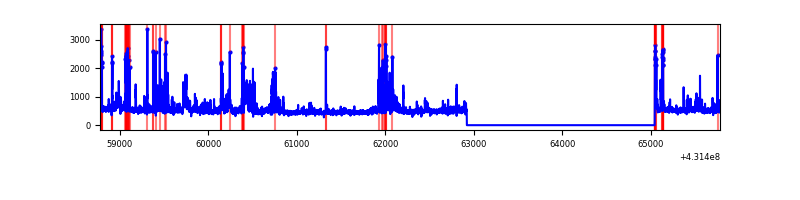 |
| D | 7008 | 4885 | 321 | 321 | 4.58% | 6.57% | 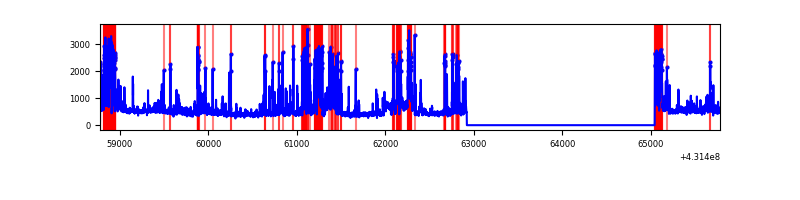 |
Top three noisy pixels from each quadrant. If the there are fewer than three noisy pixels in the level2.evt file, extra rows are filled as -1
| Pixel properties | Quadrant properties | ||||||
|---|---|---|---|---|---|---|---|
| Quadrant | DetID | PixID | Counts | Sigma | Mean | Median | Sigma |
| A | 10 | 83 | 546528 | 5146.53 | 523 | 514 | 106.1 |
| A | 15 | 237 | 465087 | 4378.9 | 523 | 514 | 106.1 |
| A | 12 | 189 | 68966 | 645.2 | 523 | 514 | 106.1 |
| B | 3 | 112 | 67478 | 667.17 | 533 | 518 | 100.4 |
| B | 0 | 229 | 60721 | 599.84 | 533 | 518 | 100.4 |
| B | 4 | 171 | 35077 | 344.33 | 533 | 518 | 100.4 |
| C | 12 | 2 | 494145 | 4084.73 | 526 | 532 | 120.8 |
| C | 15 | 214 | 209256 | 1727.23 | 526 | 532 | 120.8 |
| C | 14 | 254 | 78510 | 645.28 | 526 | 532 | 120.8 |
| D | 1 | 52 | 799494 | 6457.14 | 509 | 495 | 123.7 |
| D | 12 | 6 | 406681 | 3282.61 | 509 | 495 | 123.7 |
| D | 13 | 249 | 164953 | 1329.07 | 509 | 495 | 123.7 |
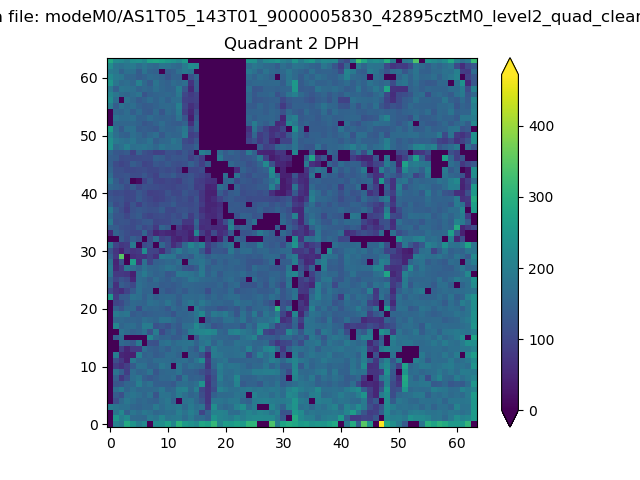
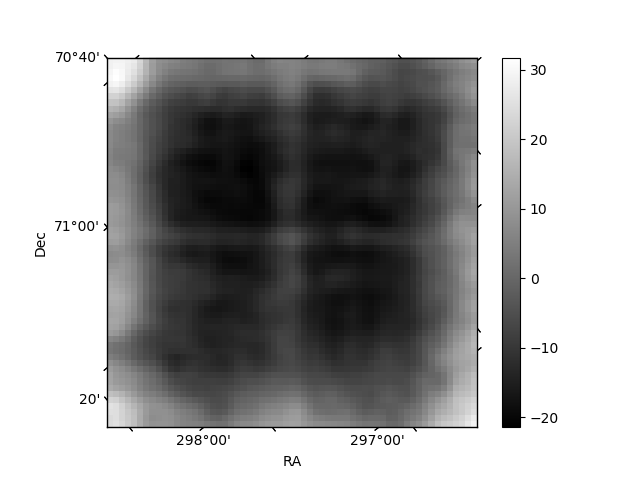
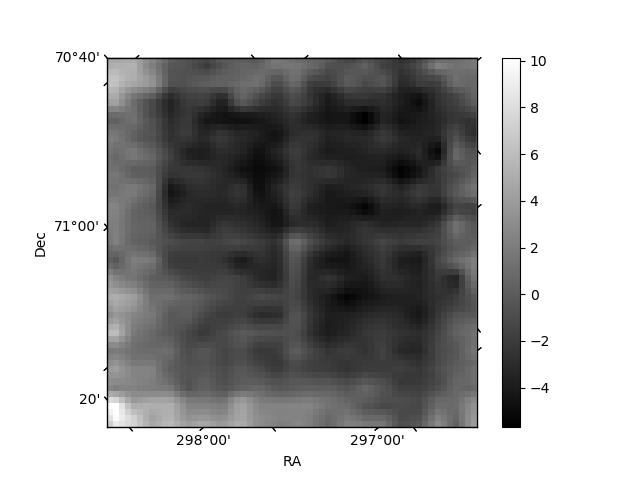
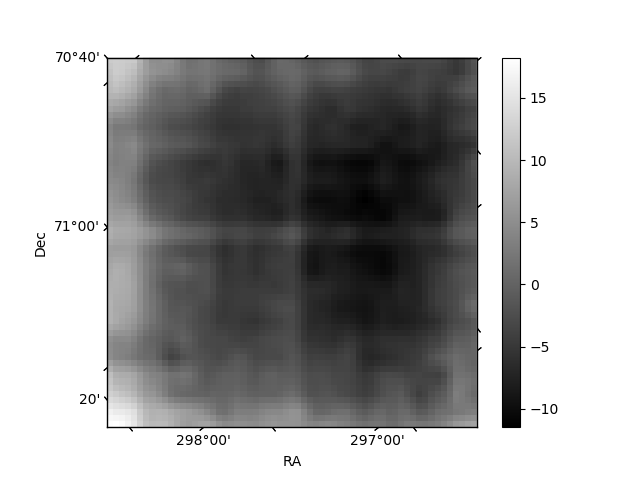
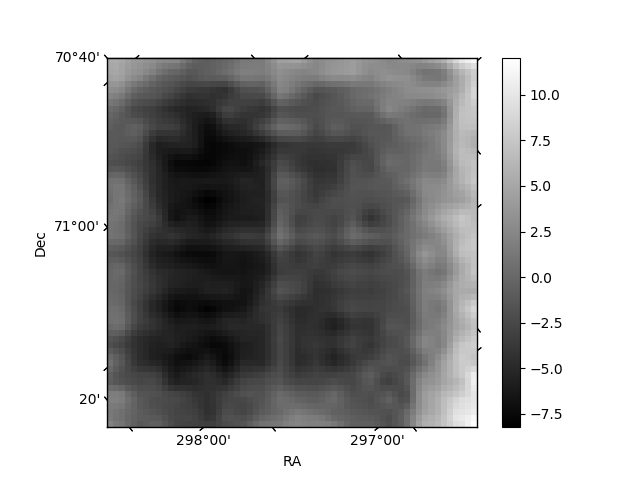
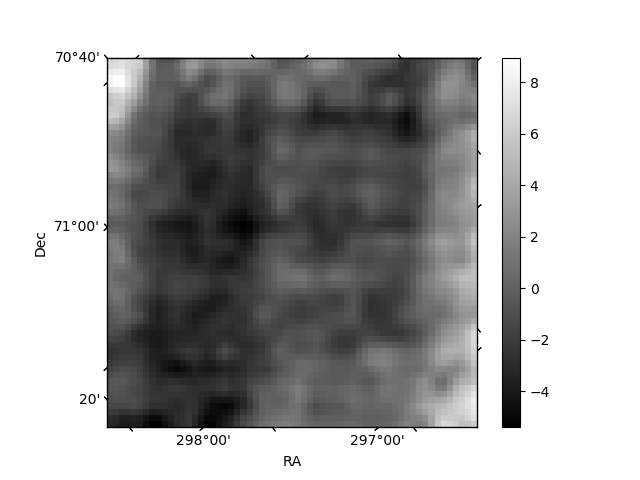
Histogram calculated using DETX and DETY for each event in the final _common_clean file
| Quadrant A | 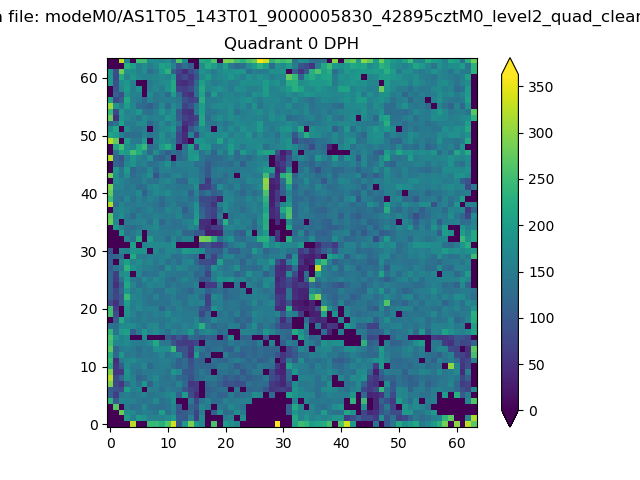 |
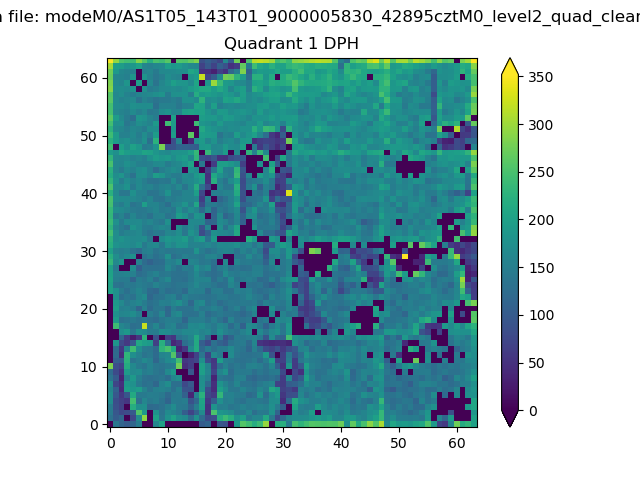 |
Quadrant B |
|---|---|---|---|
| Quadrant D | 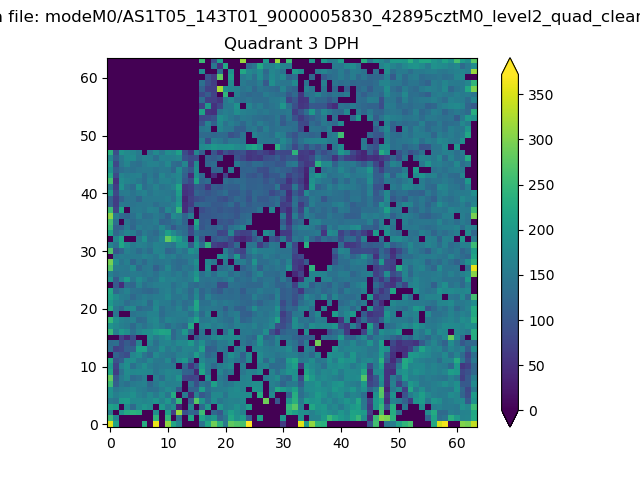 |
 |
Quadrant C |
| Plot type | Count rate plots | Images |
|---|---|---|
| Comparison with Poisson distribution Blue bars denote a histogram of data divided into 1 sec bins. Red curve is a Poisson curve with rate = median count rate of data. |
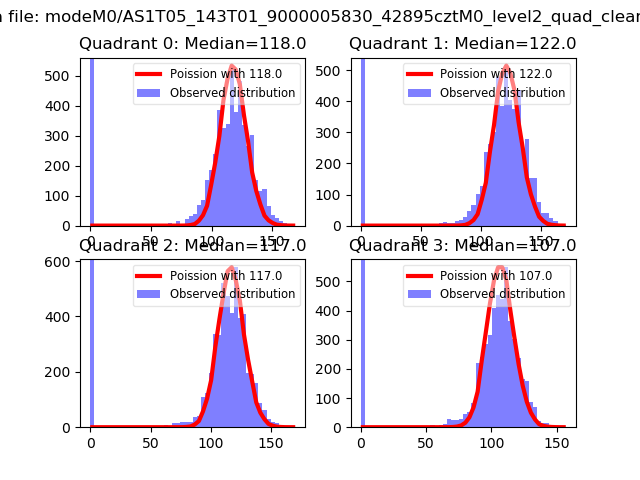 |
 |
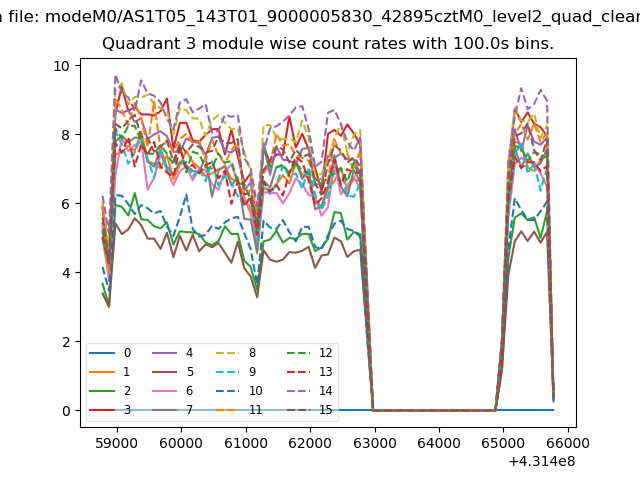
| Quadrant-wise count rates Data is divided into 100 sec bins |
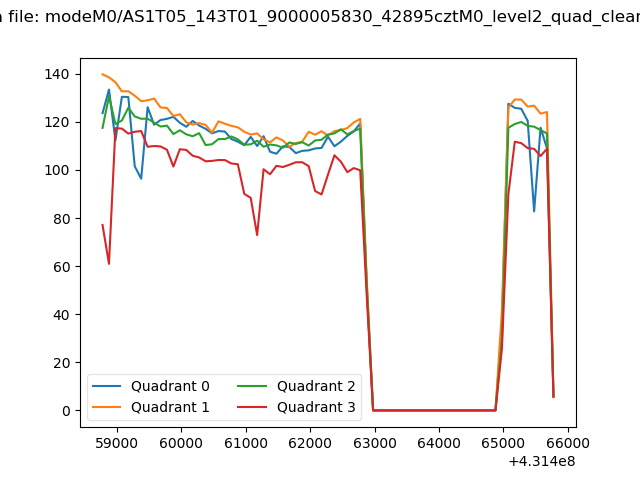 |
|
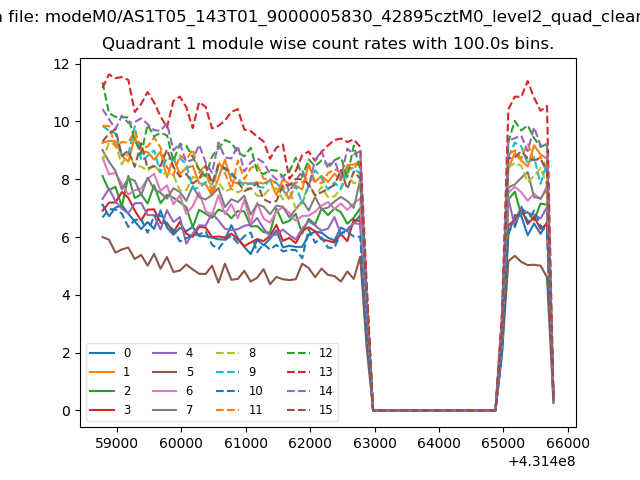
| Module-wise count rates for Quadrant A Data is divided into 100 sec bins |
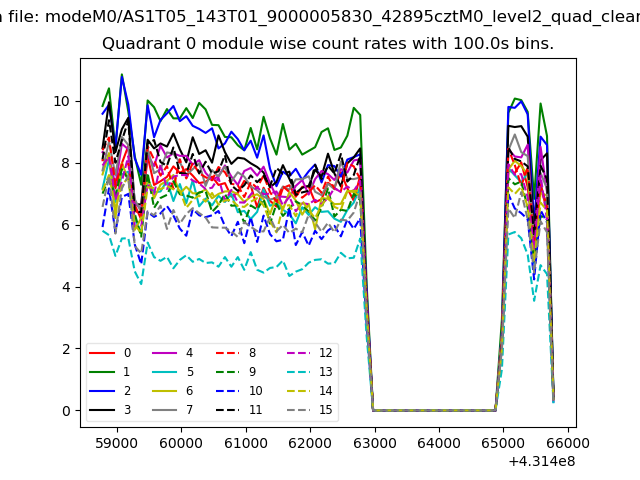 |
 |
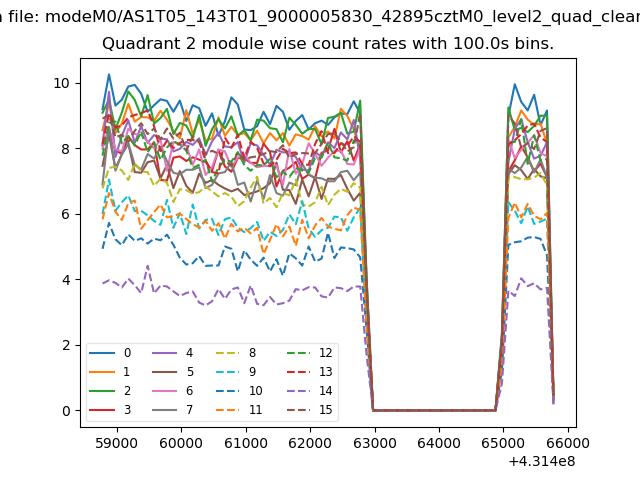
| Module-wise count rates for Quadrant B Data is divided into 100 sec bins |
 |
 |
| Module-wise count rates for Quadrant C Data is divided into 100 sec bins |
 |
 |
| Module-wise count rates for Quadrant D Data is divided into 100 sec bins |
 |
 |
| Parameter | Plot |
|---|---|
| CZT HV Monitor | 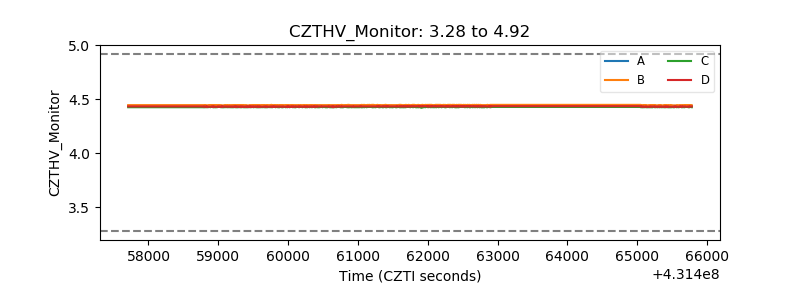 |
| D_VDD | 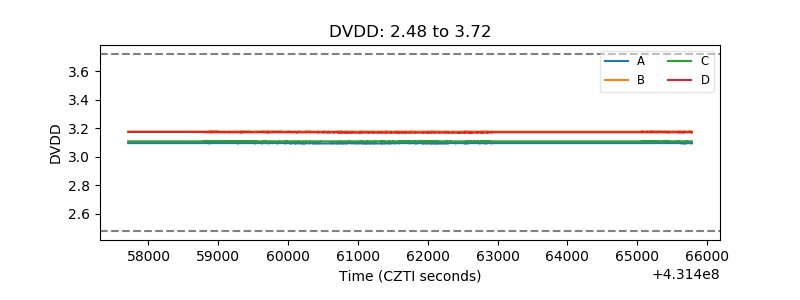 |
| Temperature 1 | 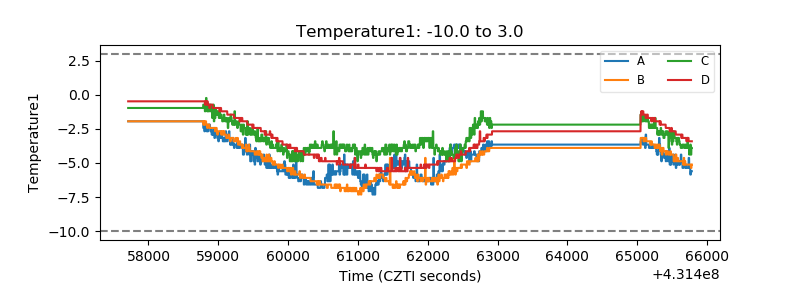 |
| Veto HV Monitor | 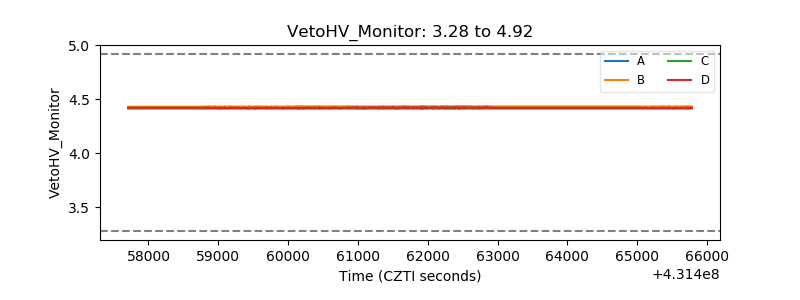 |
| Veto LLD | 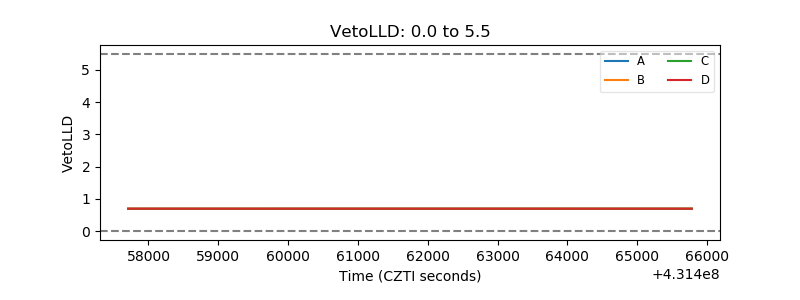 |
| Alpha Counter | 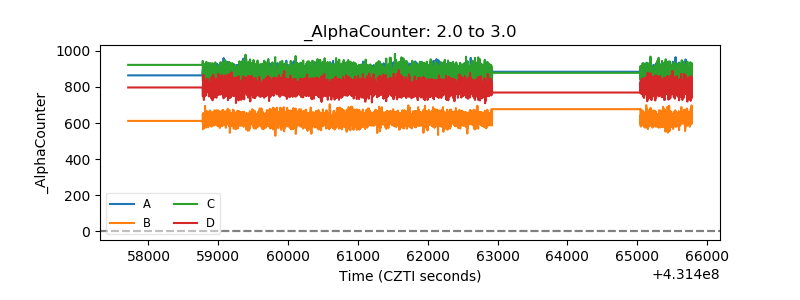 |
| _CPM_Rate | 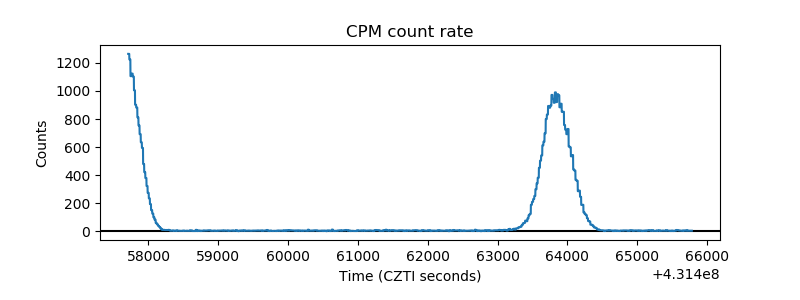 |
| CZT Counter | 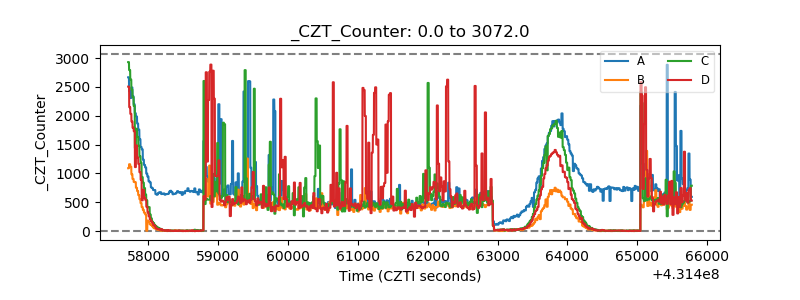 |
| +2.5 Volts monitor |  |
| +5 Volts monitor | 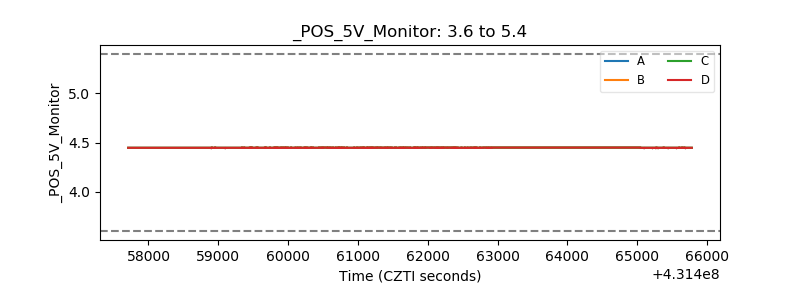 |
| _ROLL_ROT | 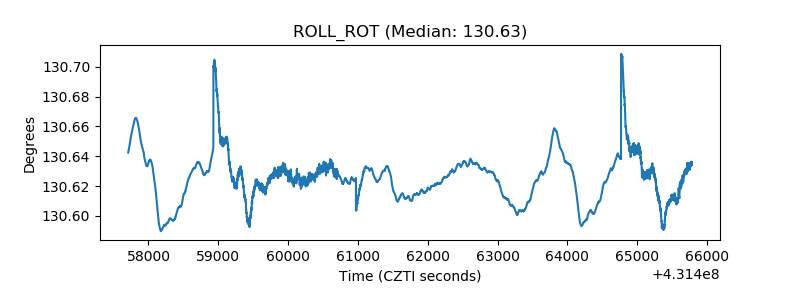 |
| _Roll_DEC | 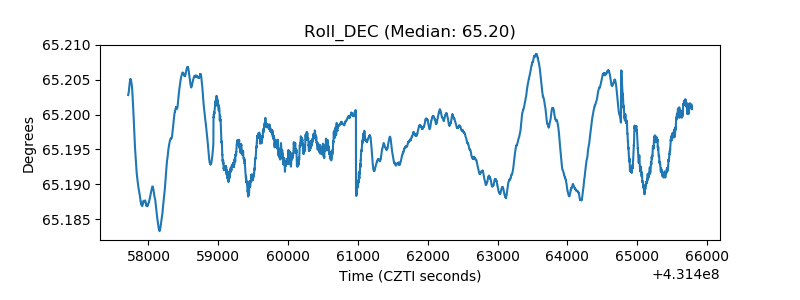 |
| _Roll_RA | 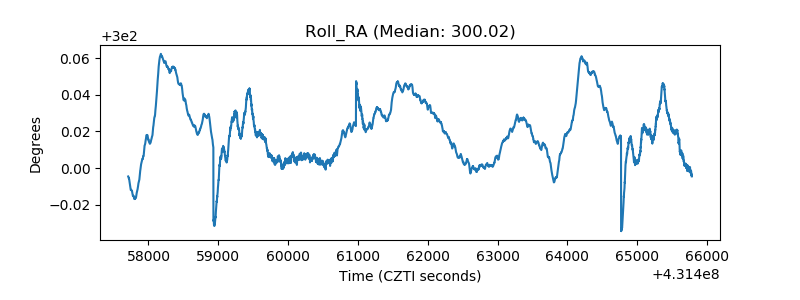 |
| Veto Counter | 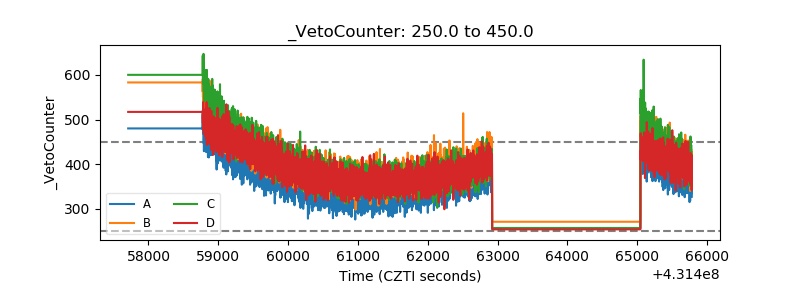 |