| Param | Original file | Final file |
|---|---|---|
| Filename | modeM0/AS1T05_143T01_9000005830_42896cztM0_level2.fits | modeM0/AS1T05_143T01_9000005830_42896cztM0_level2_quad_clean.evt |
| Size (bytes) | 315,504,000 | 79,966,080 |
| Size | 300.9 MB | 76.3 MB |
| Events in quadrant A | 2,877,351 | 530,938 |
| Events in quadrant B | 2,100,832 | 557,444 |
| Events in quadrant C | 3,019,101 | 525,000 |
| Events in quadrant D | 3,309,305 | 473,040 |
| Mode M0 | |||
|---|---|---|---|
| Quadrant | BADHDUFLAG | Total packets | Discarded packets |
| A | 0 | 11587 | 2 |
| B | 0 | 9793 | 2 |
| C | 0 | 12094 | 3 |
| D | 0 | 13177 | 2 |
| Mode M9 | |||
|---|---|---|---|
| Quadrant | BADHDUFLAG | Total packets | Discarded packets |
| A | 0 | 33 | 0 |
| B | 0 | 34 | 0 |
| C | 0 | 34 | 0 |
| D | 0 | 34 | 0 |
| Mode SS | |||
|---|---|---|---|
| Quadrant | BADHDUFLAG | Total packets | Discarded packets |
| A | 0 | 96 | 0 |
| B | 0 | 96 | 0 |
| C | 0 | 96 | 0 |
| D | 0 | 96 | 0 |
| Quadrant | Total seconds | Saturated seconds | Saturation percentage |
|---|---|---|---|
| A | 4777 | 111 | 2.323634% |
| B | 4777 | 11 | 0.230270% |
| C | 4776 | 126 | 2.638191% |
| D | 4776 | 264 | 5.527638% |
Noise dominated data is calculated using 1-second bins in cleaned event files. If a bin has >2000 counts, and if more than 50% of those come from <1% of pixels, then it is considered to be noise-dominated and hence unusable.
| Quadrant | # 1 sec bins | Bins with >0 counts | Bins with >2000 counts | High rate bins dominated by noise | Noise dominated (total time) | Noise dominated (detector-on time) | Marked lightcurve |
|---|---|---|---|---|---|---|---|
| A | 6901 | 4778 | 84 | 84 | 1.22% | 1.76% | 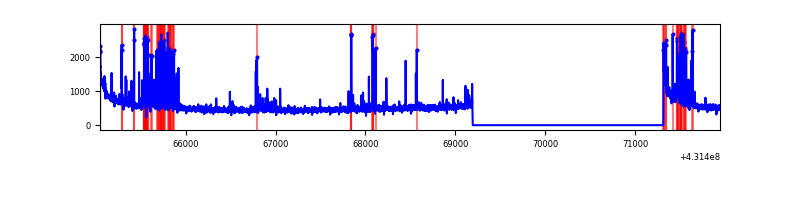 |
| B | 6901 | 4778 | 5 | 5 | 0.07% | 0.10% | 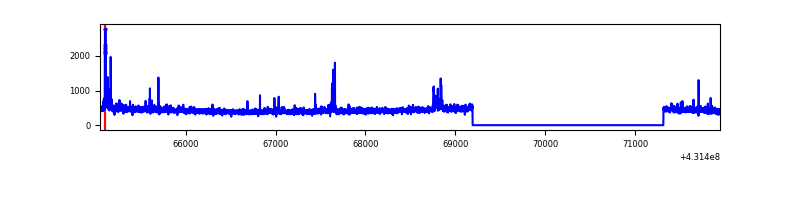 |
| C | 6900 | 4777 | 131 | 131 | 1.90% | 2.74% | 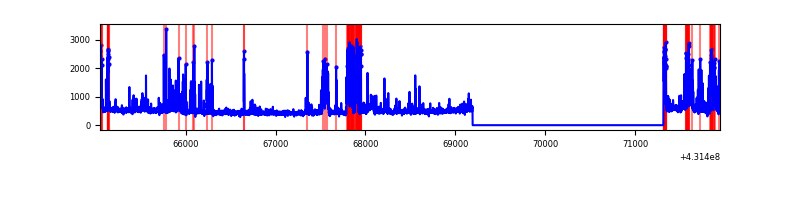 |
| D | 6900 | 4777 | 276 | 276 | 4.00% | 5.78% | 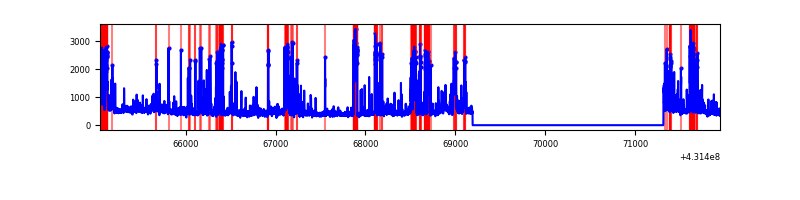 |
Top three noisy pixels from each quadrant. If the there are fewer than three noisy pixels in the level2.evt file, extra rows are filled as -1
| Pixel properties | Quadrant properties | ||||||
|---|---|---|---|---|---|---|---|
| Quadrant | DetID | PixID | Counts | Sigma | Mean | Median | Sigma |
| A | 10 | 83 | 525502 | 5116.98 | 500 | 490 | 102.6 |
| A | 15 | 237 | 330169 | 3213.19 | 500 | 490 | 102.6 |
| A | 12 | 189 | 42293 | 407.43 | 500 | 490 | 102.6 |
| B | 0 | 229 | 43879 | 443.77 | 507 | 493 | 97.8 |
| B | 3 | 112 | 24243 | 242.92 | 507 | 493 | 97.8 |
| B | 5 | 172 | 16094 | 159.57 | 507 | 493 | 97.8 |
| C | 15 | 208 | 260464 | 2236.16 | 496 | 499 | 116.3 |
| C | 15 | 214 | 207115 | 1777.26 | 496 | 499 | 116.3 |
| C | 14 | 254 | 195576 | 1678.0 | 496 | 499 | 116.3 |
| D | 1 | 52 | 824345 | 6819.75 | 488 | 473 | 120.8 |
| D | 12 | 6 | 320922 | 2652.57 | 488 | 473 | 120.8 |
| D | 2 | 16 | 93628 | 771.1 | 488 | 473 | 120.8 |
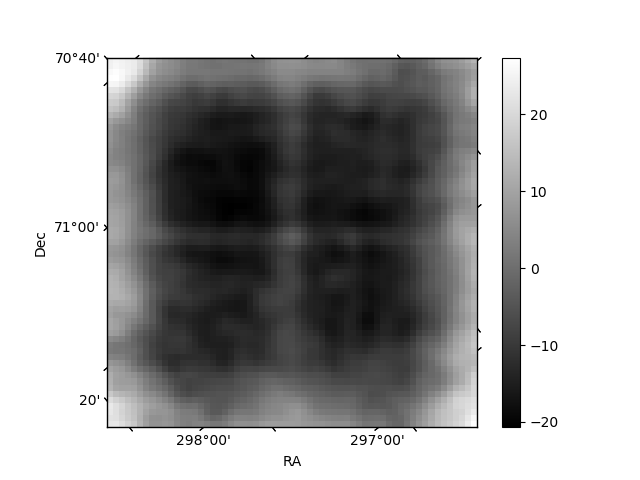
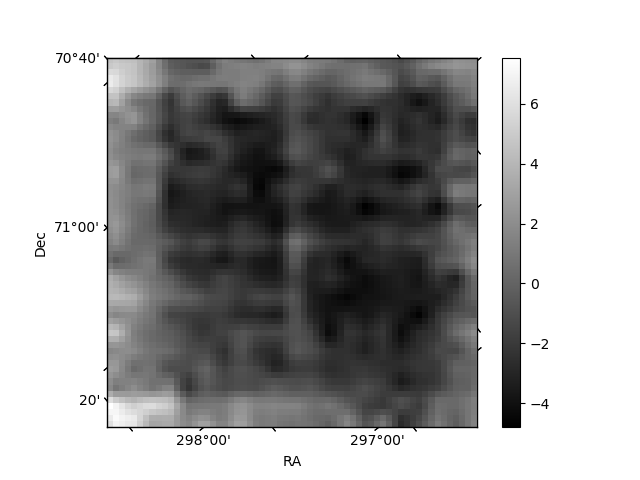
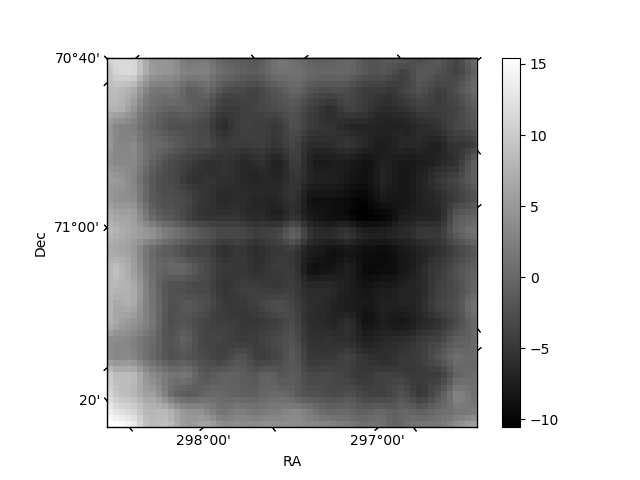
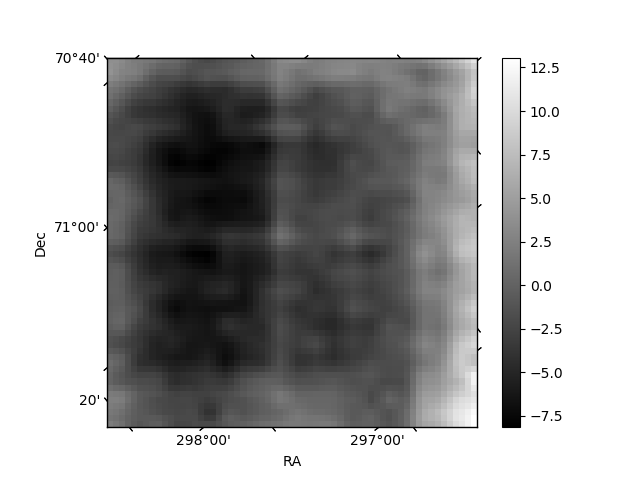
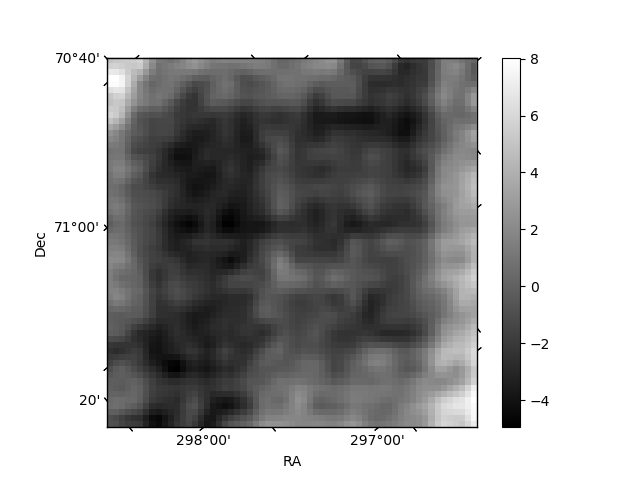
Histogram calculated using DETX and DETY for each event in the final _common_clean file
| Quadrant A | 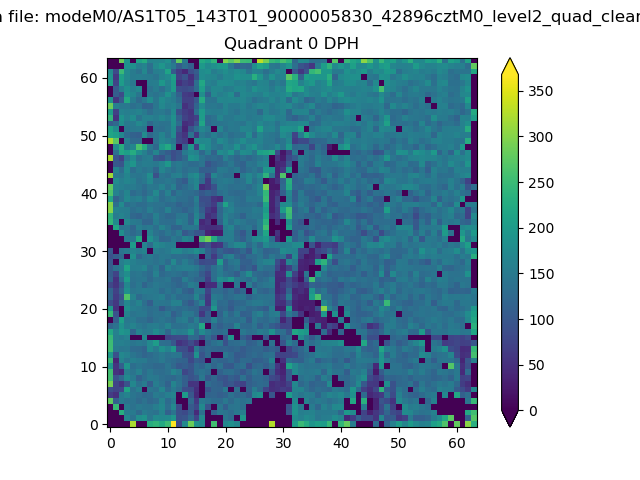 |
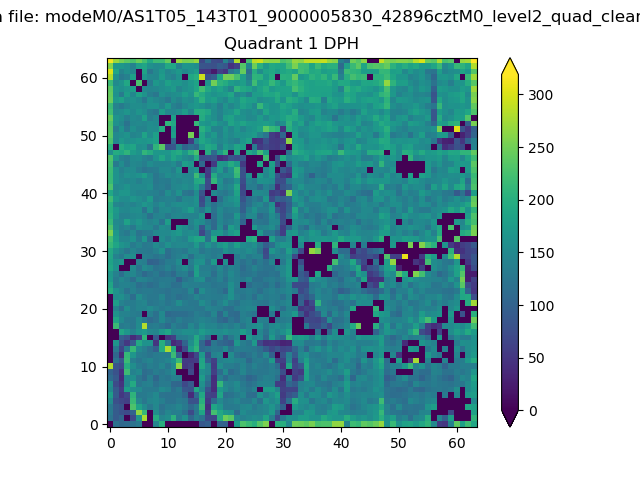 |
Quadrant B |
|---|---|---|---|
| Quadrant D | 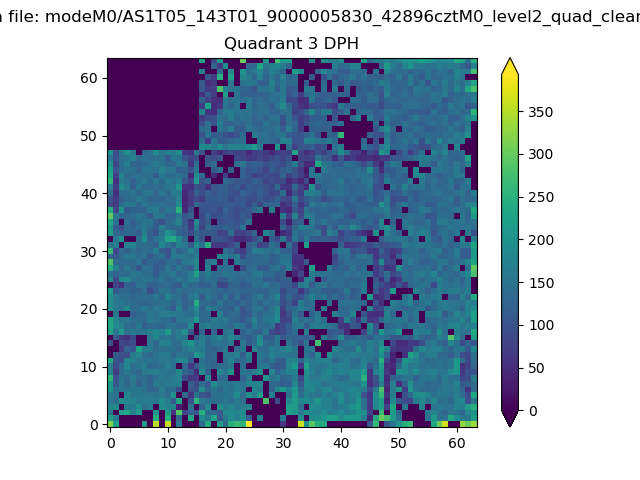 |
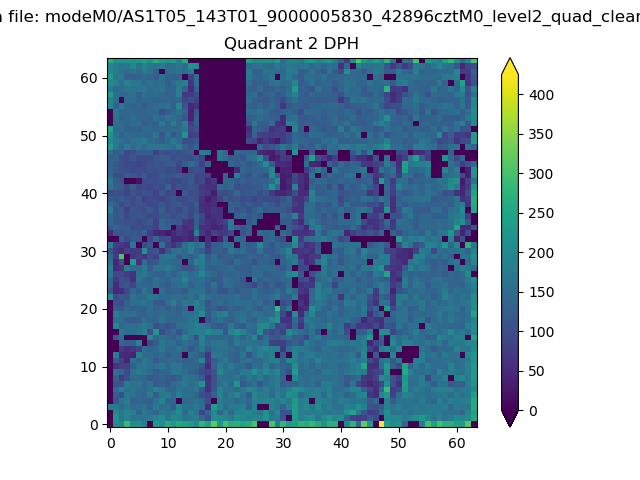 |
Quadrant C |
| Plot type | Count rate plots | Images |
|---|---|---|
| Comparison with Poisson distribution Blue bars denote a histogram of data divided into 1 sec bins. Red curve is a Poisson curve with rate = median count rate of data. |
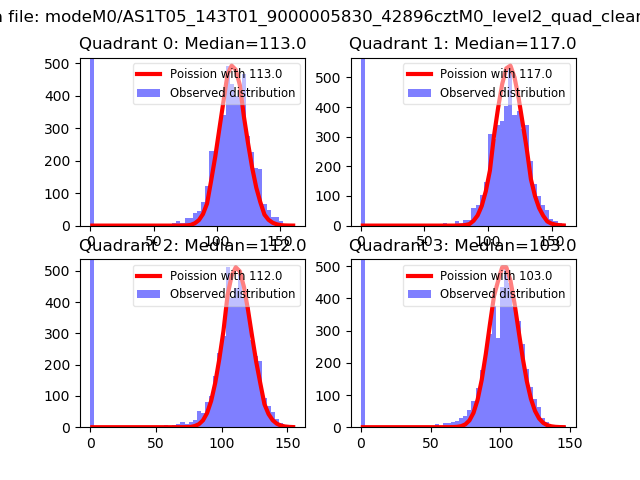 |
 |
| Quadrant-wise count rates Data is divided into 100 sec bins |
 |
|
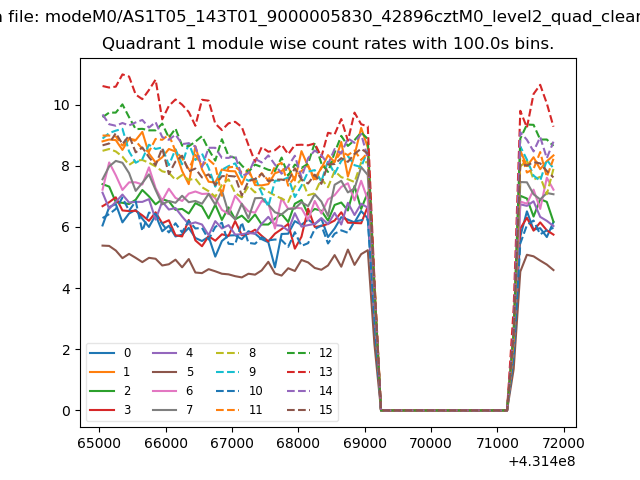
| Module-wise count rates for Quadrant A Data is divided into 100 sec bins |
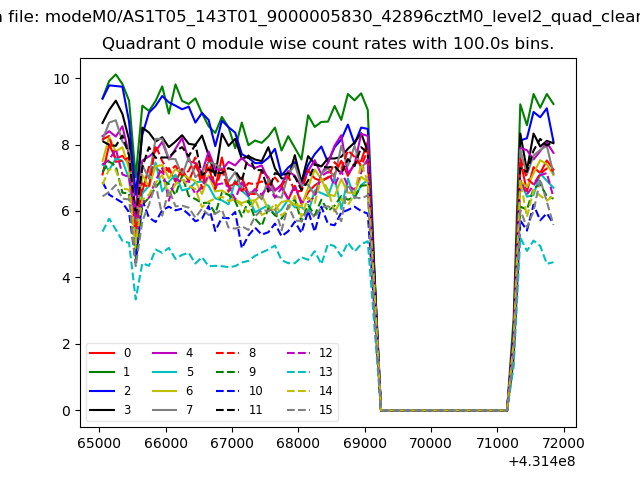 |
 |
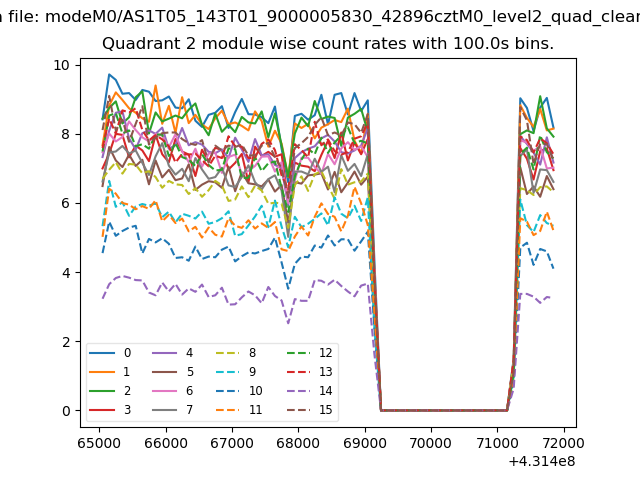
| Module-wise count rates for Quadrant B Data is divided into 100 sec bins |
 |
 |
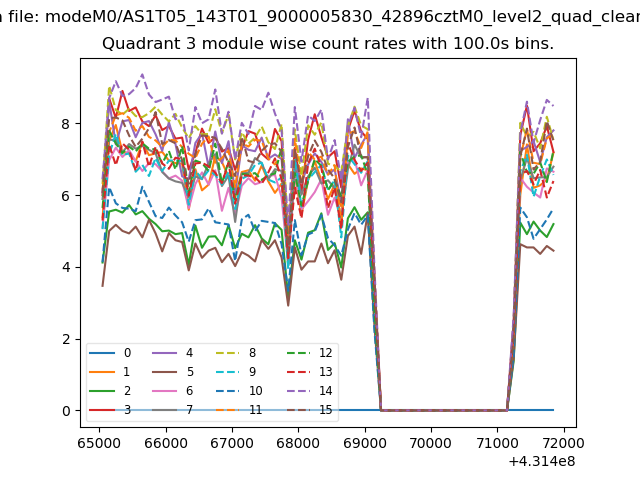
| Module-wise count rates for Quadrant C Data is divided into 100 sec bins |
 |
 |
| Module-wise count rates for Quadrant D Data is divided into 100 sec bins |
 |
 |
| Parameter | Plot |
|---|---|
| CZT HV Monitor | 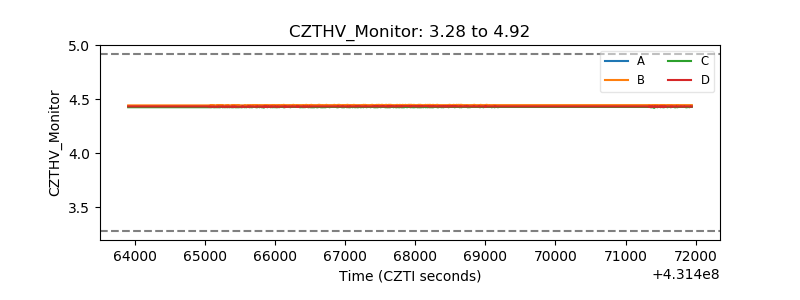 |
| D_VDD | 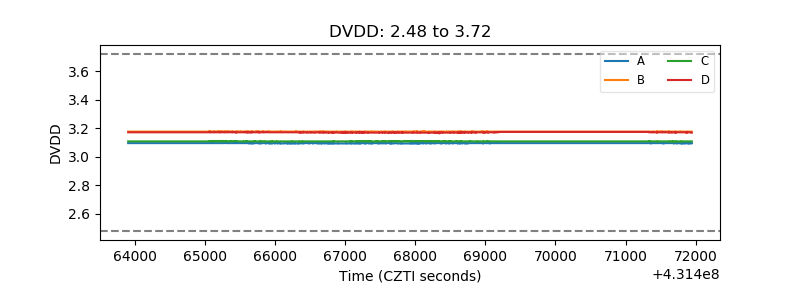 |
| Temperature 1 | 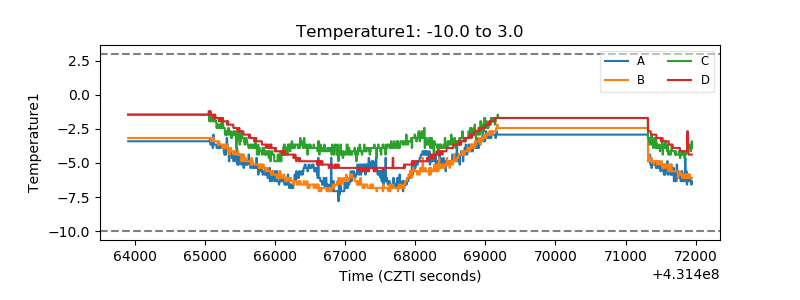 |
| Veto HV Monitor |  |
| Veto LLD | 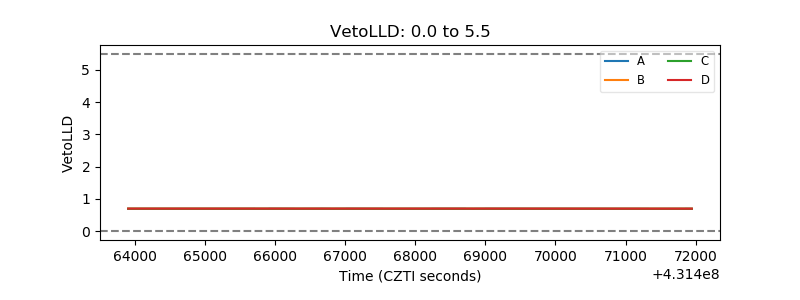 |
| Alpha Counter | 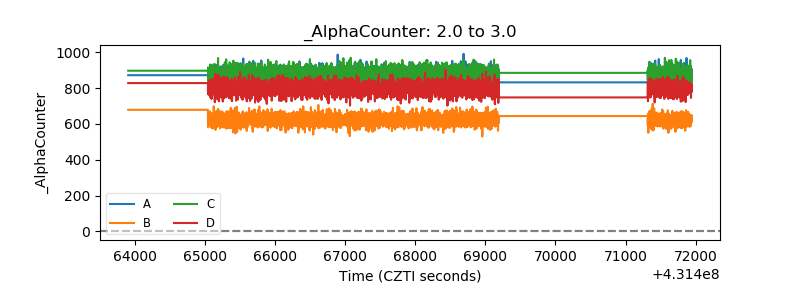 |
| _CPM_Rate | 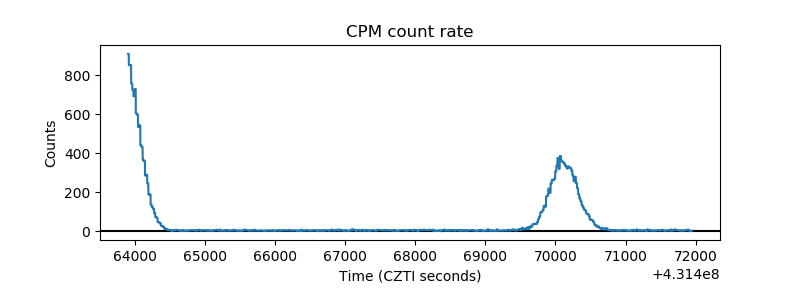 |
| CZT Counter | 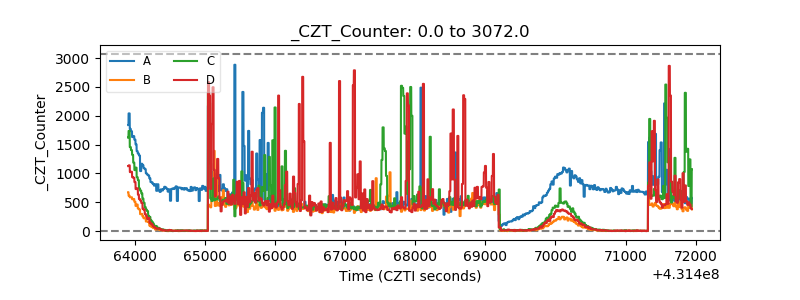 |
| +2.5 Volts monitor | 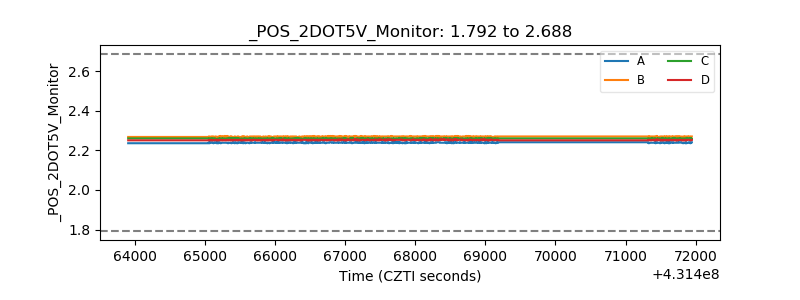 |
| +5 Volts monitor | 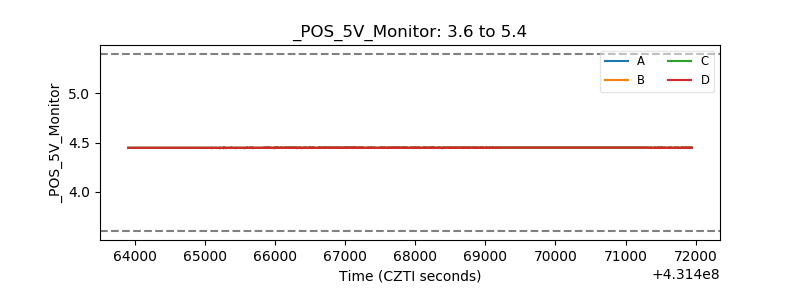 |
| _ROLL_ROT | 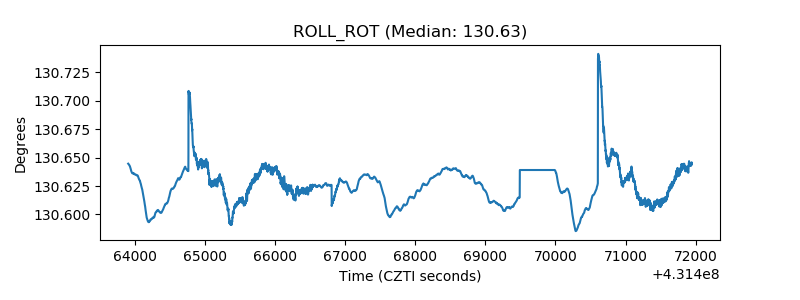 |
| _Roll_DEC | 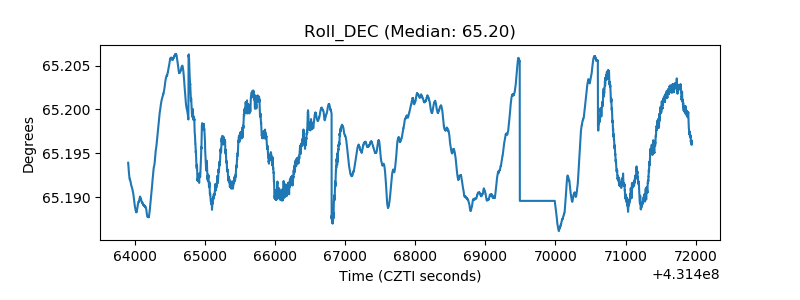 |
| _Roll_RA | 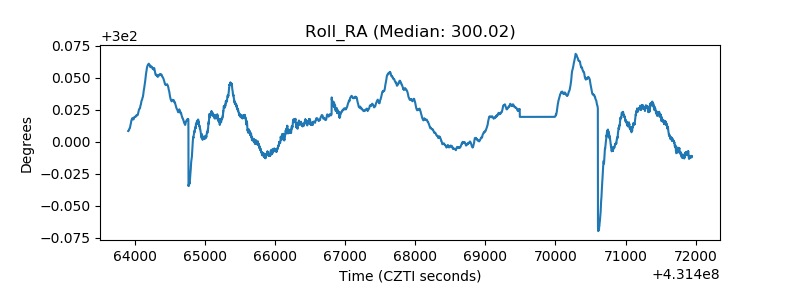 |
| Veto Counter | 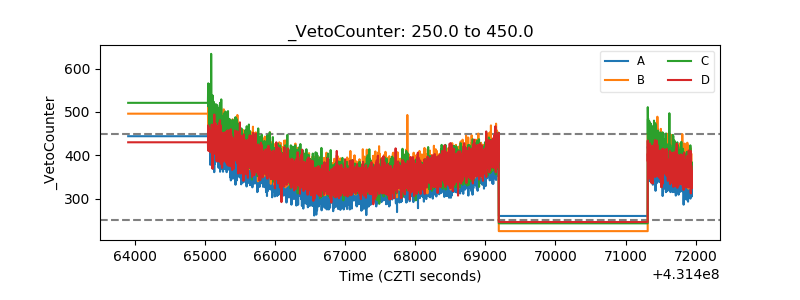 |