| Param | Original file | Final file |
|---|---|---|
| Filename | modeM0/AS1T05_143T01_9000005830_42897cztM0_level2.fits | modeM0/AS1T05_143T01_9000005830_42897cztM0_level2_quad_clean.evt |
| Size (bytes) | 336,928,320 | 81,722,880 |
| Size | 321.3 MB | 77.9 MB |
| Events in quadrant A | 2,807,139 | 547,042 |
| Events in quadrant B | 2,166,778 | 567,221 |
| Events in quadrant C | 3,940,072 | 515,180 |
| Events in quadrant D | 3,164,074 | 490,965 |
| Mode M0 | |||
|---|---|---|---|
| Quadrant | BADHDUFLAG | Total packets | Discarded packets |
| A | 0 | 11533 | 2 |
| B | 0 | 10276 | 2 |
| C | 0 | 15091 | 2 |
| D | 0 | 12960 | 2 |
| Mode M9 | |||
|---|---|---|---|
| Quadrant | BADHDUFLAG | Total packets | Discarded packets |
| A | 0 | 33 | 0 |
| B | 0 | 34 | 0 |
| C | 0 | 34 | 0 |
| D | 0 | 34 | 0 |
| Mode SS | |||
|---|---|---|---|
| Quadrant | BADHDUFLAG | Total packets | Discarded packets |
| A | 0 | 102 | 0 |
| B | 0 | 102 | 0 |
| C | 0 | 102 | 0 |
| D | 0 | 102 | 0 |
| Quadrant | Total seconds | Saturated seconds | Saturation percentage |
|---|---|---|---|
| A | 5055 | 69 | 1.364985% |
| B | 5055 | 9 | 0.178042% |
| C | 5055 | 328 | 6.488625% |
| D | 5054 | 156 | 3.086664% |
Noise dominated data is calculated using 1-second bins in cleaned event files. If a bin has >2000 counts, and if more than 50% of those come from <1% of pixels, then it is considered to be noise-dominated and hence unusable.
| Quadrant | # 1 sec bins | Bins with >0 counts | Bins with >2000 counts | High rate bins dominated by noise | Noise dominated (total time) | Noise dominated (detector-on time) | Marked lightcurve |
|---|---|---|---|---|---|---|---|
| A | 7027 | 5056 | 42 | 42 | 0.60% | 0.83% | 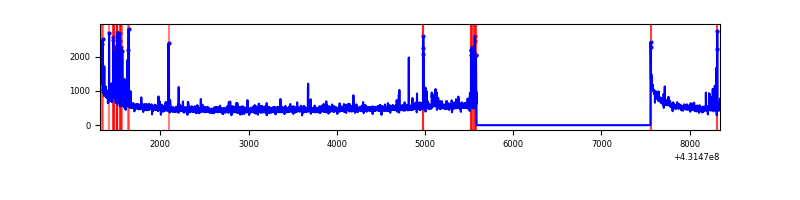 |
| B | 7027 | 5056 | 3 | 3 | 0.04% | 0.06% | 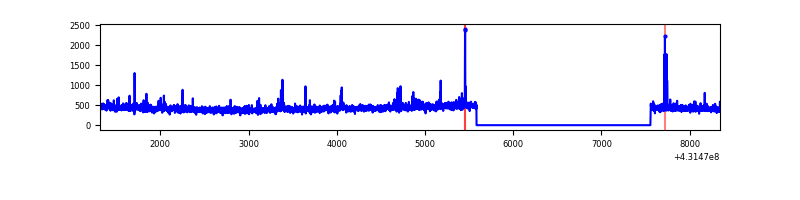 |
| C | 7027 | 5056 | 353 | 353 | 5.02% | 6.98% | 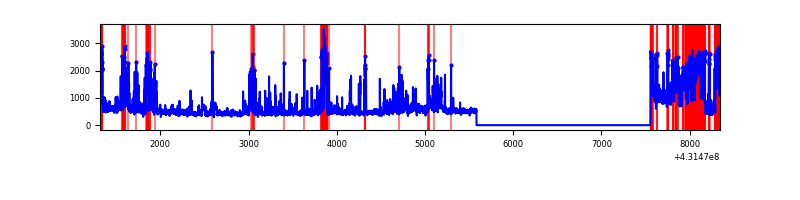 |
| D | 7025 | 5054 | 153 | 153 | 2.18% | 3.03% | 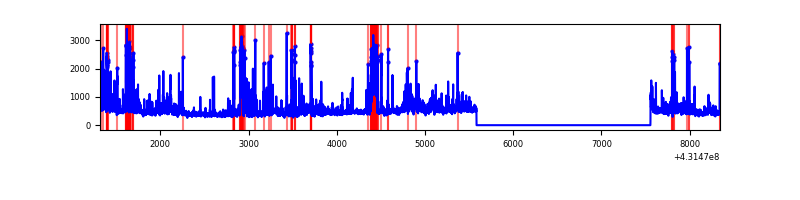 |
Top three noisy pixels from each quadrant. If the there are fewer than three noisy pixels in the level2.evt file, extra rows are filled as -1
| Pixel properties | Quadrant properties | ||||||
|---|---|---|---|---|---|---|---|
| Quadrant | DetID | PixID | Counts | Sigma | Mean | Median | Sigma |
| A | 10 | 83 | 537642 | 4957.11 | 524 | 512 | 108.4 |
| A | 15 | 237 | 164577 | 1514.14 | 524 | 512 | 108.4 |
| A | 13 | 248 | 30526 | 277.0 | 524 | 512 | 108.4 |
| B | 3 | 112 | 25213 | 246.37 | 524 | 509 | 100.3 |
| B | 5 | 255 | 21807 | 212.4 | 524 | 509 | 100.3 |
| B | 0 | 229 | 17267 | 167.12 | 524 | 509 | 100.3 |
| C | 5 | 250 | 799626 | 6728.49 | 505 | 508 | 118.8 |
| C | 12 | 2 | 454118 | 3819.35 | 505 | 508 | 118.8 |
| C | 5 | 233 | 239392 | 2011.38 | 505 | 508 | 118.8 |
| D | 1 | 52 | 695466 | 5530.08 | 507 | 490 | 125.7 |
| D | 12 | 6 | 286988 | 2279.73 | 507 | 490 | 125.7 |
| D | 13 | 249 | 116269 | 921.28 | 507 | 490 | 125.7 |
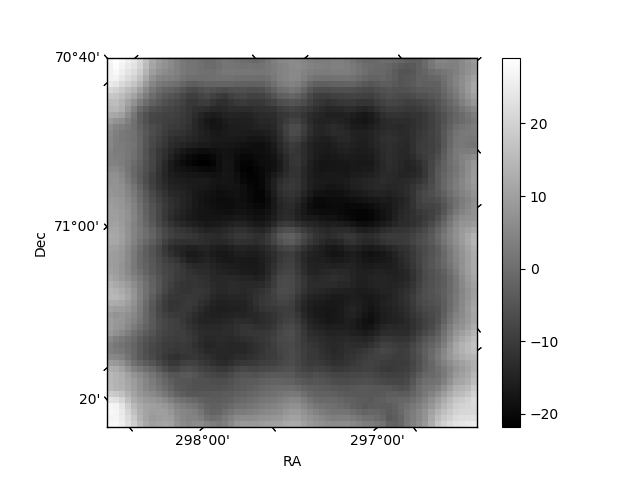
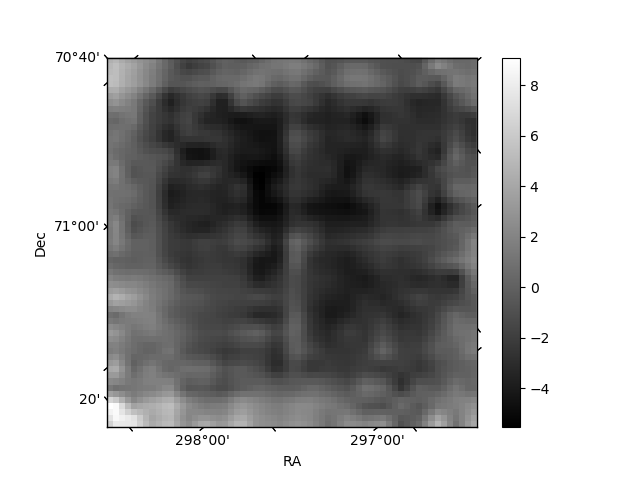
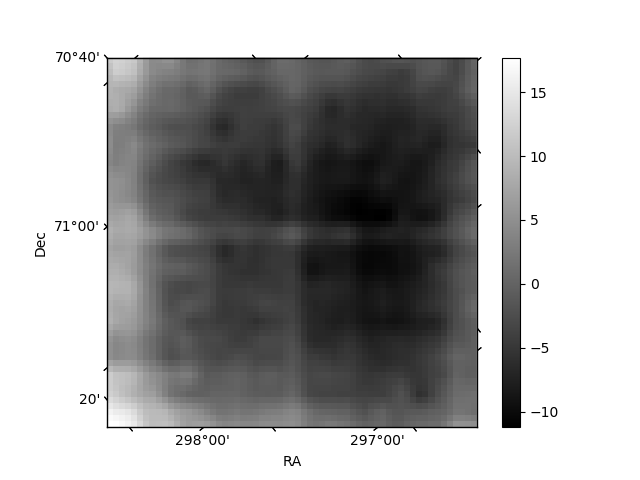
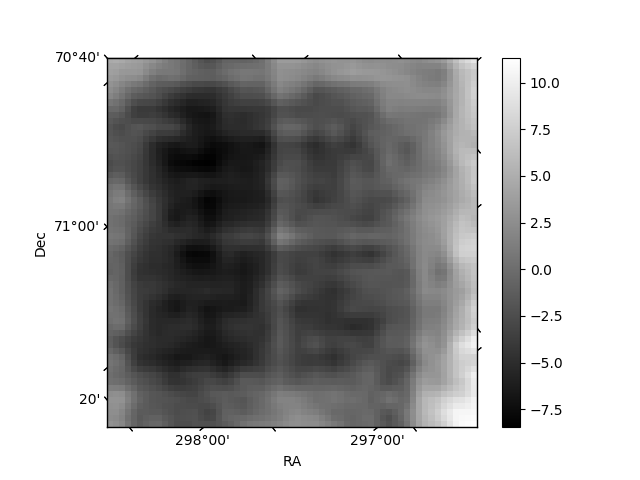
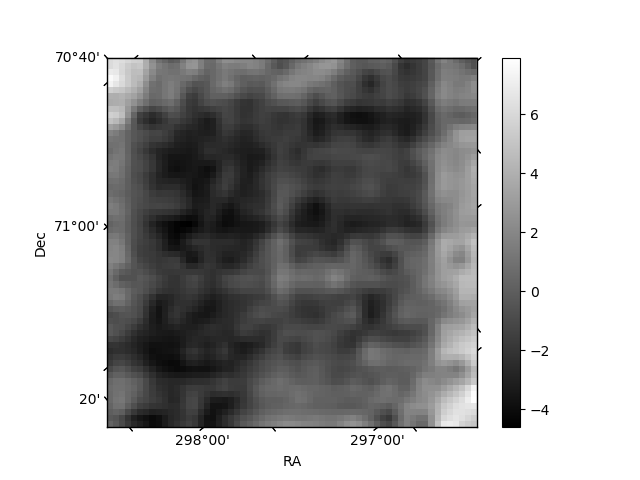
Histogram calculated using DETX and DETY for each event in the final _common_clean file
| Quadrant A | 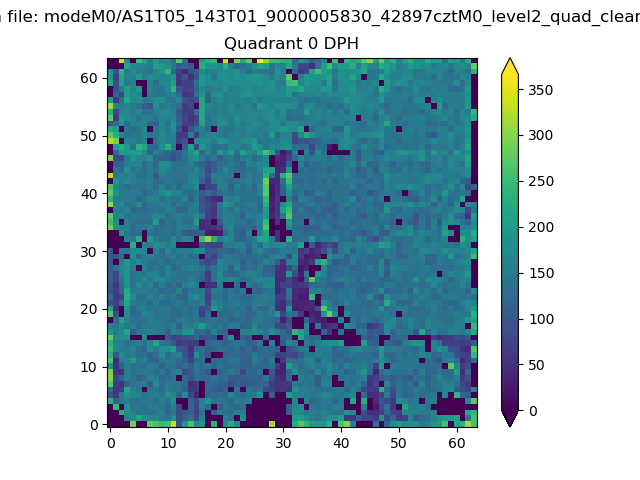 |
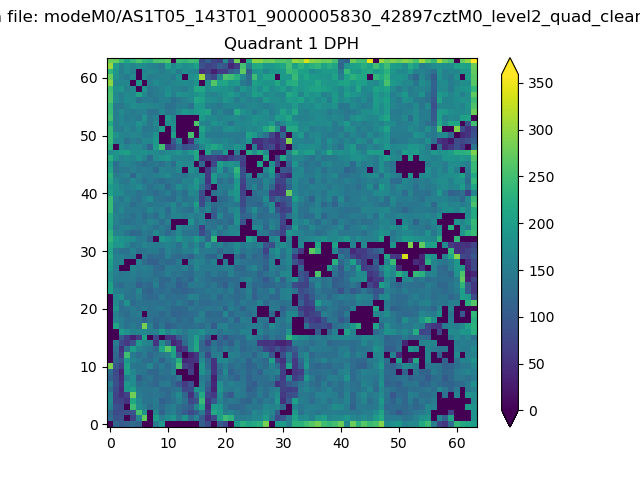 |
Quadrant B |
|---|---|---|---|
| Quadrant D | 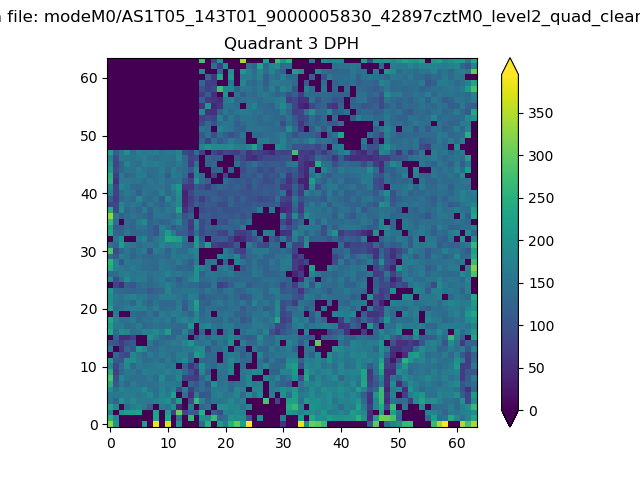 |
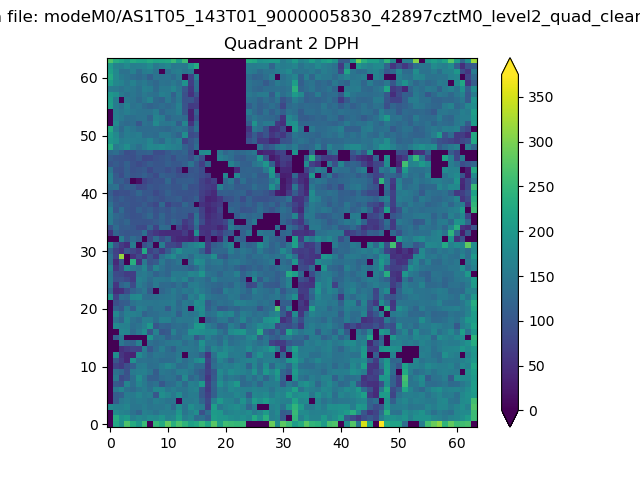 |
Quadrant C |
| Plot type | Count rate plots | Images |
|---|---|---|
| Comparison with Poisson distribution Blue bars denote a histogram of data divided into 1 sec bins. Red curve is a Poisson curve with rate = median count rate of data. |
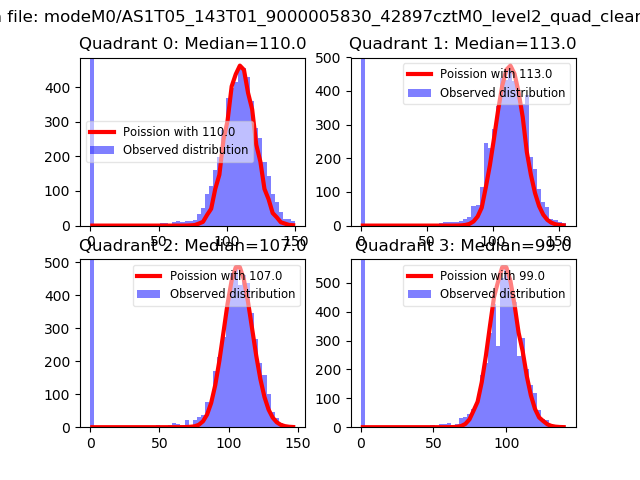 |
 |
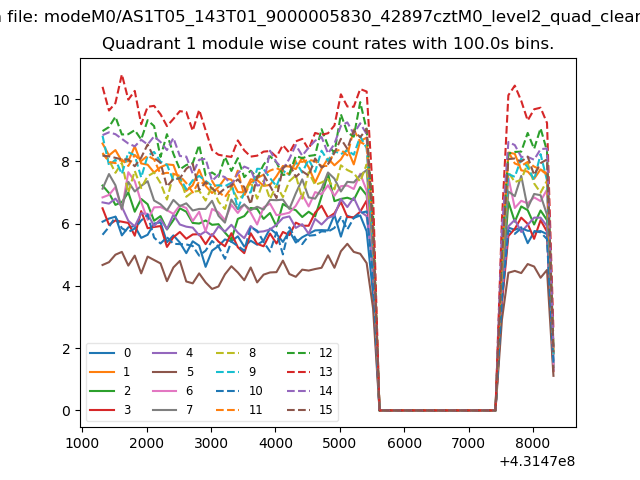
| Quadrant-wise count rates Data is divided into 100 sec bins |
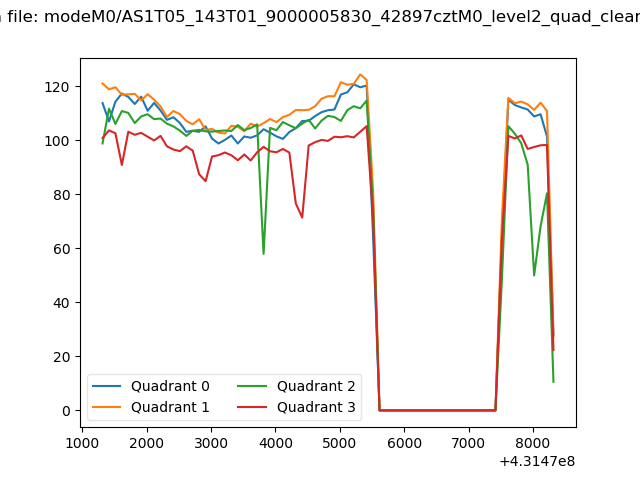 |
|
| Module-wise count rates for Quadrant A Data is divided into 100 sec bins |
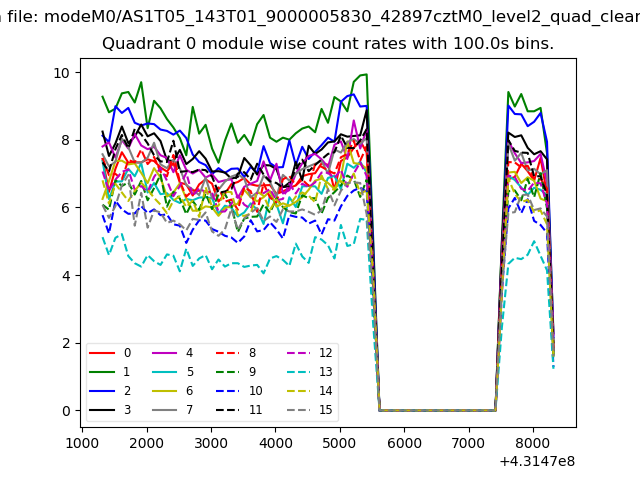 |
 |
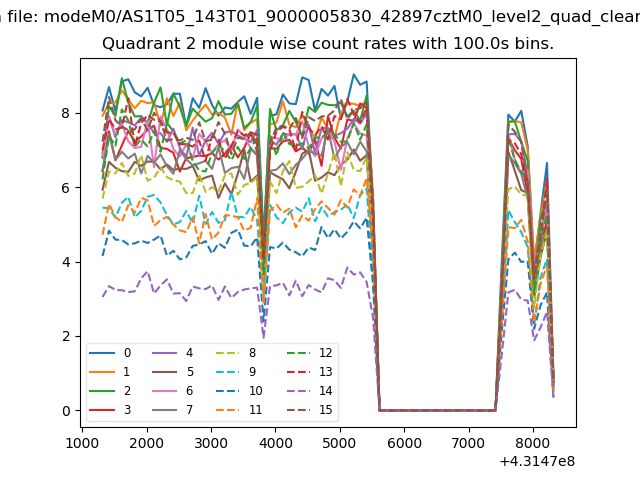
| Module-wise count rates for Quadrant B Data is divided into 100 sec bins |
 |
 |
| Module-wise count rates for Quadrant C Data is divided into 100 sec bins |
 |
 |
| Module-wise count rates for Quadrant D Data is divided into 100 sec bins |
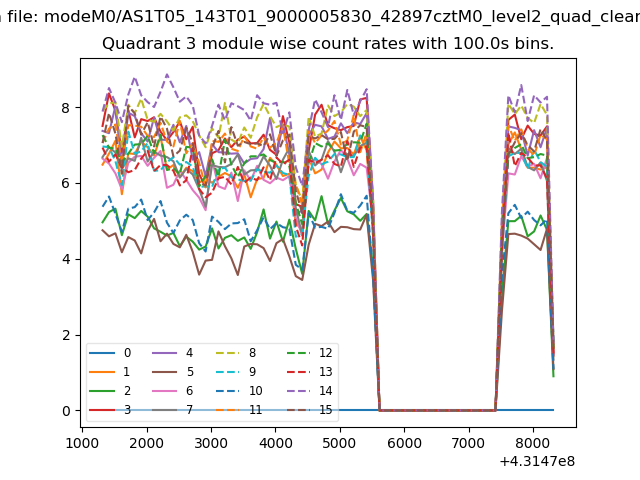 |
 |
| Parameter | Plot |
|---|---|
| CZT HV Monitor | 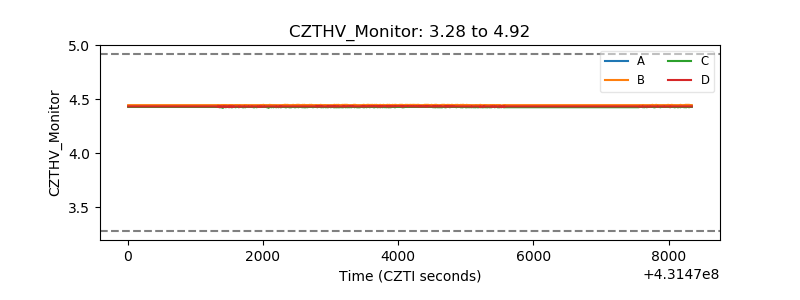 |
| D_VDD | 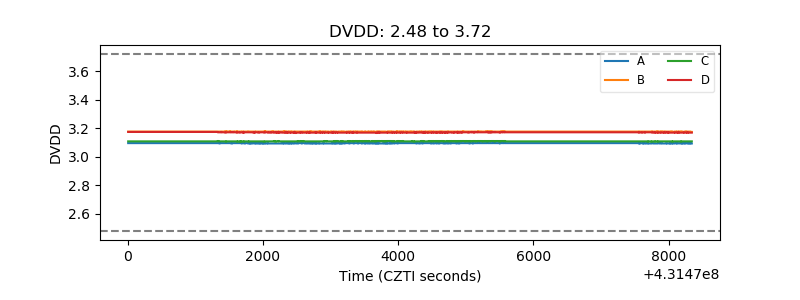 |
| Temperature 1 | 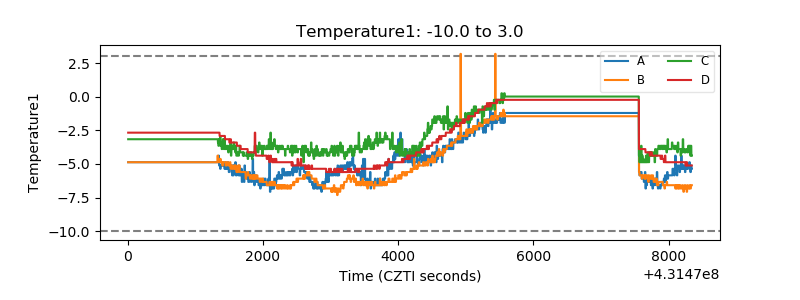 |
| Veto HV Monitor | 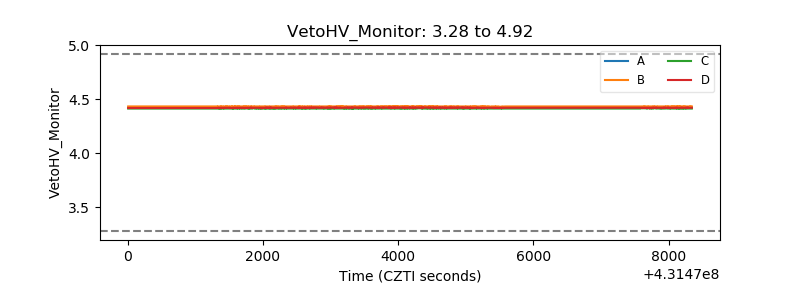 |
| Veto LLD | 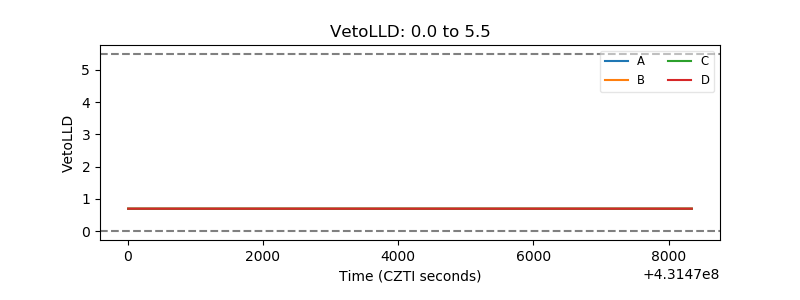 |
| Alpha Counter | 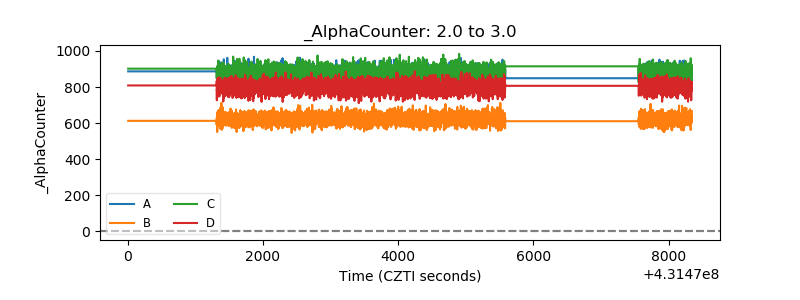 |
| _CPM_Rate | 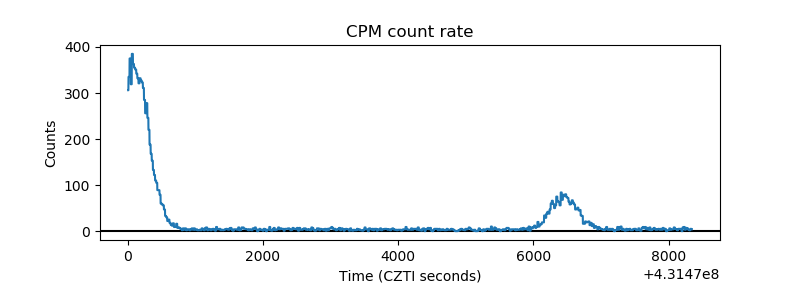 |
| CZT Counter | 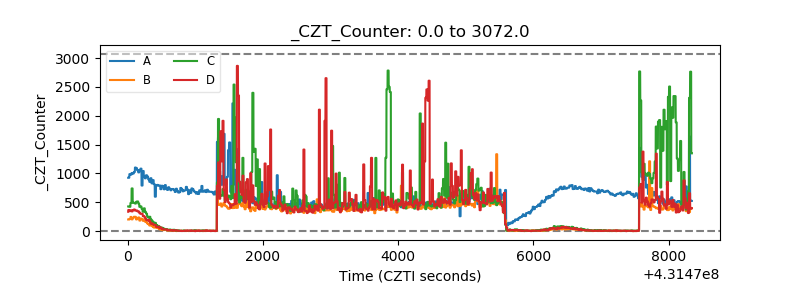 |
| +2.5 Volts monitor | 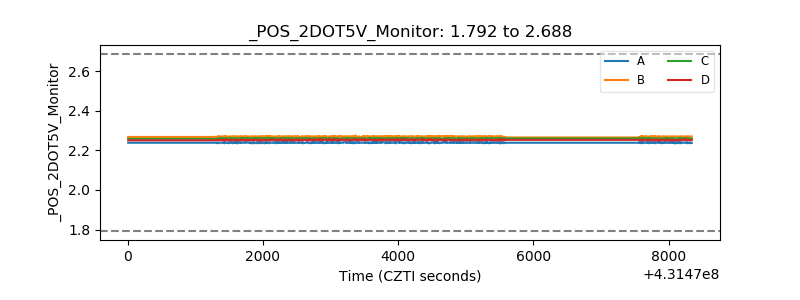 |
| +5 Volts monitor | 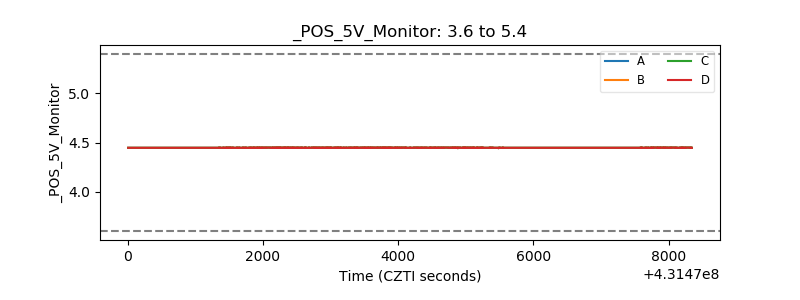 |
| _ROLL_ROT | 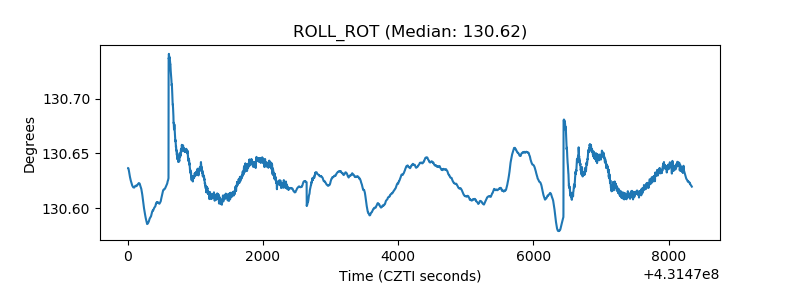 |
| _Roll_DEC | 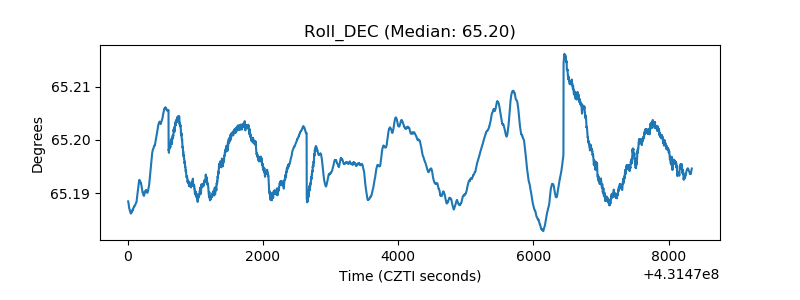 |
| _Roll_RA | 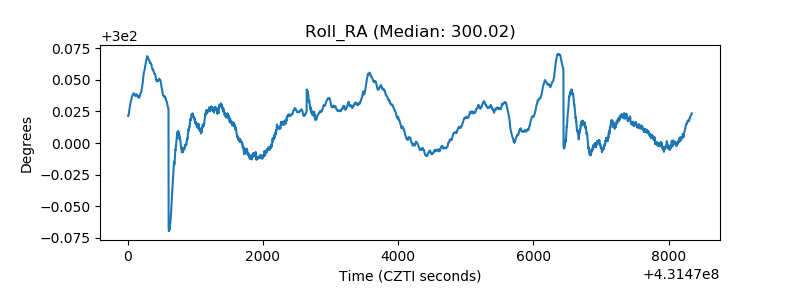 |
| Veto Counter | 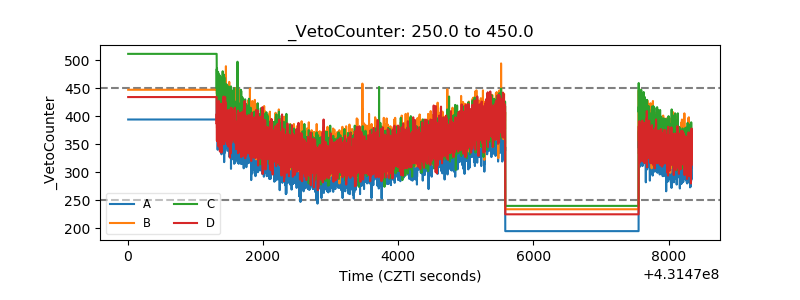 |