| Param | Original file | Final file |
|---|---|---|
| Filename | modeM0/AS1T05_143T01_9000005830_42898cztM0_level2.fits | modeM0/AS1T05_143T01_9000005830_42898cztM0_level2_quad_clean.evt |
| Size (bytes) | 405,676,800 | 83,782,080 |
| Size | 386.9 MB | 79.9 MB |
| Events in quadrant A | 2,999,505 | 570,126 |
| Events in quadrant B | 2,377,066 | 594,142 |
| Events in quadrant C | 5,493,011 | 487,802 |
| Events in quadrant D | 3,727,741 | 507,543 |
| Mode M0 | |||
|---|---|---|---|
| Quadrant | BADHDUFLAG | Total packets | Discarded packets |
| A | 0 | 12375 | 2 |
| B | 0 | 11129 | 2 |
| C | 0 | 19818 | 2 |
| D | 0 | 14931 | 2 |
| Mode M9 | |||
|---|---|---|---|
| Quadrant | BADHDUFLAG | Total packets | Discarded packets |
| A | 0 | 30 | 0 |
| B | 0 | 31 | 0 |
| C | 0 | 31 | 0 |
| D | 0 | 31 | 0 |
| Mode SS | |||
|---|---|---|---|
| Quadrant | BADHDUFLAG | Total packets | Discarded packets |
| A | 0 | 108 | 0 |
| B | 0 | 108 | 0 |
| C | 0 | 108 | 0 |
| D | 0 | 108 | 0 |
| Quadrant | Total seconds | Saturated seconds | Saturation percentage |
|---|---|---|---|
| A | 5393 | 98 | 1.817170% |
| B | 5393 | 7 | 0.129798% |
| C | 5393 | 851 | 15.779714% |
| D | 5393 | 244 | 4.524383% |
Noise dominated data is calculated using 1-second bins in cleaned event files. If a bin has >2000 counts, and if more than 50% of those come from <1% of pixels, then it is considered to be noise-dominated and hence unusable.
| Quadrant | # 1 sec bins | Bins with >0 counts | Bins with >2000 counts | High rate bins dominated by noise | Noise dominated (total time) | Noise dominated (detector-on time) | Marked lightcurve |
|---|---|---|---|---|---|---|---|
| A | 7035 | 5394 | 49 | 49 | 0.70% | 0.91% | 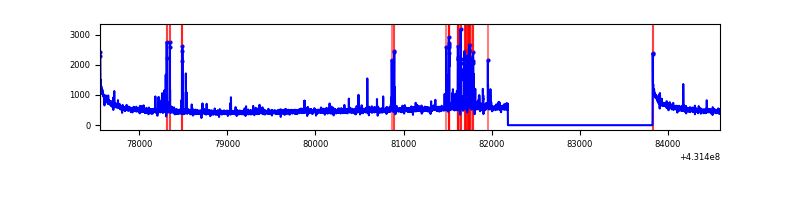 |
| B | 7035 | 5394 | 4 | 4 | 0.06% | 0.07% | 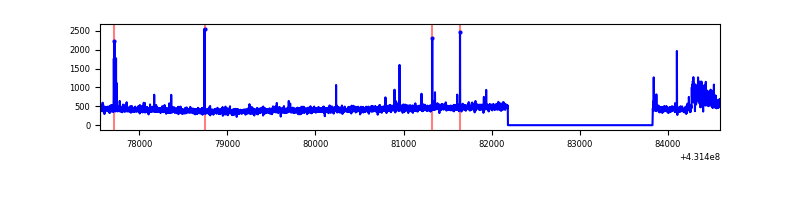 |
| C | 7035 | 5393 | 888 | 888 | 12.62% | 16.47% | 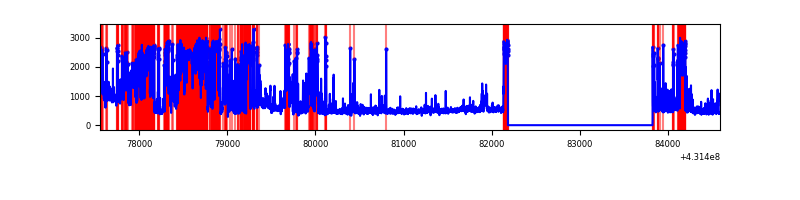 |
| D | 7035 | 5394 | 264 | 264 | 3.75% | 4.89% | 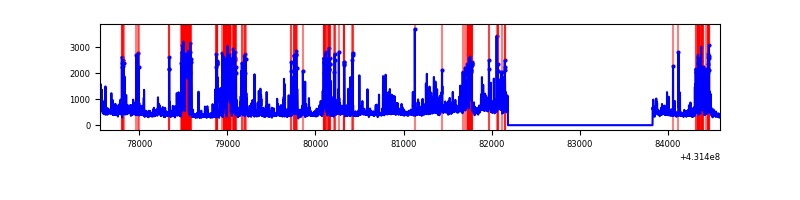 |
Top three noisy pixels from each quadrant. If the there are fewer than three noisy pixels in the level2.evt file, extra rows are filled as -1
| Pixel properties | Quadrant properties | ||||||
|---|---|---|---|---|---|---|---|
| Quadrant | DetID | PixID | Counts | Sigma | Mean | Median | Sigma |
| A | 10 | 83 | 567952 | 4917.11 | 560 | 549 | 115.4 |
| A | 15 | 237 | 226846 | 1961.09 | 560 | 549 | 115.4 |
| A | 2 | 79 | 26662 | 226.3 | 560 | 549 | 115.4 |
| B | 0 | 229 | 106574 | 958.24 | 566 | 549 | 110.6 |
| B | 3 | 112 | 16423 | 143.47 | 566 | 549 | 110.6 |
| B | 12 | 111 | 13913 | 120.78 | 566 | 549 | 110.6 |
| C | 12 | 2 | 1332973 | 11056.0 | 510 | 513 | 120.5 |
| C | 5 | 250 | 1047153 | 8684.43 | 510 | 513 | 120.5 |
| C | 5 | 233 | 385106 | 3191.13 | 510 | 513 | 120.5 |
| D | 12 | 6 | 762668 | 5756.71 | 541 | 524 | 132.4 |
| D | 1 | 52 | 535750 | 4042.73 | 541 | 524 | 132.4 |
| D | 2 | 249 | 218517 | 1646.57 | 541 | 524 | 132.4 |
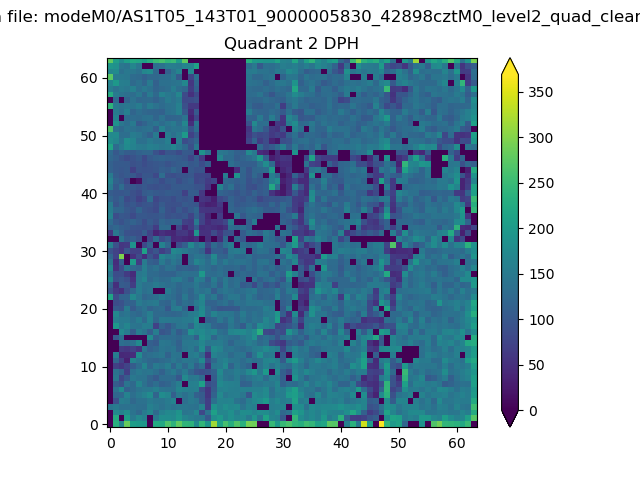
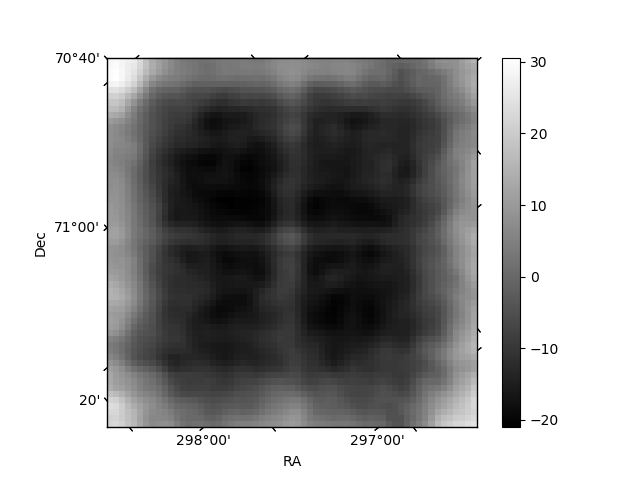
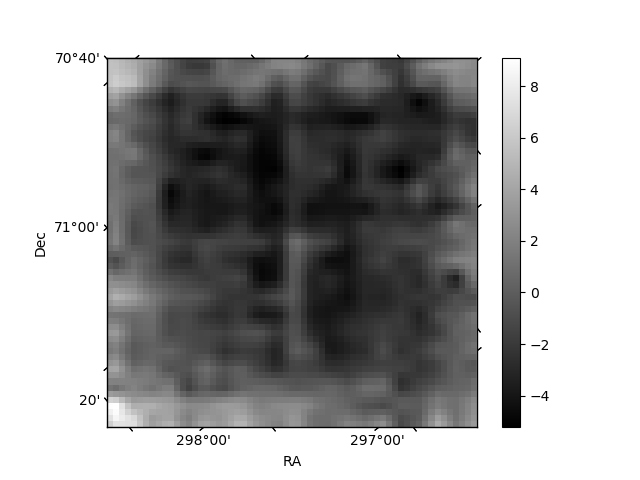
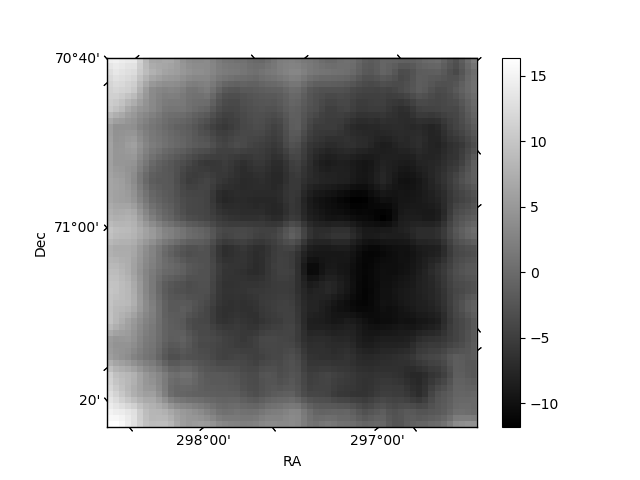
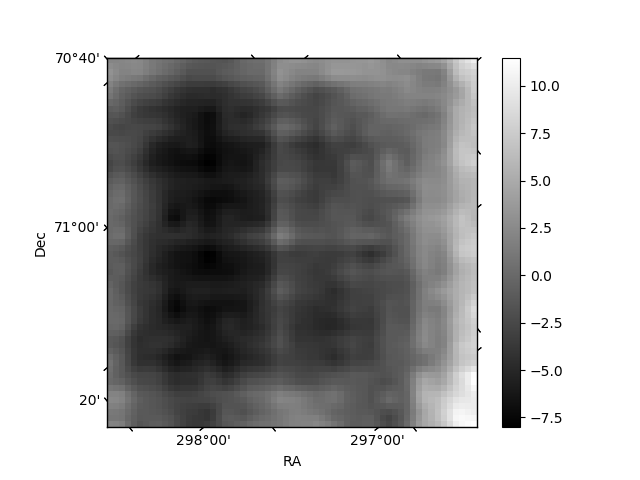
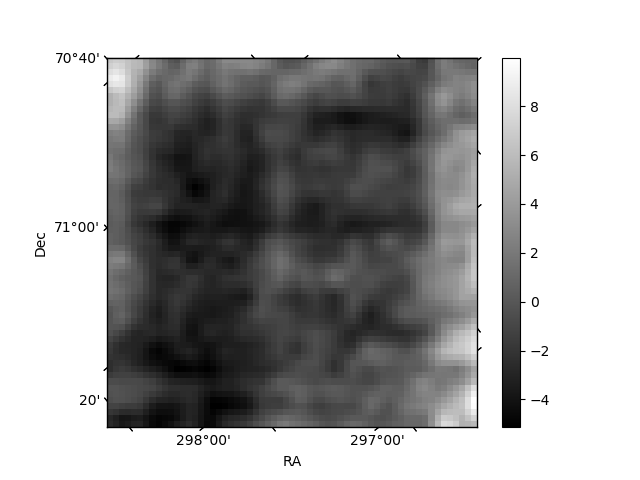
Histogram calculated using DETX and DETY for each event in the final _common_clean file
| Quadrant A | 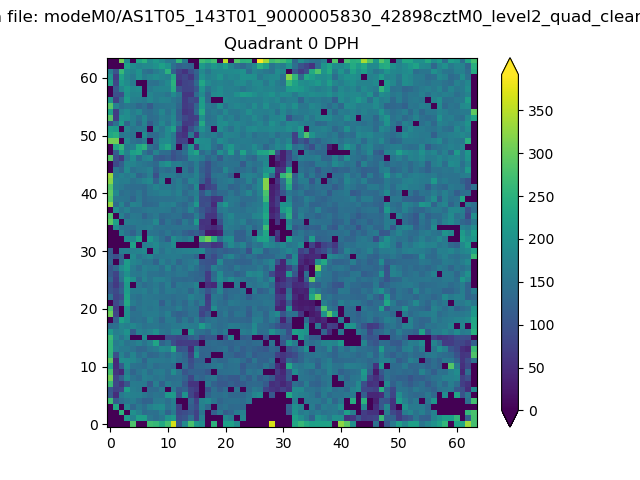 |
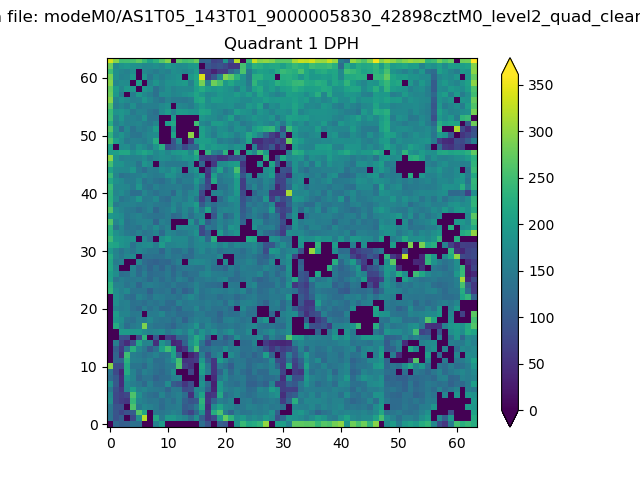 |
Quadrant B |
|---|---|---|---|
| Quadrant D | 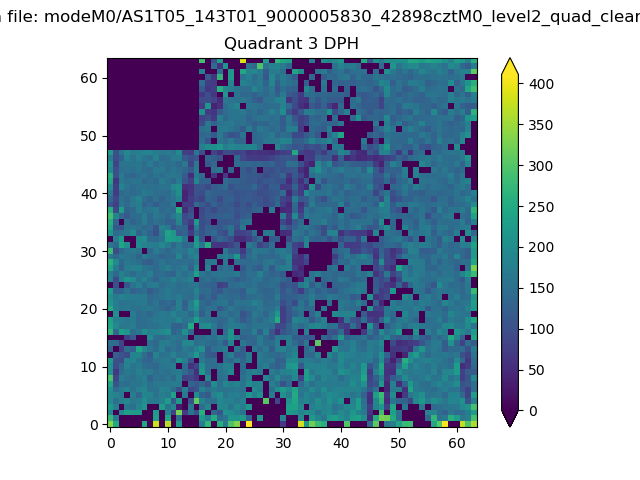 |
 |
Quadrant C |
| Plot type | Count rate plots | Images |
|---|---|---|
| Comparison with Poisson distribution Blue bars denote a histogram of data divided into 1 sec bins. Red curve is a Poisson curve with rate = median count rate of data. |
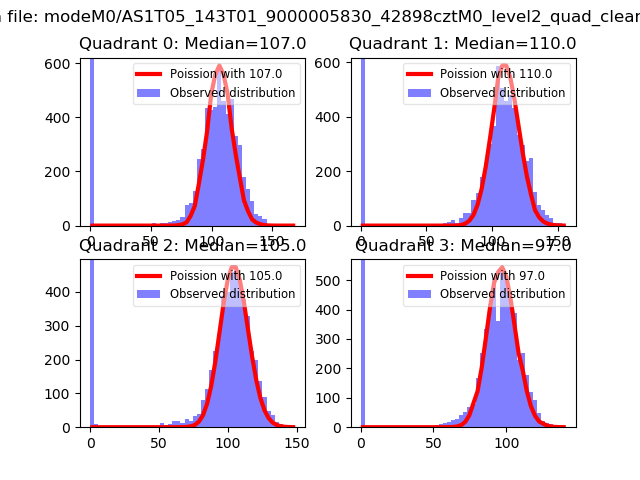 |
 |
| Quadrant-wise count rates Data is divided into 100 sec bins |
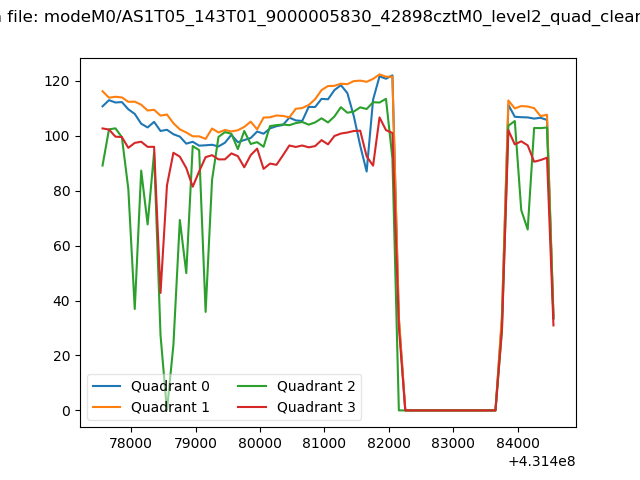 |
|
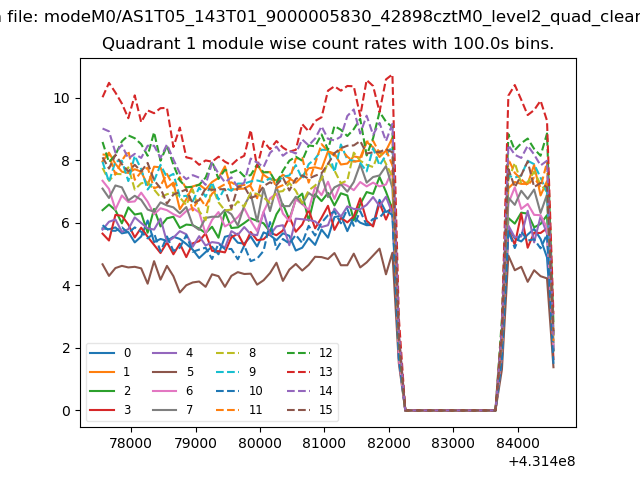
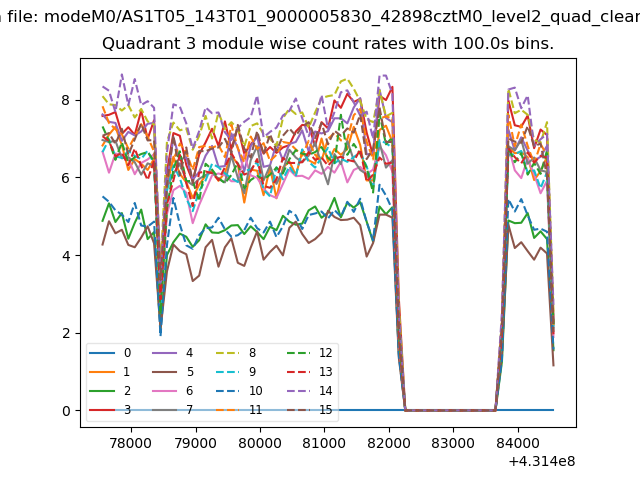
| Module-wise count rates for Quadrant A Data is divided into 100 sec bins |
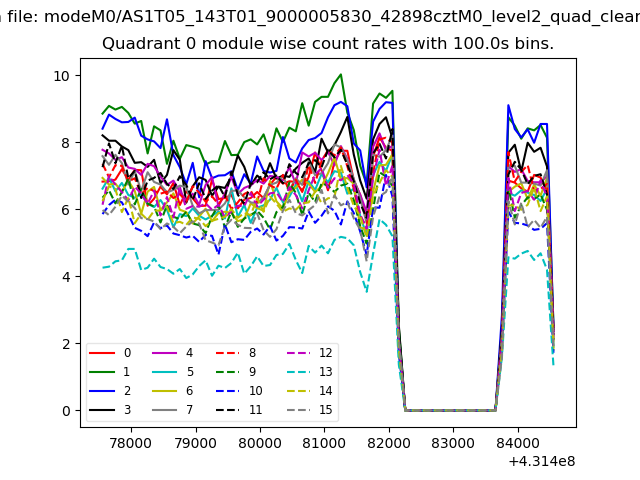 |
 |
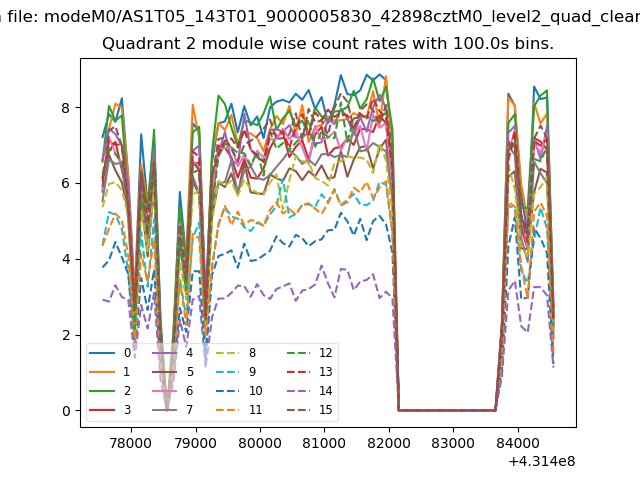
| Module-wise count rates for Quadrant B Data is divided into 100 sec bins |
 |
 |
| Module-wise count rates for Quadrant C Data is divided into 100 sec bins |
 |
 |
| Module-wise count rates for Quadrant D Data is divided into 100 sec bins |
 |
 |
| Parameter | Plot |
|---|---|
| CZT HV Monitor | 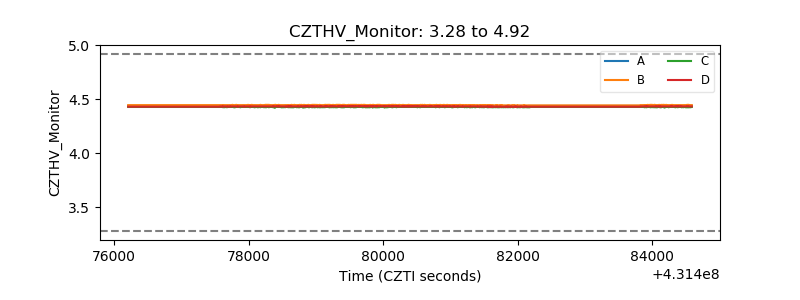 |
| D_VDD | 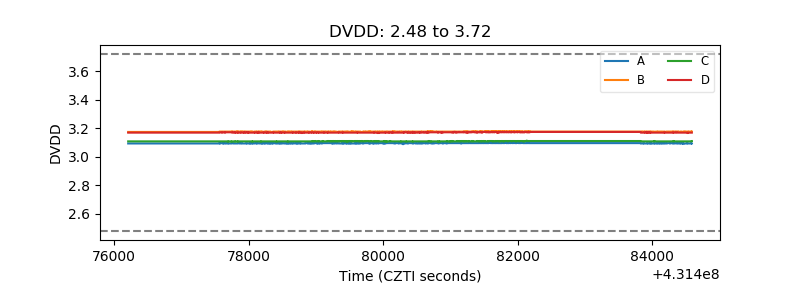 |
| Temperature 1 | 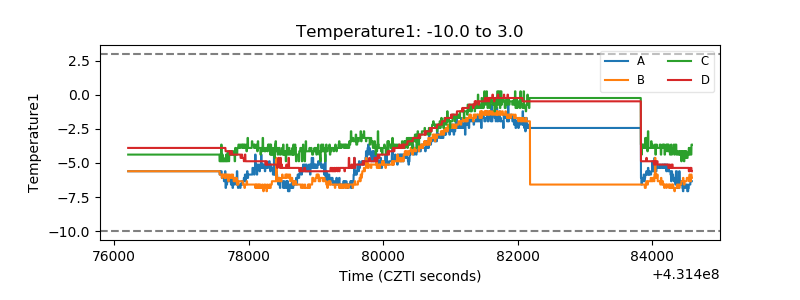 |
| Veto HV Monitor |  |
| Veto LLD | 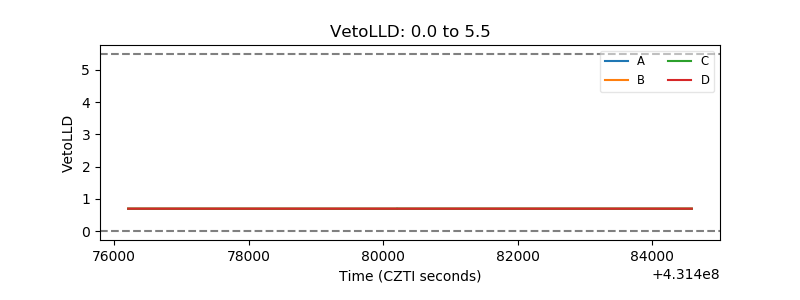 |
| Alpha Counter | 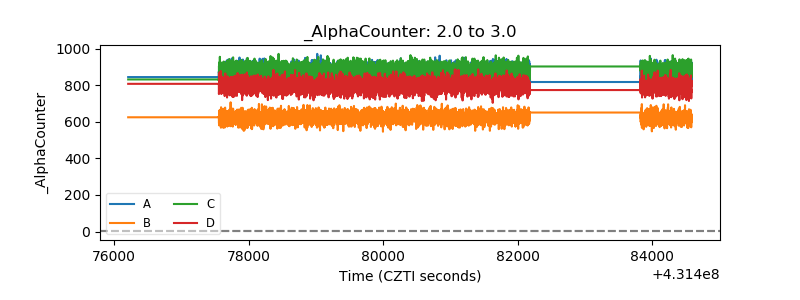 |
| _CPM_Rate | 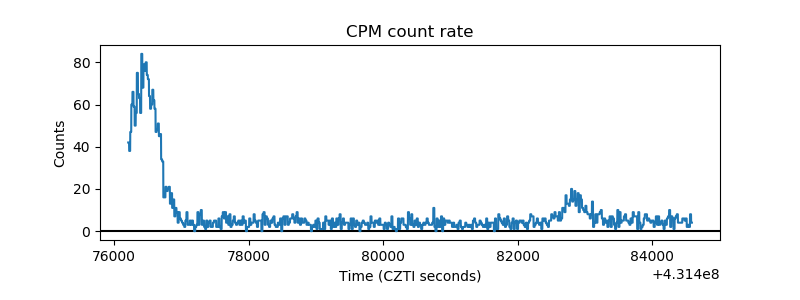 |
| CZT Counter | 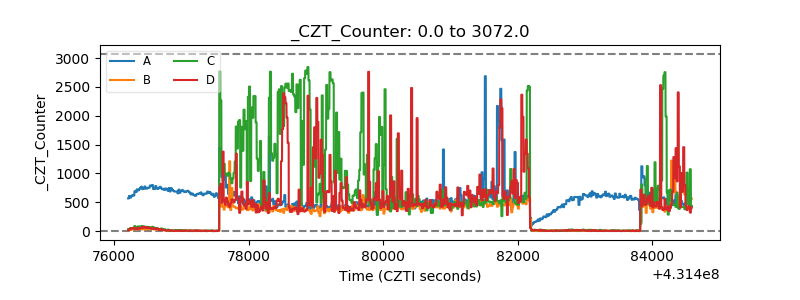 |
| +2.5 Volts monitor | 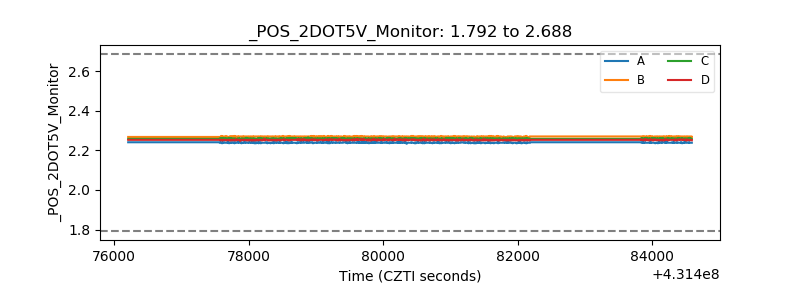 |
| +5 Volts monitor | 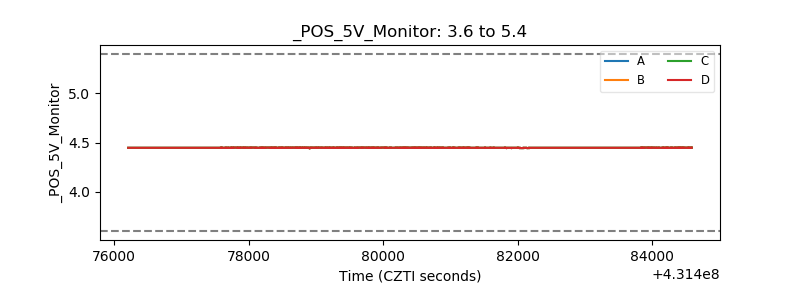 |
| _ROLL_ROT | 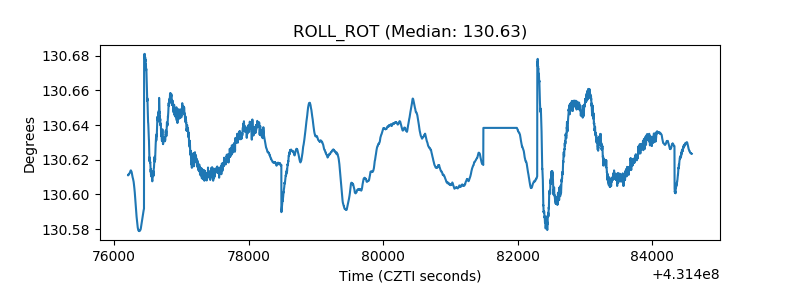 |
| _Roll_DEC | 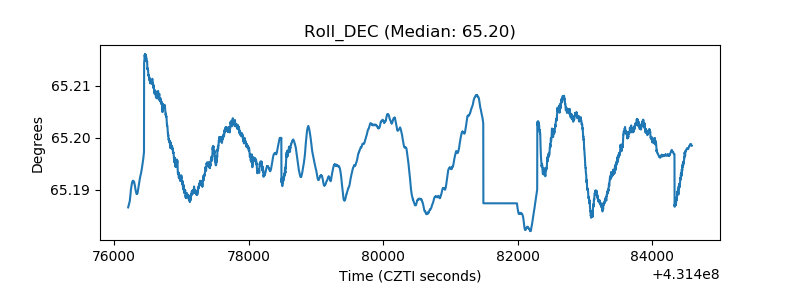 |
| _Roll_RA | 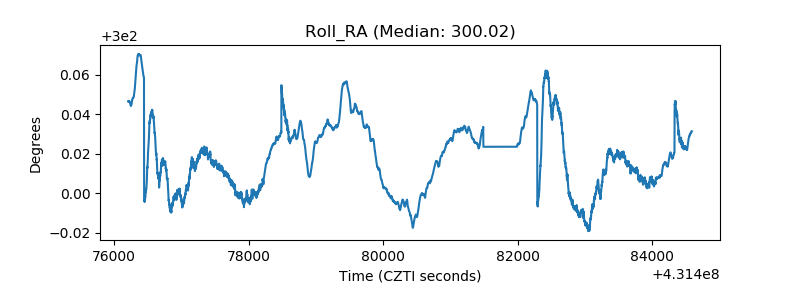 |
| Veto Counter | 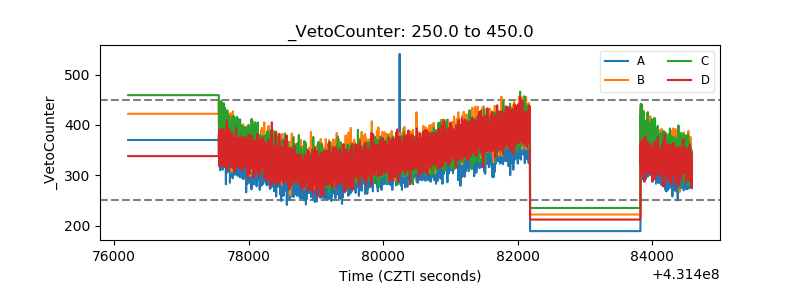 |