| Param | Original file | Final file |
|---|---|---|
| Filename | modeM0/AS1T05_143T01_9000005830_42899cztM0_level2.fits | modeM0/AS1T05_143T01_9000005830_42899cztM0_level2_quad_clean.evt |
| Size (bytes) | 434,249,280 | 94,389,120 |
| Size | 414.1 MB | 90.0 MB |
| Events in quadrant A | 3,400,531 | 637,149 |
| Events in quadrant B | 2,941,558 | 659,140 |
| Events in quadrant C | 4,884,125 | 583,212 |
| Events in quadrant D | 4,381,379 | 558,396 |
| Mode M0 | |||
|---|---|---|---|
| Quadrant | BADHDUFLAG | Total packets | Discarded packets |
| A | 0 | 13874 | 2 |
| B | 0 | 12912 | 3 |
| C | 0 | 18441 | 2 |
| D | 0 | 17299 | 2 |
| Mode M9 | |||
|---|---|---|---|
| Quadrant | BADHDUFLAG | Total packets | Discarded packets |
| A | 0 | 30 | 0 |
| B | 0 | 30 | 0 |
| C | 0 | 30 | 0 |
| D | 0 | 30 | 0 |
| Mode SS | |||
|---|---|---|---|
| Quadrant | BADHDUFLAG | Total packets | Discarded packets |
| A | 0 | 126 | 0 |
| B | 0 | 126 | 0 |
| C | 0 | 126 | 0 |
| D | 0 | 126 | 0 |
| Quadrant | Total seconds | Saturated seconds | Saturation percentage |
|---|---|---|---|
| A | 6005 | 84 | 1.398834% |
| B | 6005 | 7 | 0.116570% |
| C | 6005 | 516 | 8.592839% |
| D | 6005 | 335 | 5.578684% |
Noise dominated data is calculated using 1-second bins in cleaned event files. If a bin has >2000 counts, and if more than 50% of those come from <1% of pixels, then it is considered to be noise-dominated and hence unusable.
| Quadrant | # 1 sec bins | Bins with >0 counts | Bins with >2000 counts | High rate bins dominated by noise | Noise dominated (total time) | Noise dominated (detector-on time) | Marked lightcurve |
|---|---|---|---|---|---|---|---|
| A | 9020 | 6007 | 59 | 59 | 0.65% | 0.98% | 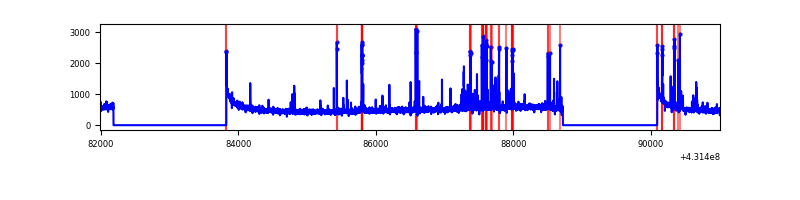 |
| B | 9020 | 6007 | 1 | 1 | 0.01% | 0.02% | 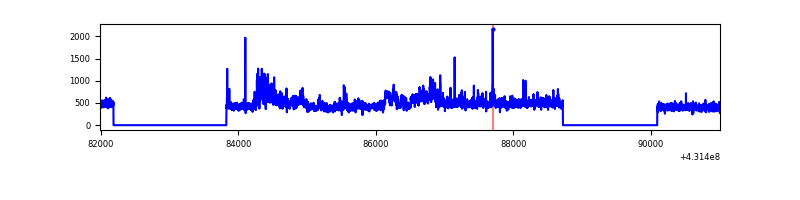 |
| C | 9020 | 6006 | 506 | 506 | 5.61% | 8.42% | 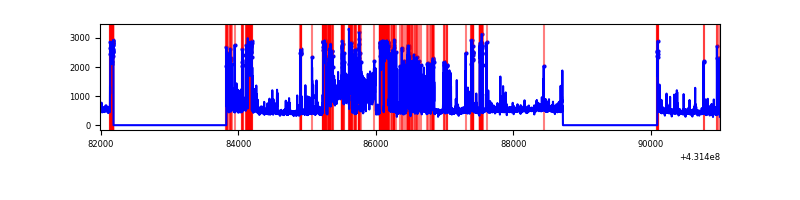 |
| D | 9020 | 6006 | 318 | 318 | 3.53% | 5.29% | 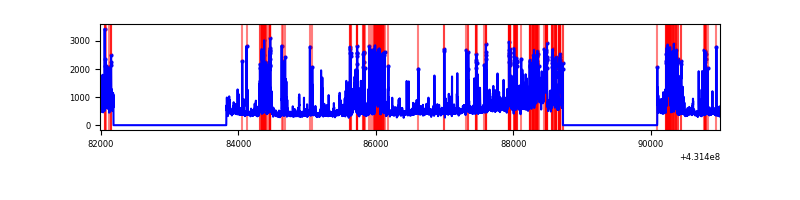 |
Top three noisy pixels from each quadrant. If the there are fewer than three noisy pixels in the level2.evt file, extra rows are filled as -1
| Pixel properties | Quadrant properties | ||||||
|---|---|---|---|---|---|---|---|
| Quadrant | DetID | PixID | Counts | Sigma | Mean | Median | Sigma |
| A | 10 | 83 | 635901 | 4801.07 | 637 | 623 | 132.3 |
| A | 15 | 237 | 246065 | 1854.91 | 637 | 623 | 132.3 |
| A | 2 | 79 | 41470 | 308.7 | 637 | 623 | 132.3 |
| B | 0 | 229 | 363408 | 2888.77 | 639 | 619 | 125.6 |
| B | 0 | 230 | 29448 | 229.56 | 639 | 619 | 125.6 |
| B | 0 | 245 | 16474 | 126.25 | 639 | 619 | 125.6 |
| C | 5 | 250 | 892960 | 6354.79 | 598 | 603 | 140.4 |
| C | 12 | 2 | 606479 | 4314.65 | 598 | 603 | 140.4 |
| C | 14 | 254 | 534604 | 3802.81 | 598 | 603 | 140.4 |
| D | 12 | 6 | 618586 | 4120.88 | 610 | 592 | 150.0 |
| D | 1 | 52 | 542571 | 3614.0 | 610 | 592 | 150.0 |
| D | 2 | 249 | 268352 | 1785.47 | 610 | 592 | 150.0 |
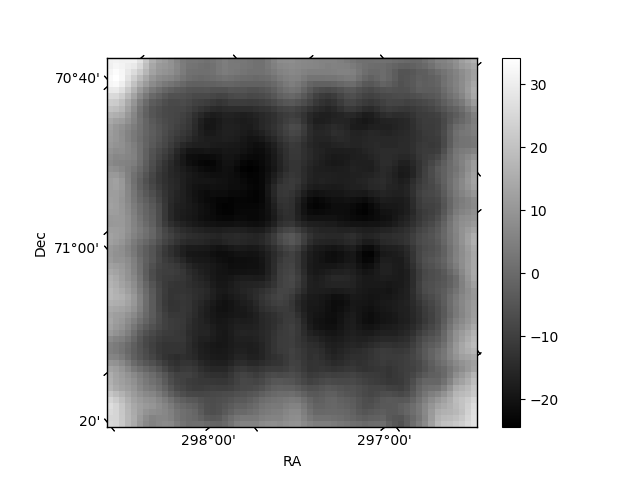
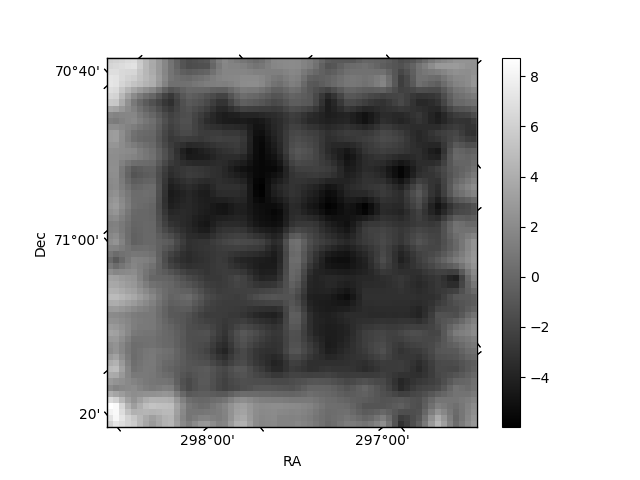
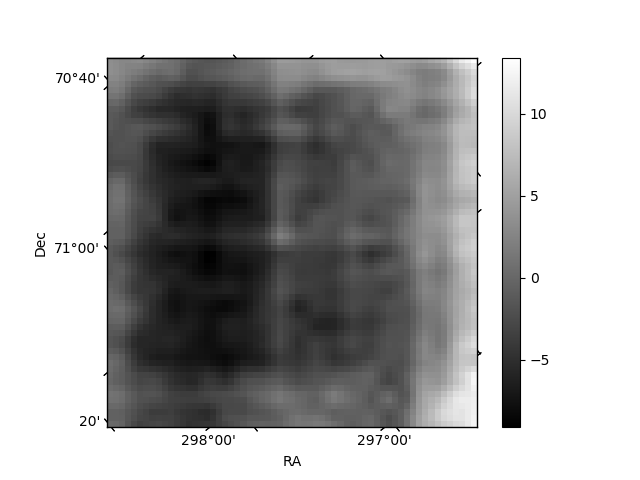
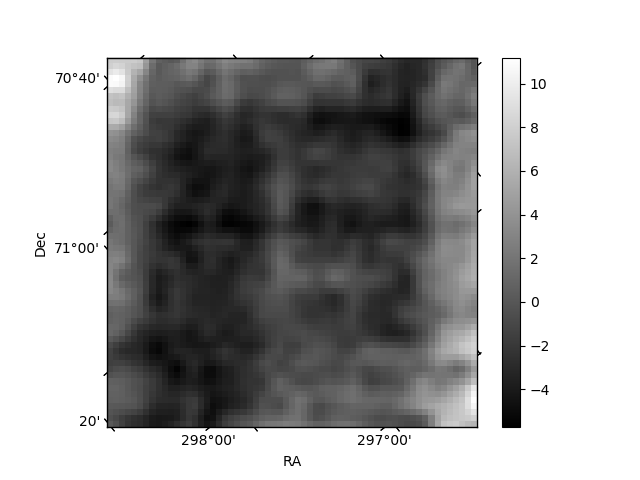
Histogram calculated using DETX and DETY for each event in the final _common_clean file
| Quadrant A | 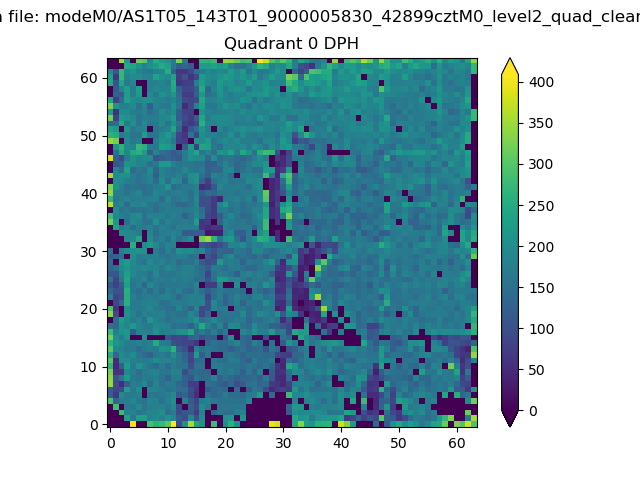 |
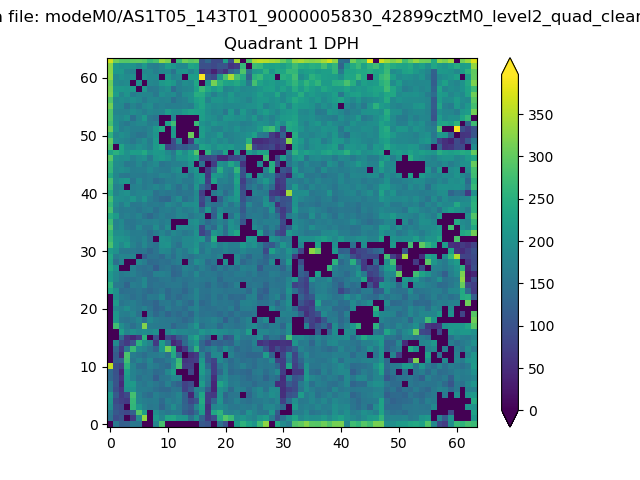 |
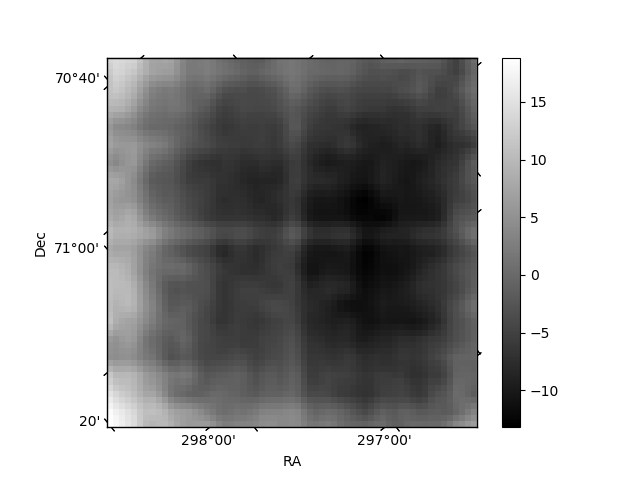
Quadrant B |
|---|---|---|---|
| Quadrant D | 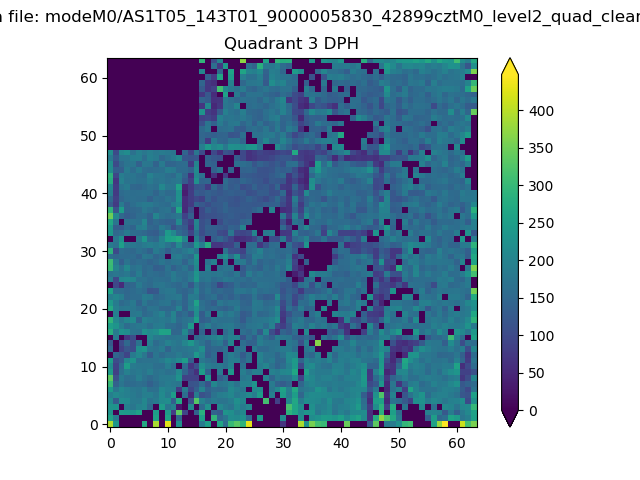 |
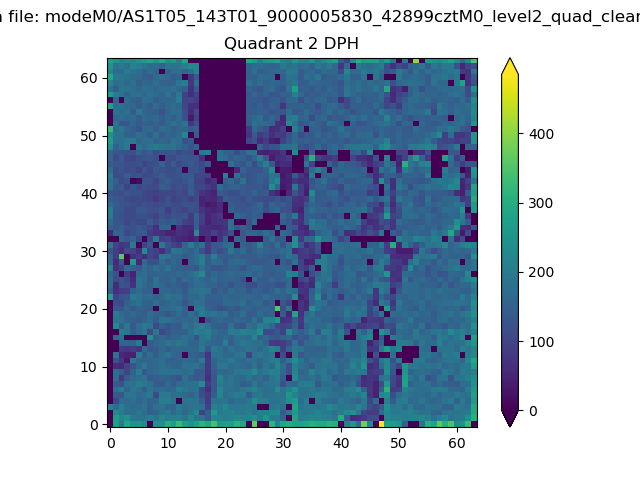 |
Quadrant C |
| Plot type | Count rate plots | Images |
|---|---|---|
| Comparison with Poisson distribution Blue bars denote a histogram of data divided into 1 sec bins. Red curve is a Poisson curve with rate = median count rate of data. |
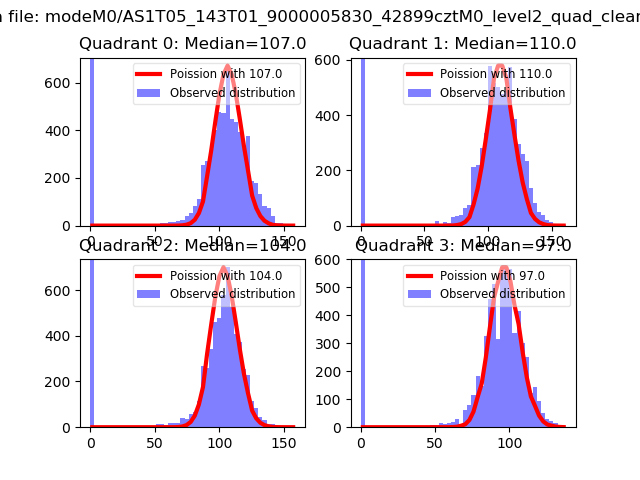 |
 |
| Quadrant-wise count rates Data is divided into 100 sec bins |
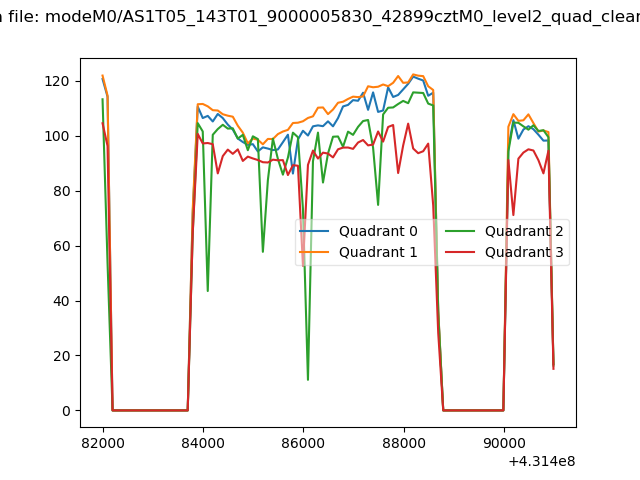 |
|
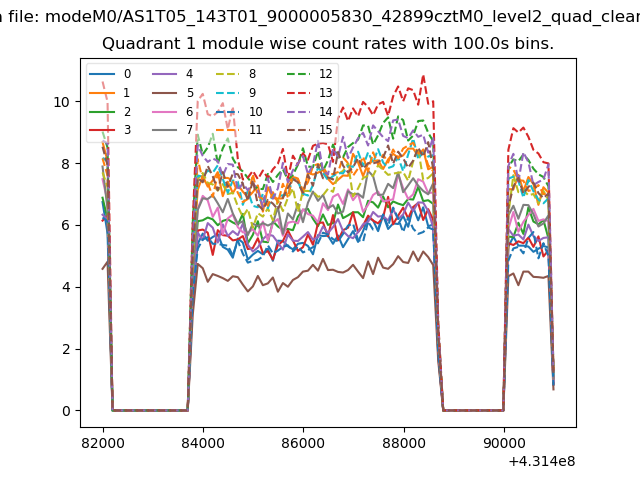
| Module-wise count rates for Quadrant A Data is divided into 100 sec bins |
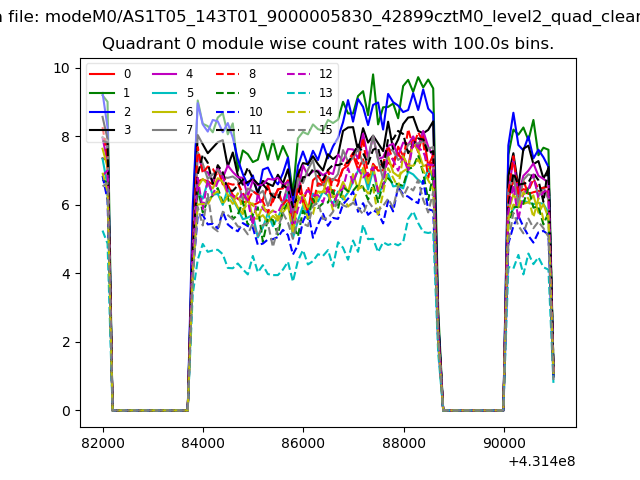 |
 |
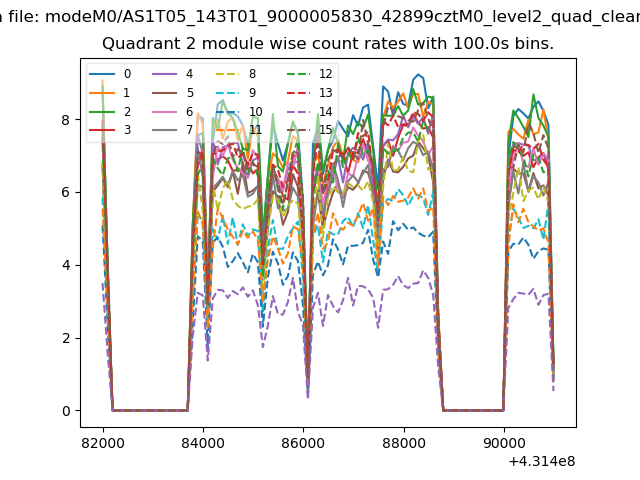
| Module-wise count rates for Quadrant B Data is divided into 100 sec bins |
 |
 |
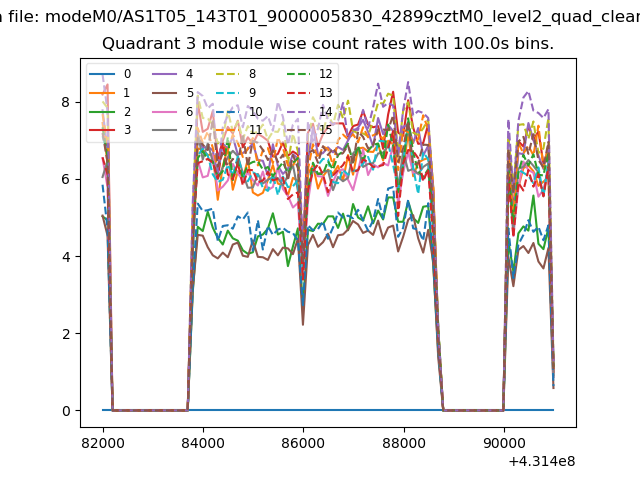
| Module-wise count rates for Quadrant C Data is divided into 100 sec bins |
 |
 |
| Module-wise count rates for Quadrant D Data is divided into 100 sec bins |
 |
 |
| Parameter | Plot |
|---|---|
| CZT HV Monitor | 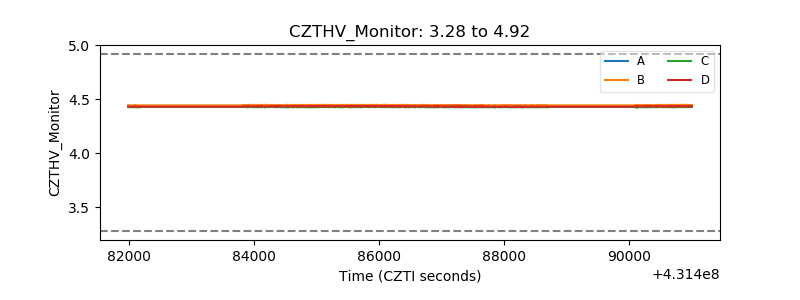 |
| D_VDD | 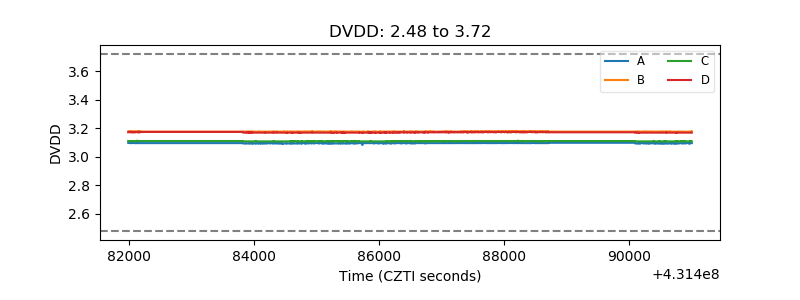 |
| Temperature 1 | 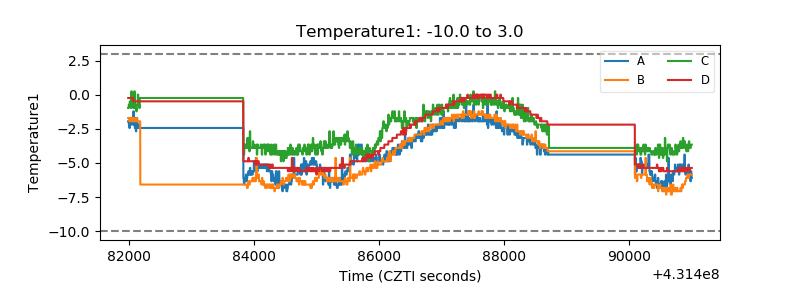 |
| Veto HV Monitor |  |
| Veto LLD | 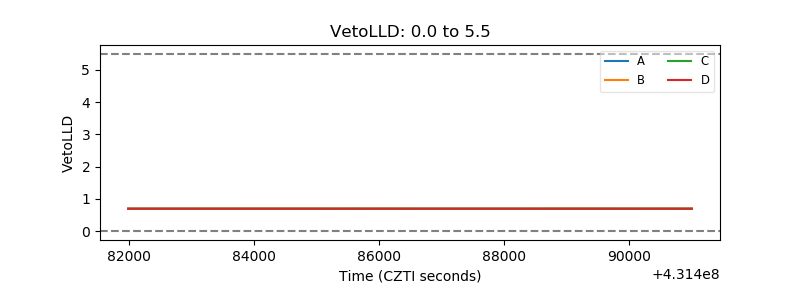 |
| Alpha Counter | 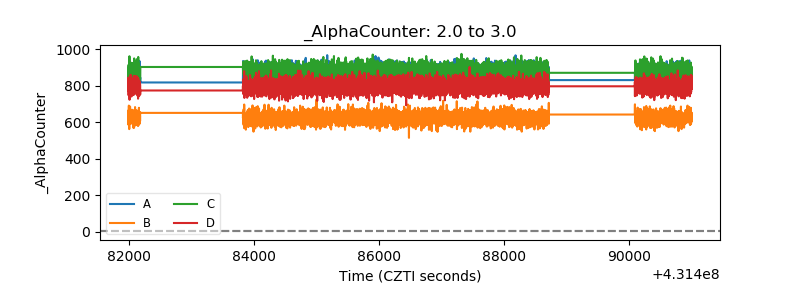 |
| _CPM_Rate | 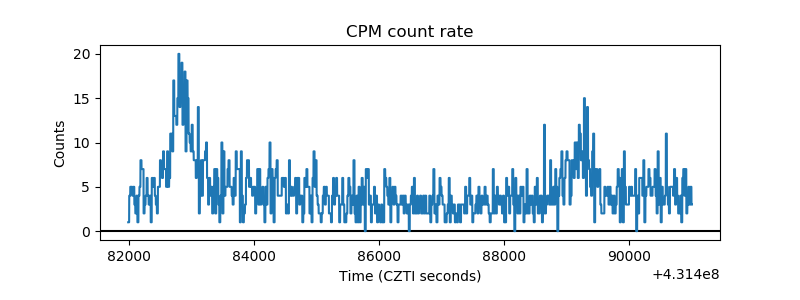 |
| CZT Counter | 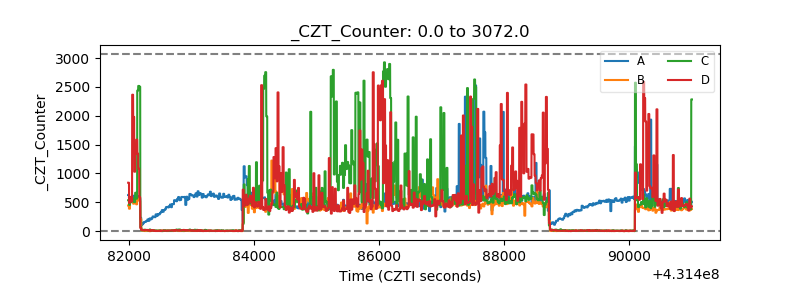 |
| +2.5 Volts monitor | 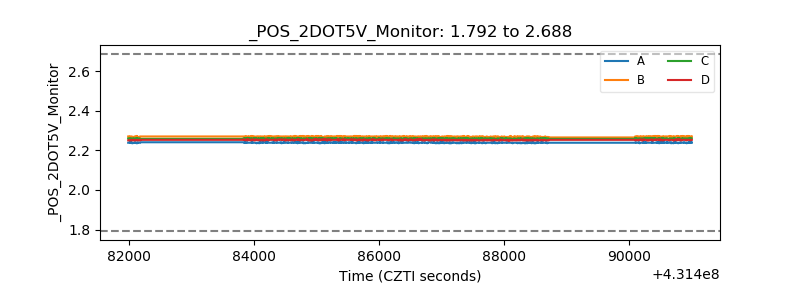 |
| +5 Volts monitor | 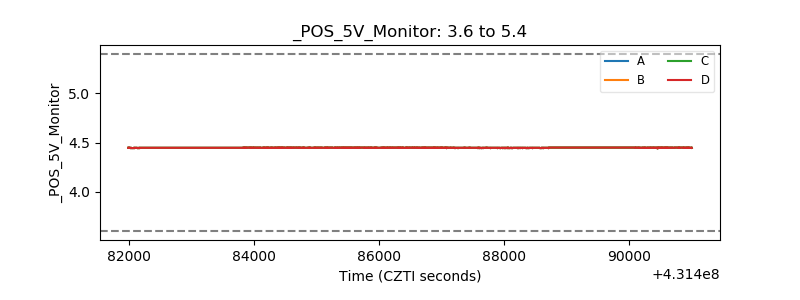 |
| _ROLL_ROT | 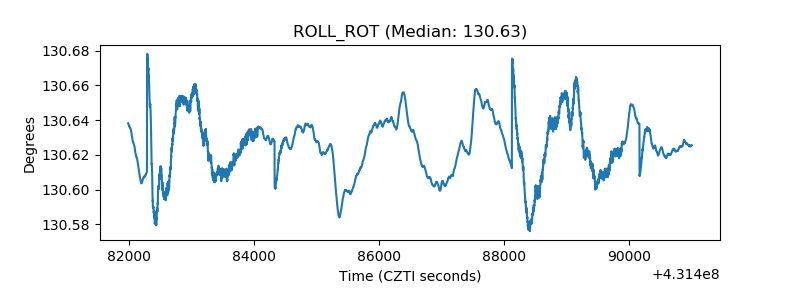 |
| _Roll_DEC | 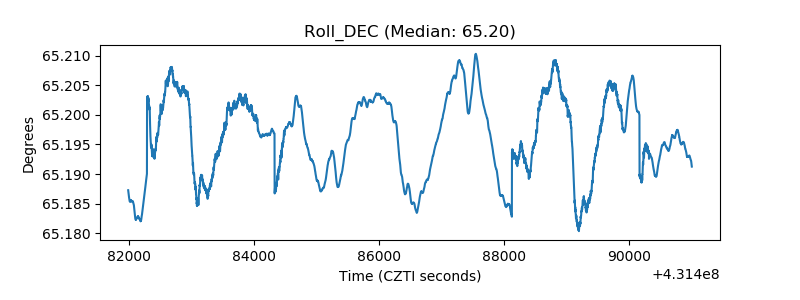 |
| _Roll_RA | 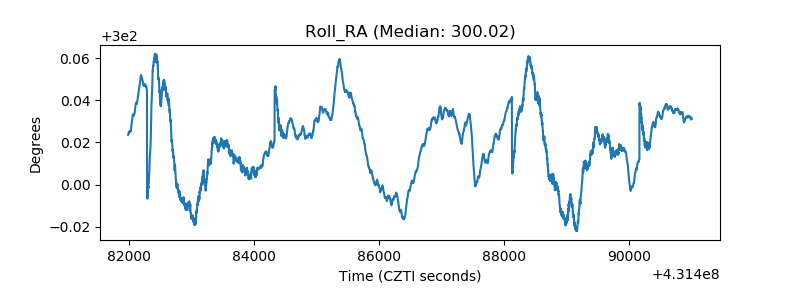 |
| Veto Counter | 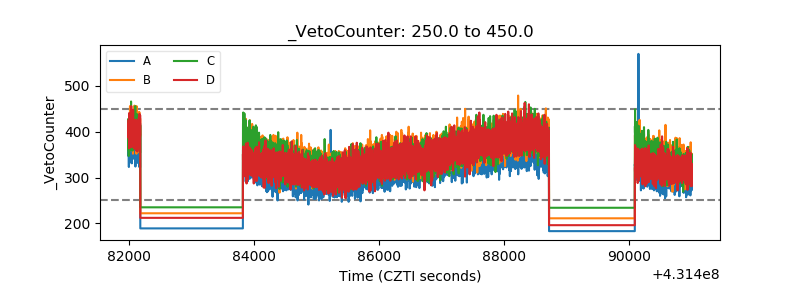 |