| Param | Original file | Final file |
|---|---|---|
| Filename | modeM0/AS1T05_143T01_9000005830_42900cztM0_level2.fits | modeM0/AS1T05_143T01_9000005830_42900cztM0_level2_quad_clean.evt |
| Size (bytes) | 400,052,160 | 90,368,640 |
| Size | 381.5 MB | 86.2 MB |
| Events in quadrant A | 3,515,232 | 598,846 |
| Events in quadrant B | 2,630,621 | 628,222 |
| Events in quadrant C | 3,688,372 | 574,510 |
| Events in quadrant D | 4,524,927 | 530,557 |
| Mode M0 | |||
|---|---|---|---|
| Quadrant | BADHDUFLAG | Total packets | Discarded packets |
| A | 0 | 13962 | 2 |
| B | 0 | 11911 | 2 |
| C | 0 | 14808 | 2 |
| D | 0 | 17540 | 2 |
| Mode M9 | |||
|---|---|---|---|
| Quadrant | BADHDUFLAG | Total packets | Discarded packets |
| A | 0 | 13 | 0 |
| B | 0 | 14 | 0 |
| C | 0 | 14 | 0 |
| D | 0 | 14 | 0 |
| Mode SS | |||
|---|---|---|---|
| Quadrant | BADHDUFLAG | Total packets | Discarded packets |
| A | 0 | 118 | 0 |
| B | 0 | 118 | 0 |
| C | 0 | 118 | 0 |
| D | 0 | 118 | 0 |
| Quadrant | Total seconds | Saturated seconds | Saturation percentage |
|---|---|---|---|
| A | 5776 | 154 | 2.666205% |
| B | 5776 | 12 | 0.207756% |
| C | 5776 | 299 | 5.176593% |
| D | 5776 | 375 | 6.492382% |
Noise dominated data is calculated using 1-second bins in cleaned event files. If a bin has >2000 counts, and if more than 50% of those come from <1% of pixels, then it is considered to be noise-dominated and hence unusable.
| Quadrant | # 1 sec bins | Bins with >0 counts | Bins with >2000 counts | High rate bins dominated by noise | Noise dominated (total time) | Noise dominated (detector-on time) | Marked lightcurve |
|---|---|---|---|---|---|---|---|
| A | 7087 | 5777 | 123 | 123 | 1.74% | 2.13% | 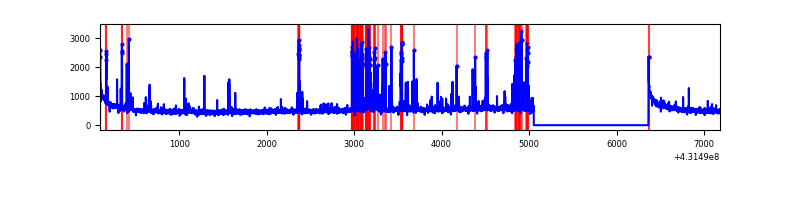 |
| B | 7087 | 5777 | 2 | 2 | 0.03% | 0.03% | 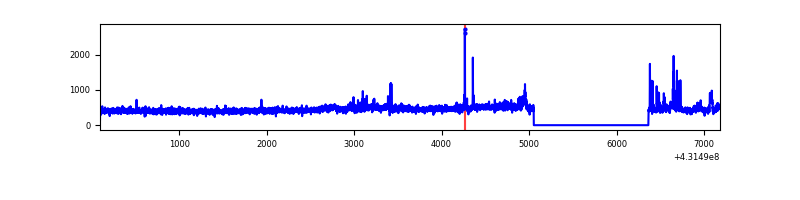 |
| C | 7087 | 5777 | 240 | 240 | 3.39% | 4.15% | 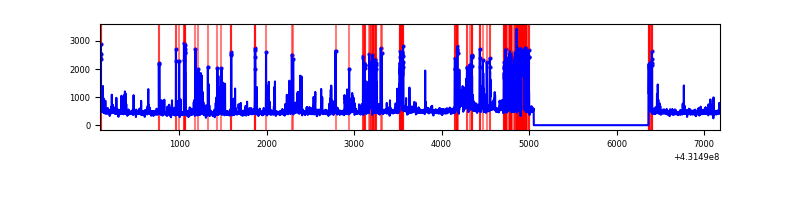 |
| D | 7087 | 5777 | 375 | 375 | 5.29% | 6.49% | 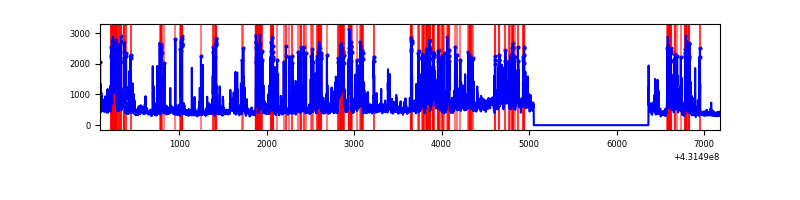 |
Top three noisy pixels from each quadrant. If the there are fewer than three noisy pixels in the level2.evt file, extra rows are filled as -1
| Pixel properties | Quadrant properties | ||||||
|---|---|---|---|---|---|---|---|
| Quadrant | DetID | PixID | Counts | Sigma | Mean | Median | Sigma |
| A | 10 | 83 | 624763 | 4935.62 | 609 | 595 | 126.5 |
| A | 15 | 237 | 449926 | 3553.09 | 609 | 595 | 126.5 |
| A | 2 | 79 | 59608 | 466.65 | 609 | 595 | 126.5 |
| B | 0 | 230 | 73626 | 605.56 | 616 | 599 | 120.6 |
| B | 0 | 229 | 65595 | 538.96 | 616 | 599 | 120.6 |
| B | 4 | 171 | 40108 | 327.62 | 616 | 599 | 120.6 |
| C | 5 | 250 | 610673 | 4422.2 | 586 | 589 | 138.0 |
| C | 15 | 214 | 248760 | 1798.87 | 586 | 589 | 138.0 |
| C | 5 | 233 | 210907 | 1524.49 | 586 | 589 | 138.0 |
| D | 1 | 47 | 450501 | 3124.11 | 588 | 570 | 144.0 |
| D | 12 | 6 | 430409 | 2984.6 | 588 | 570 | 144.0 |
| D | 2 | 249 | 423465 | 2936.39 | 588 | 570 | 144.0 |
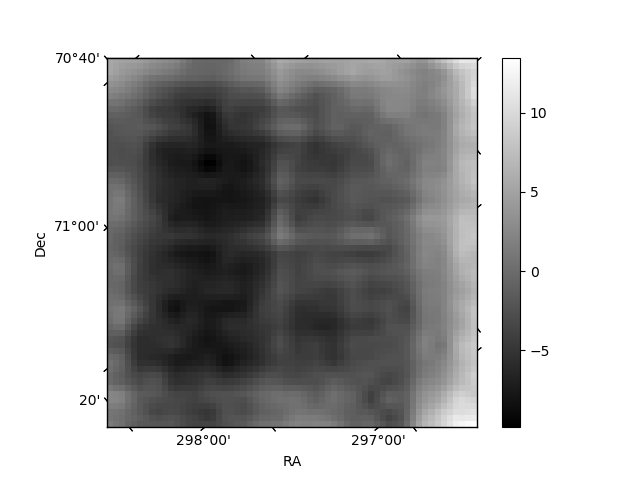
Histogram calculated using DETX and DETY for each event in the final _common_clean file
| Quadrant A | 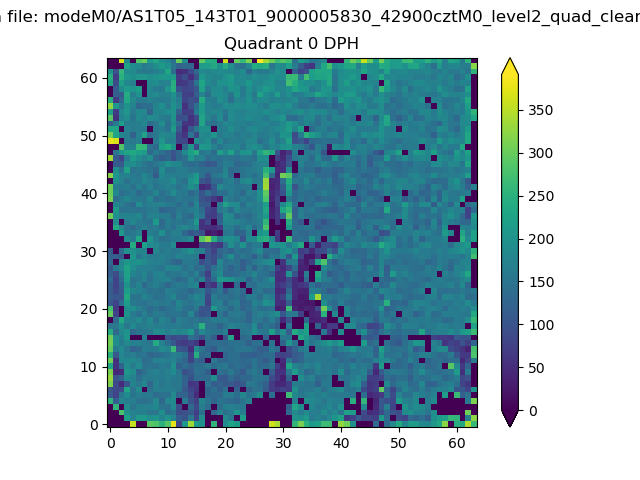 |
 |
Quadrant B |
|---|---|---|---|
| Quadrant D | 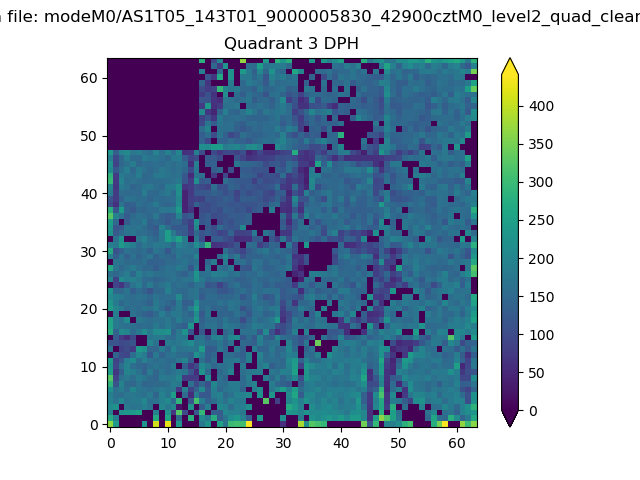 |
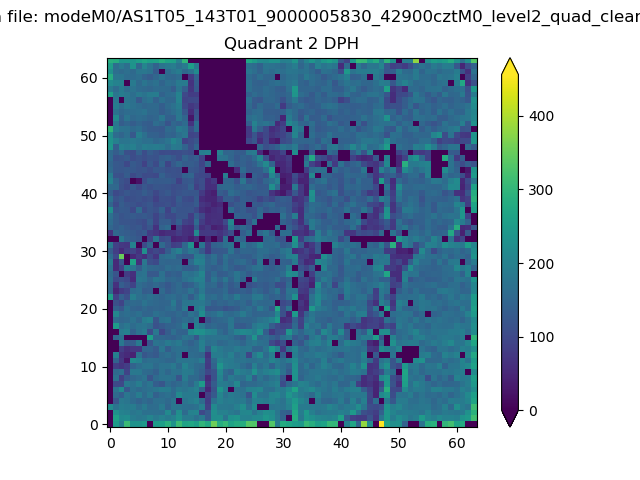 |
Quadrant C |
| Plot type | Count rate plots | Images |
|---|---|---|
| Comparison with Poisson distribution Blue bars denote a histogram of data divided into 1 sec bins. Red curve is a Poisson curve with rate = median count rate of data. |
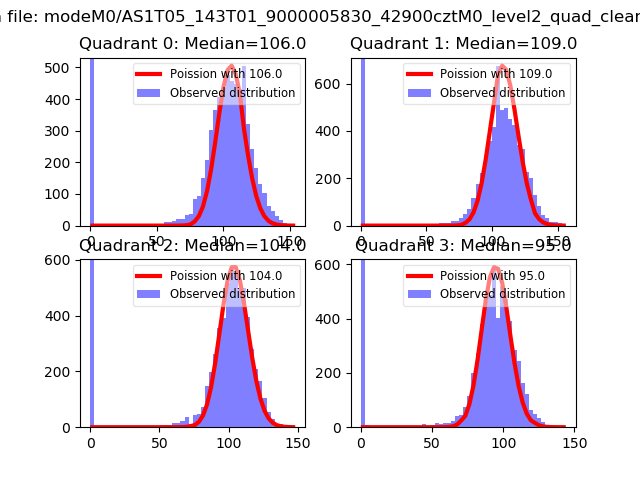 |
 |
| Quadrant-wise count rates Data is divided into 100 sec bins |
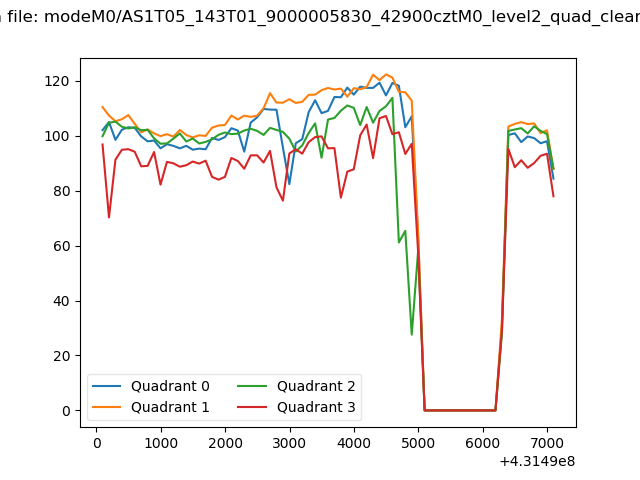 |
|
| Module-wise count rates for Quadrant A Data is divided into 100 sec bins |
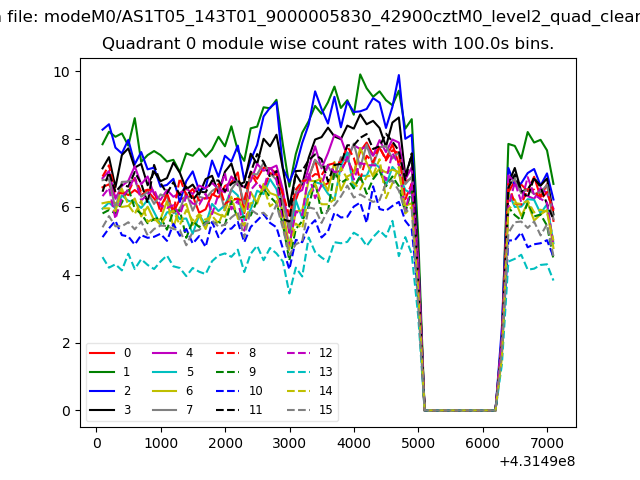 |
 |
| Module-wise count rates for Quadrant B Data is divided into 100 sec bins |
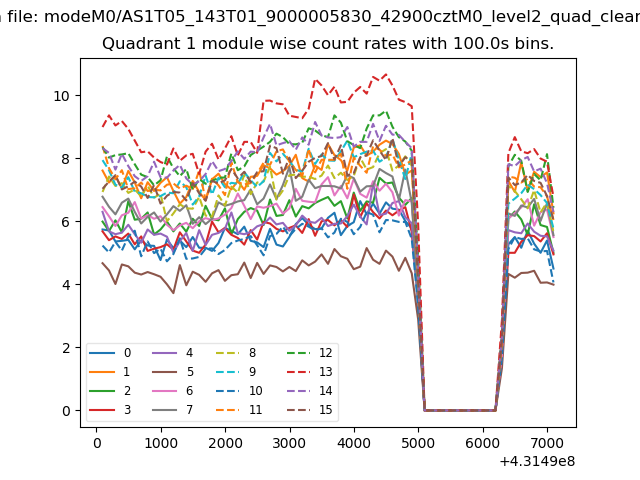 |
 |
| Module-wise count rates for Quadrant C Data is divided into 100 sec bins |
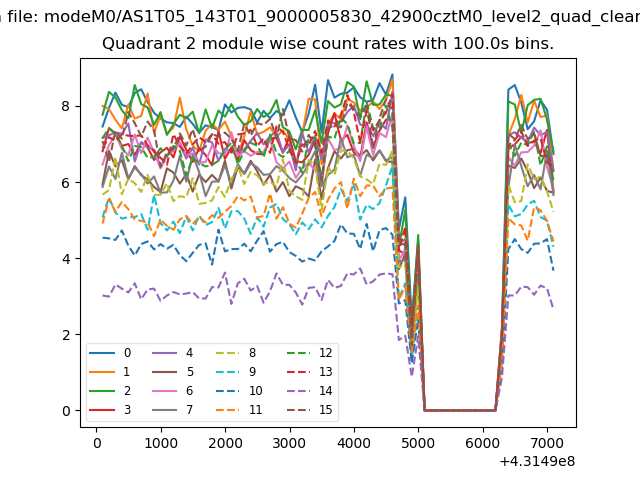 |
 |
| Module-wise count rates for Quadrant D Data is divided into 100 sec bins |
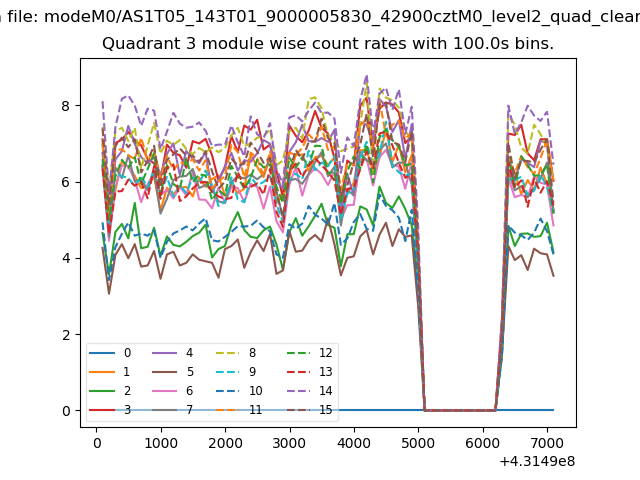 |
 |
| Parameter | Plot |
|---|---|
| CZT HV Monitor |  |
| D_VDD | 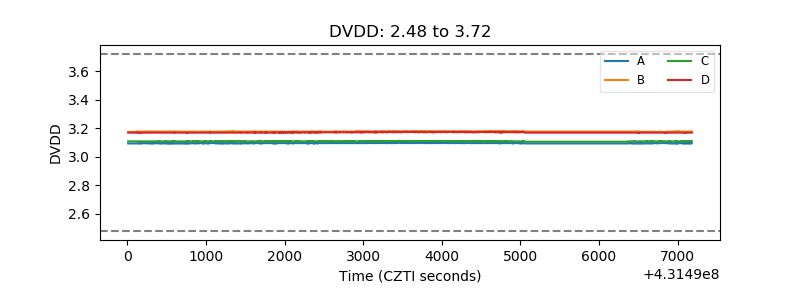 |
| Temperature 1 | 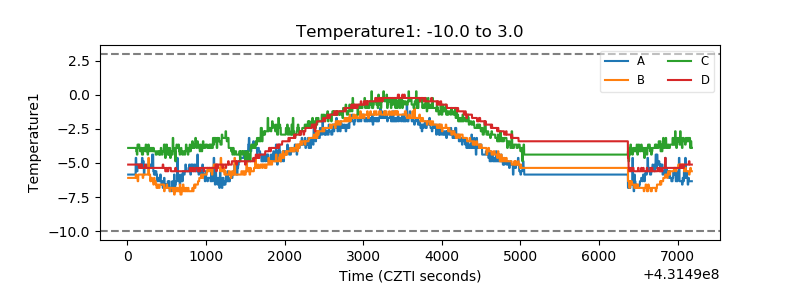 |
| Veto HV Monitor | 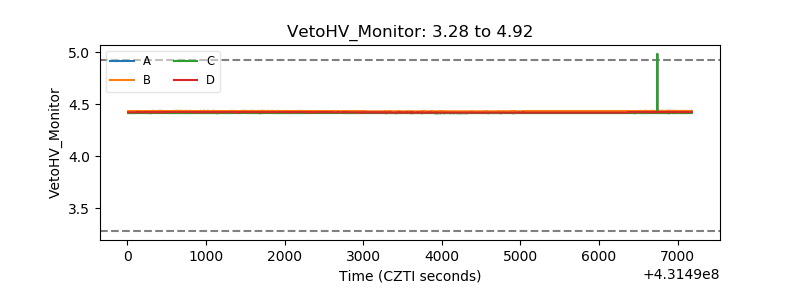 |
| Veto LLD | 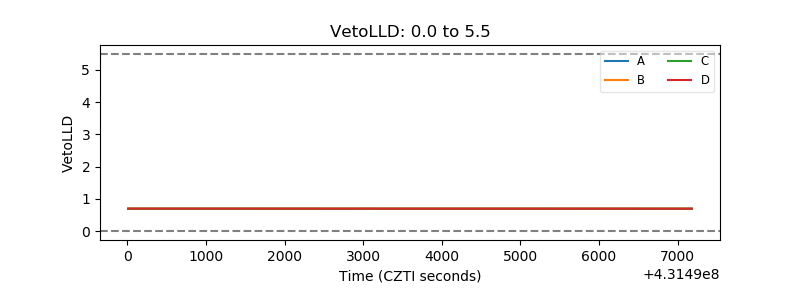 |
| Alpha Counter | 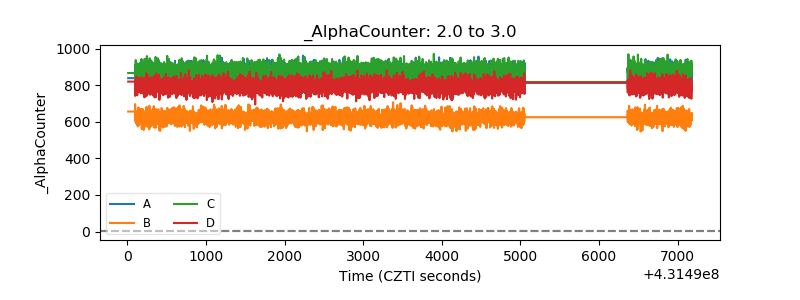 |
| _CPM_Rate | 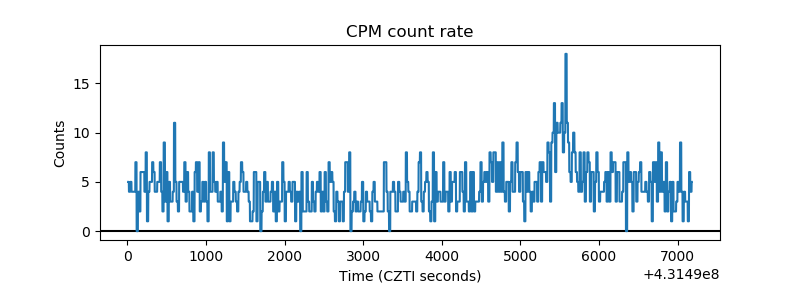 |
| CZT Counter | 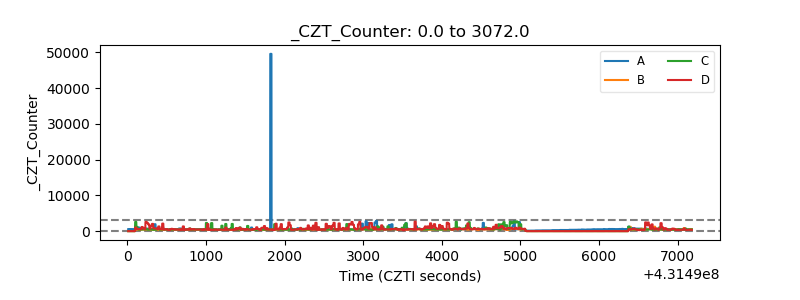 |
| +2.5 Volts monitor | 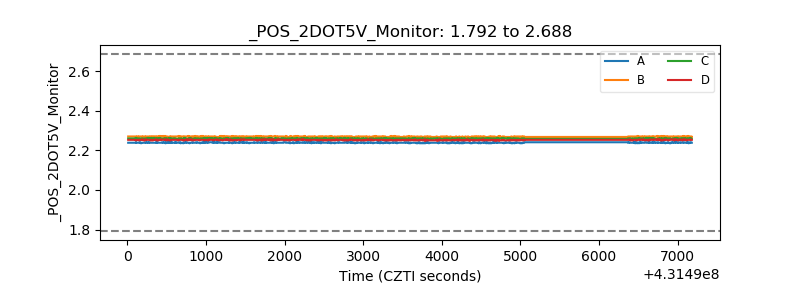 |
| +5 Volts monitor | 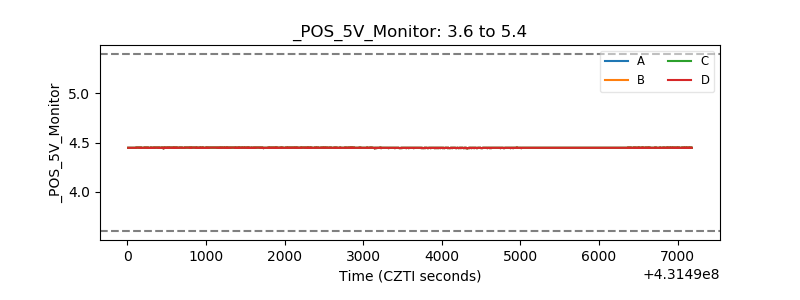 |
| _ROLL_ROT | 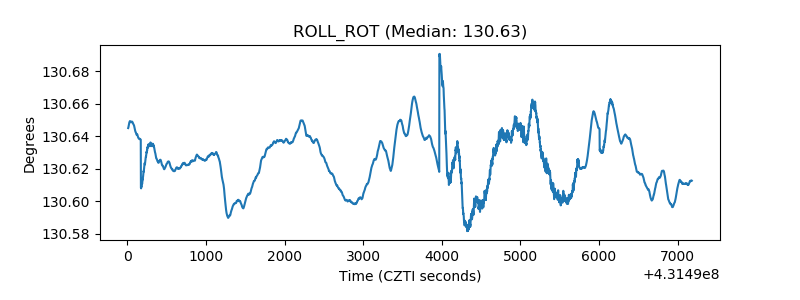 |
| _Roll_DEC | 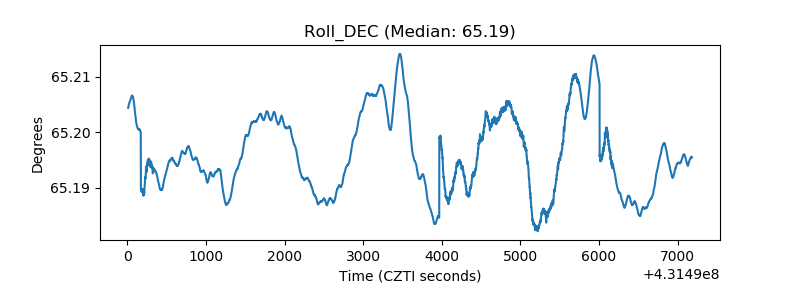 |
| _Roll_RA |  |
| Veto Counter | 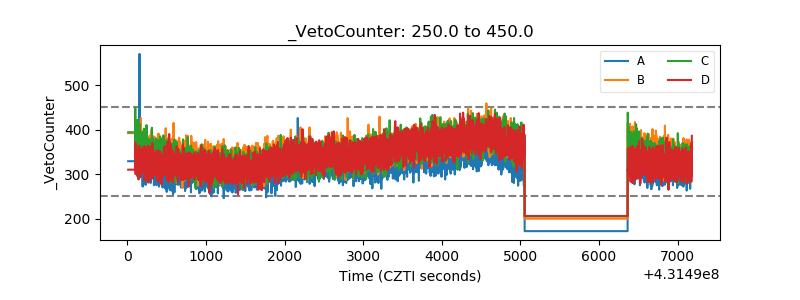 |