| Param | Original file | Final file |
|---|---|---|
| Filename | modeM0/AS1T05_143T01_9000005830_42903cztM0_level2.fits | modeM0/AS1T05_143T01_9000005830_42903cztM0_level2_quad_clean.evt |
| Size (bytes) | 1,041,704,640 | 244,411,200 |
| Size | 993.4 MB | 233.1 MB |
| Events in quadrant A | 9,423,694 | 1,632,593 |
| Events in quadrant B | 7,090,230 | 1,701,740 |
| Events in quadrant C | 8,013,876 | 1,594,898 |
| Events in quadrant D | 12,822,857 | 1,392,303 |
| Mode M0 | |||
|---|---|---|---|
| Quadrant | BADHDUFLAG | Total packets | Discarded packets |
| A | 0 | 37008 | 4 |
| B | 0 | 31999 | 4 |
| C | 0 | 33741 | 4 |
| D | 0 | 48842 | 4 |
| Mode M9 | |||
|---|---|---|---|
| Quadrant | BADHDUFLAG | Total packets | Discarded packets |
| A | 0 | 49 | 0 |
| B | 0 | 50 | 0 |
| C | 0 | 50 | 0 |
| D | 0 | 50 | 0 |
| Mode SS | |||
|---|---|---|---|
| Quadrant | BADHDUFLAG | Total packets | Discarded packets |
| A | 0 | 318 | 0 |
| B | 0 | 318 | 0 |
| C | 0 | 318 | 0 |
| D | 0 | 318 | 0 |
| Quadrant | Total seconds | Saturated seconds | Saturation percentage |
|---|---|---|---|
| A | 15625 | 422 | 2.700800% |
| B | 15625 | 27 | 0.172800% |
| C | 15625 | 139 | 0.889600% |
| D | 15625 | 1285 | 8.224000% |
Noise dominated data is calculated using 1-second bins in cleaned event files. If a bin has >2000 counts, and if more than 50% of those come from <1% of pixels, then it is considered to be noise-dominated and hence unusable.
| Quadrant | # 1 sec bins | Bins with >0 counts | Bins with >2000 counts | High rate bins dominated by noise | Noise dominated (total time) | Noise dominated (detector-on time) | Marked lightcurve |
|---|---|---|---|---|---|---|---|
| A | 19893 | 15628 | 329 | 329 | 1.65% | 2.11% | 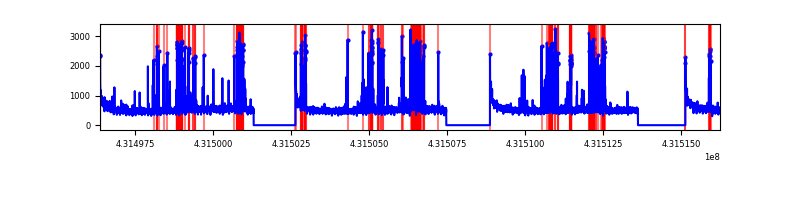 |
| B | 19893 | 15628 | 10 | 10 | 0.05% | 0.06% | 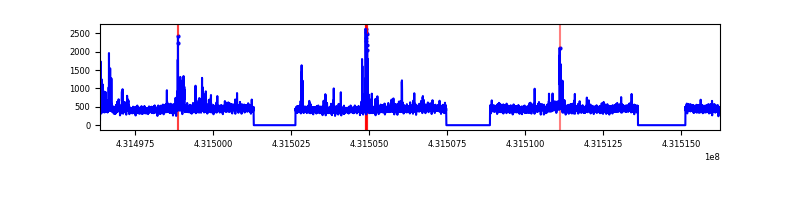 |
| C | 19893 | 15628 | 142 | 142 | 0.71% | 0.91% | 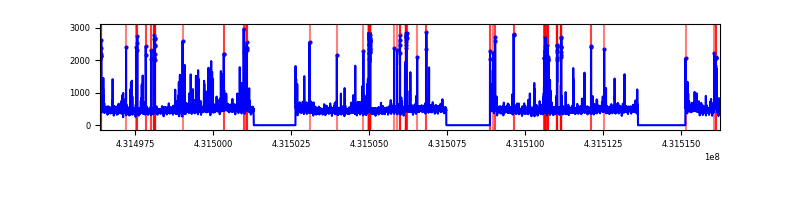 |
| D | 19893 | 15628 | 1206 | 1206 | 6.06% | 7.72% | 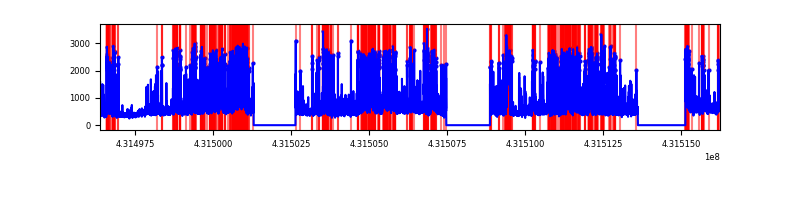 |
Top three noisy pixels from each quadrant. If the there are fewer than three noisy pixels in the level2.evt file, extra rows are filled as -1
| Pixel properties | Quadrant properties | ||||||
|---|---|---|---|---|---|---|---|
| Quadrant | DetID | PixID | Counts | Sigma | Mean | Median | Sigma |
| A | 10 | 83 | 1570244 | 4569.28 | 1682 | 1644 | 343.3 |
| A | 15 | 237 | 1160838 | 3376.7 | 1682 | 1644 | 343.3 |
| A | 2 | 79 | 140584 | 404.73 | 1682 | 1644 | 343.3 |
| B | 0 | 229 | 193941 | 592.28 | 1690 | 1639 | 324.7 |
| B | 0 | 230 | 78063 | 235.38 | 1690 | 1639 | 324.7 |
| B | 3 | 112 | 60490 | 181.26 | 1690 | 1639 | 324.7 |
| C | 15 | 214 | 678064 | 1768.41 | 1646 | 1655 | 382.5 |
| C | 14 | 254 | 591349 | 1541.71 | 1646 | 1655 | 382.5 |
| C | 12 | 2 | 188223 | 487.77 | 1646 | 1655 | 382.5 |
| D | 1 | 47 | 1752502 | 4491.67 | 1601 | 1555 | 389.8 |
| D | 1 | 52 | 1711338 | 4386.08 | 1601 | 1555 | 389.8 |
| D | 13 | 249 | 1080547 | 2767.92 | 1601 | 1555 | 389.8 |
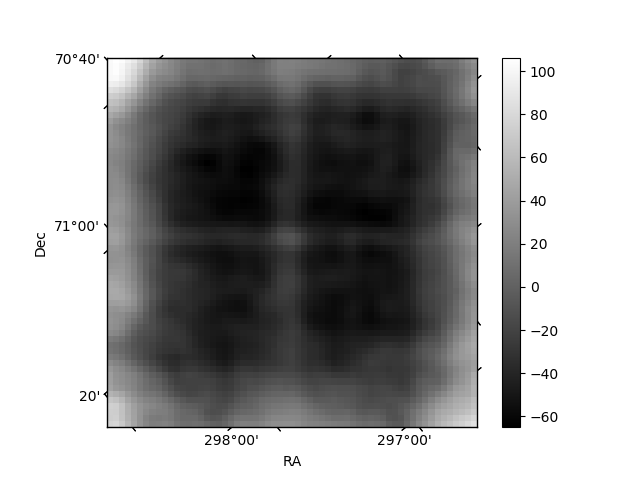
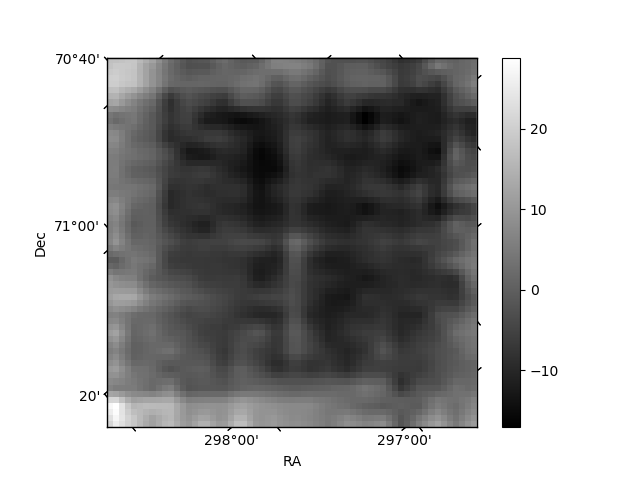
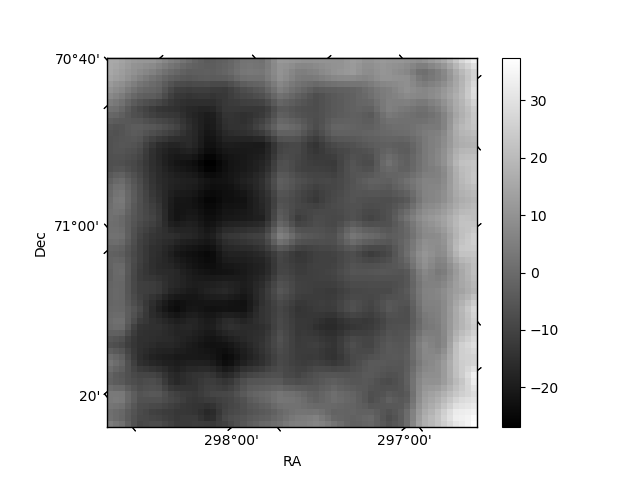
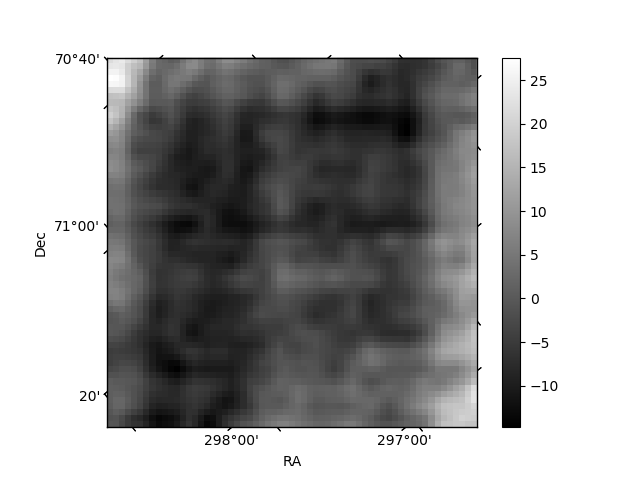
Histogram calculated using DETX and DETY for each event in the final _common_clean file
| Quadrant A | 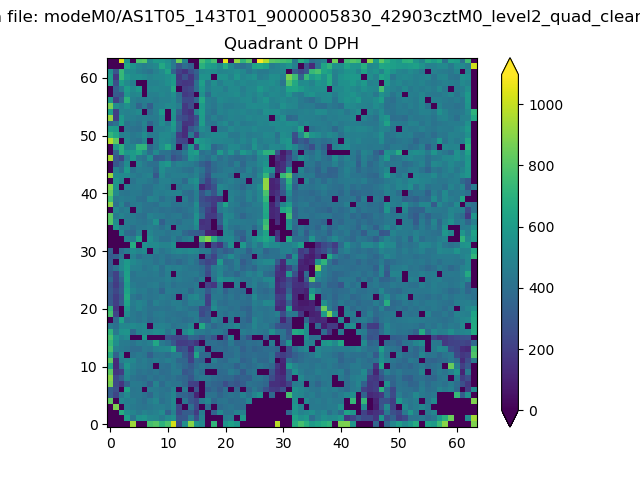 |
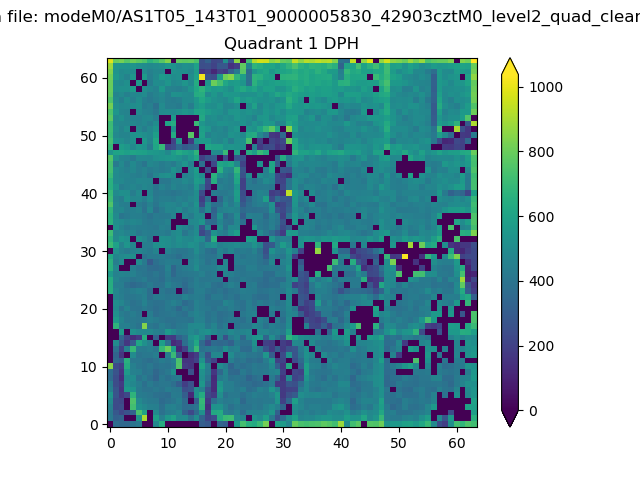 |
Quadrant B |
|---|---|---|---|
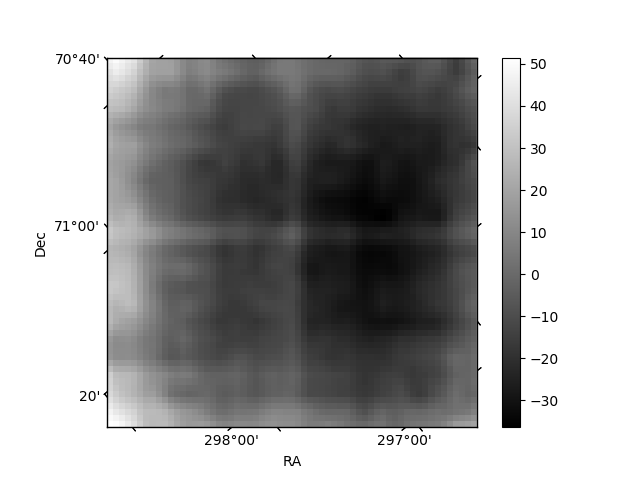
| Quadrant D | 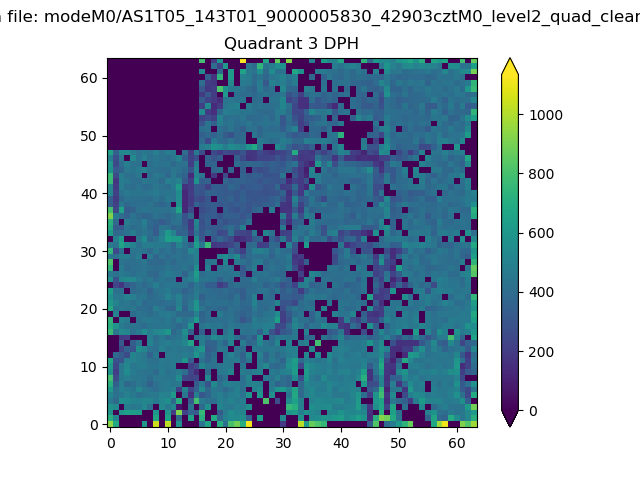 |
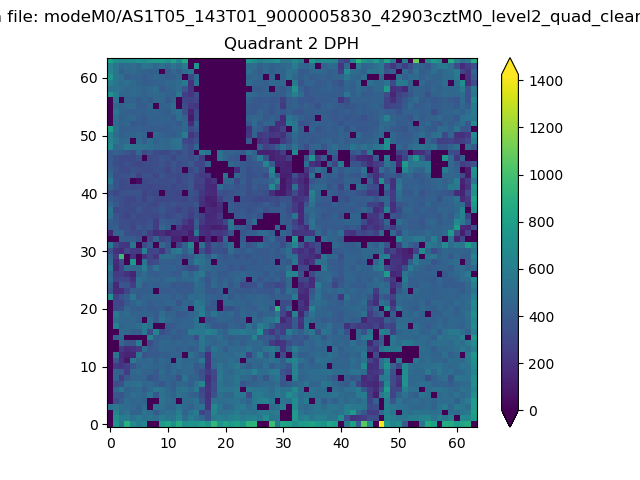 |
Quadrant C |
| Plot type | Count rate plots | Images |
|---|---|---|
| Comparison with Poisson distribution Blue bars denote a histogram of data divided into 1 sec bins. Red curve is a Poisson curve with rate = median count rate of data. |
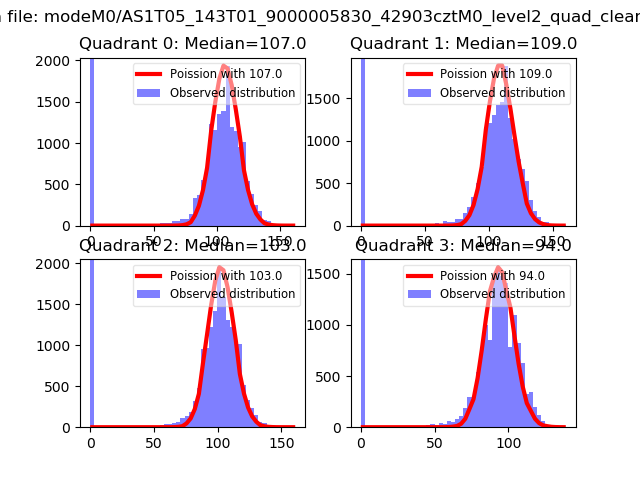 |
 |
| Quadrant-wise count rates Data is divided into 100 sec bins |
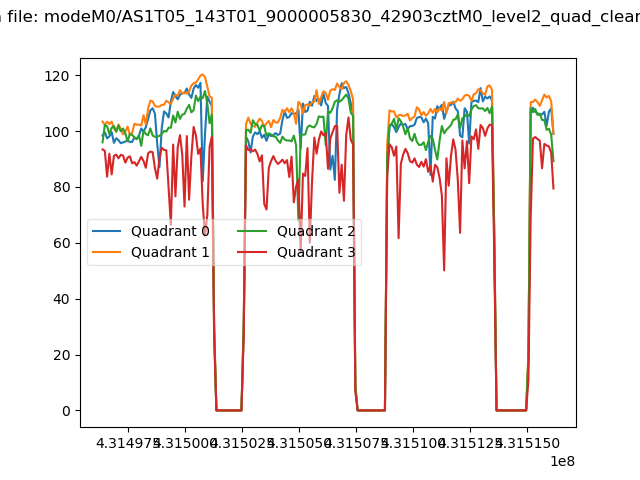 |
|
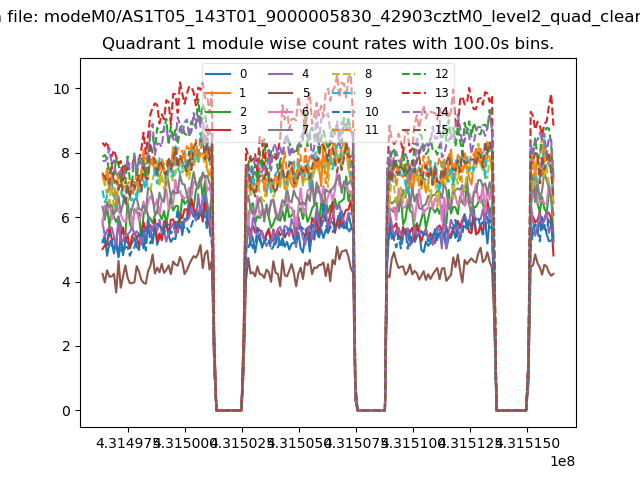
| Module-wise count rates for Quadrant A Data is divided into 100 sec bins |
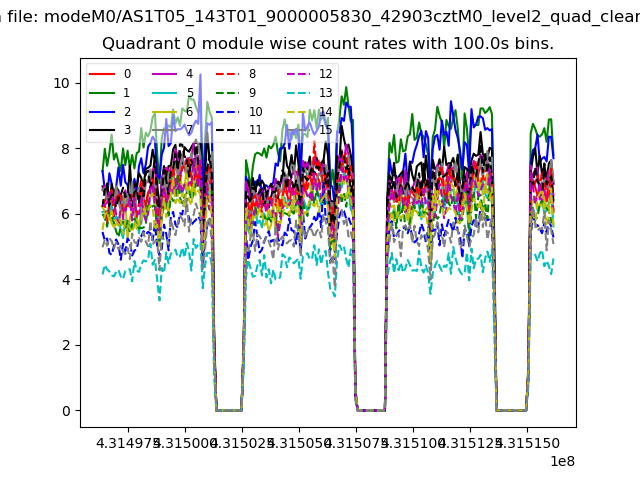 |
 |
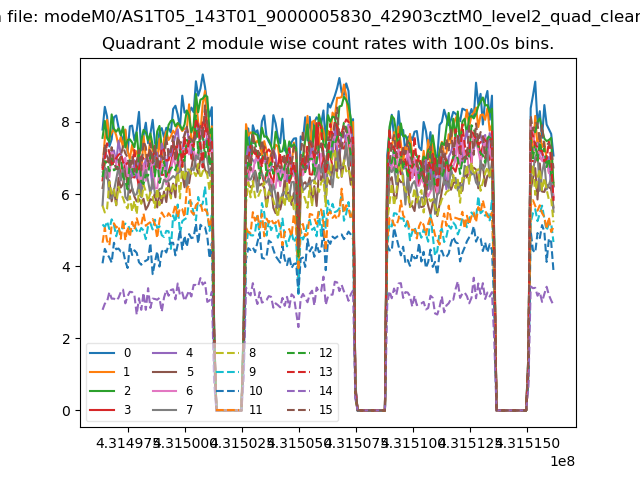
| Module-wise count rates for Quadrant B Data is divided into 100 sec bins |
 |
 |
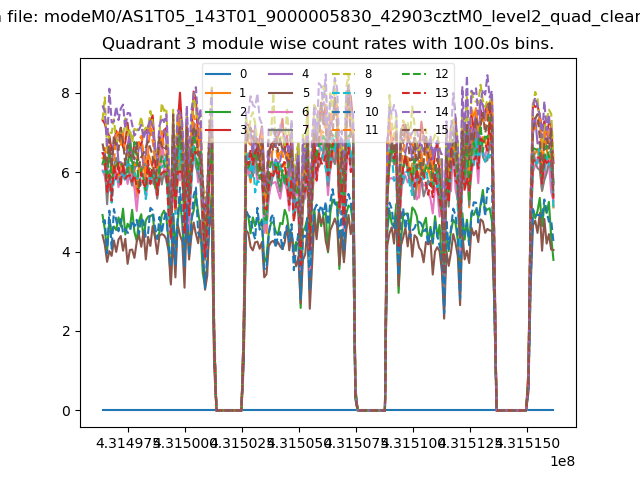
| Module-wise count rates for Quadrant C Data is divided into 100 sec bins |
 |
 |
| Module-wise count rates for Quadrant D Data is divided into 100 sec bins |
 |
 |
| Parameter | Plot |
|---|---|
| CZT HV Monitor | 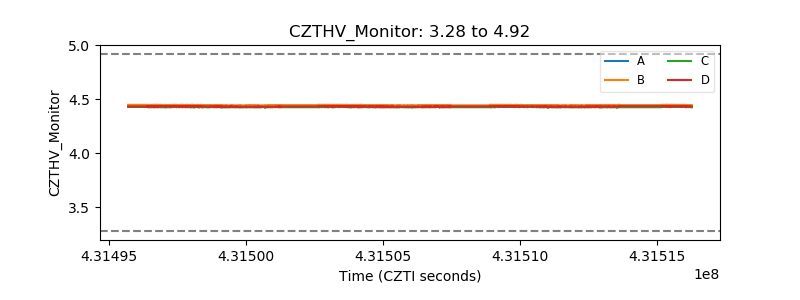 |
| D_VDD | 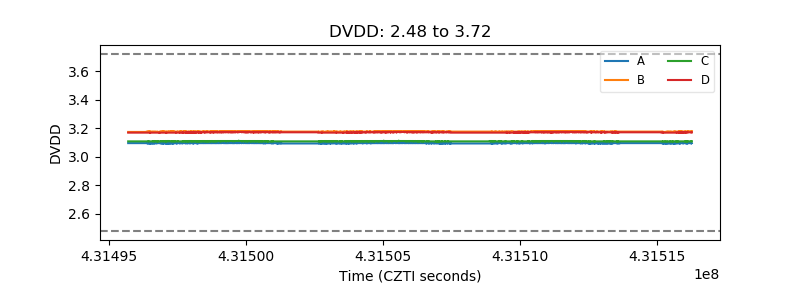 |
| Temperature 1 | 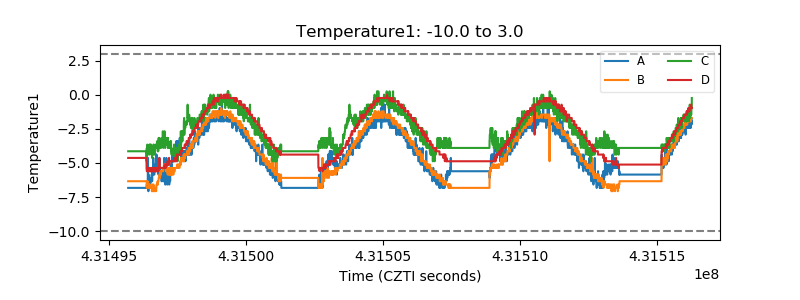 |
| Veto HV Monitor | 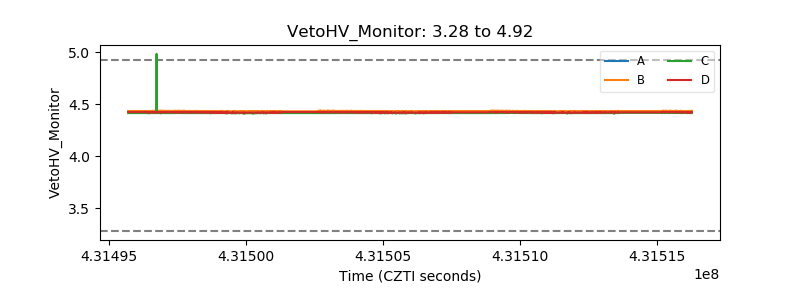 |
| Veto LLD | 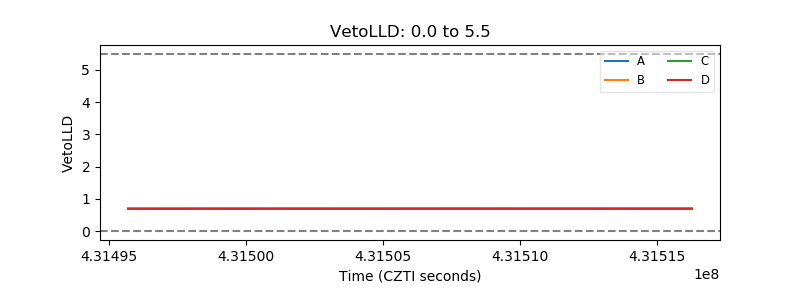 |
| Alpha Counter | 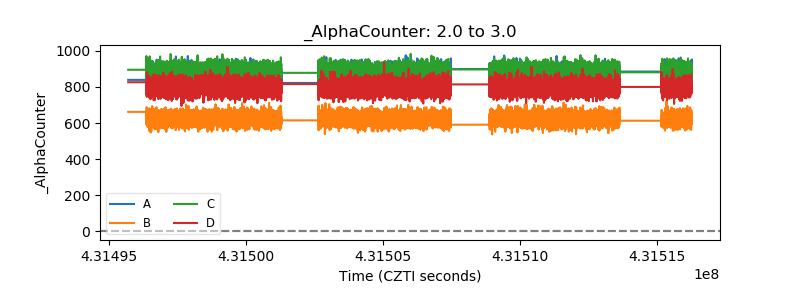 |
| _CPM_Rate | 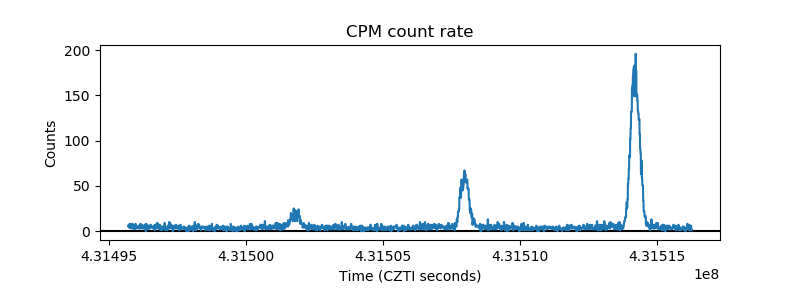 |
| CZT Counter | 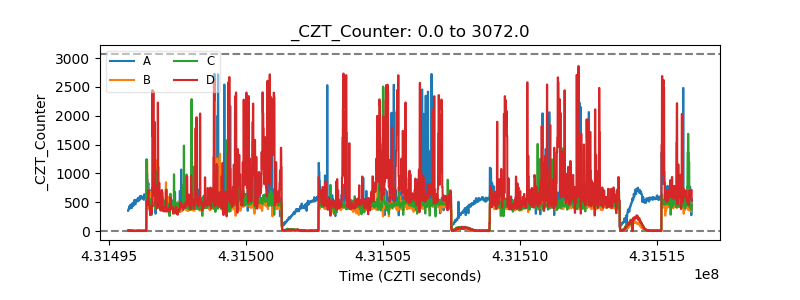 |
| +2.5 Volts monitor | 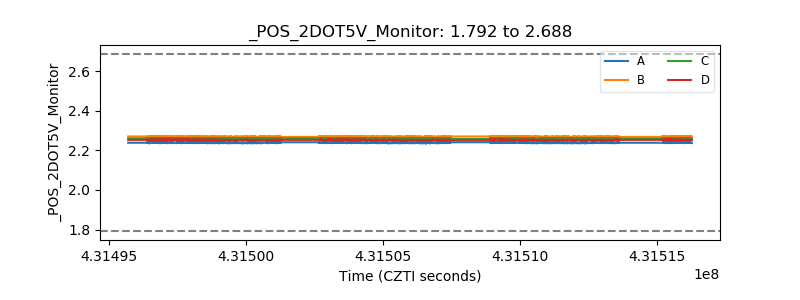 |
| +5 Volts monitor | 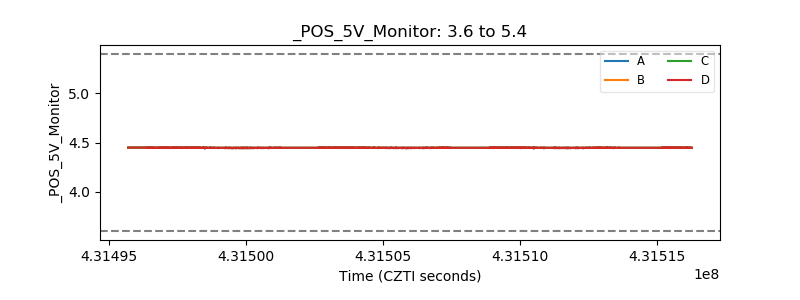 |
| _ROLL_ROT | 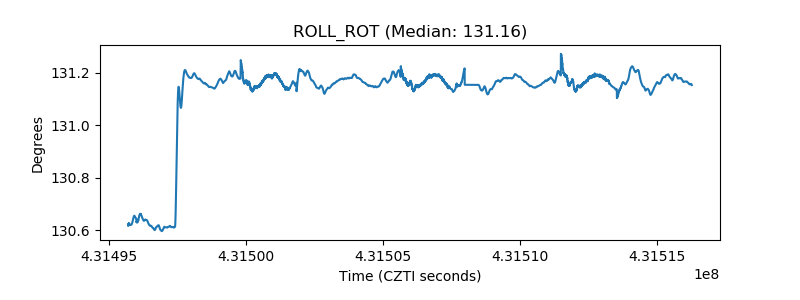 |
| _Roll_DEC | 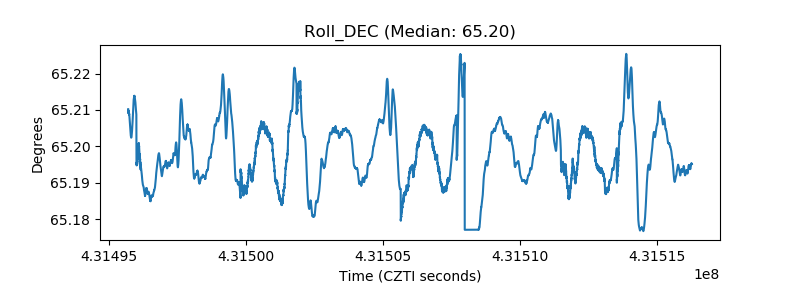 |
| _Roll_RA | 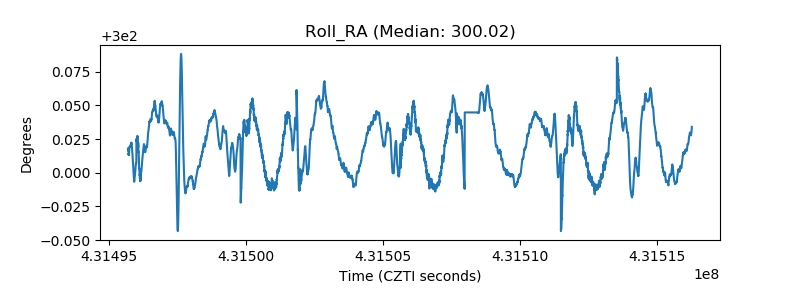 |
| Veto Counter | 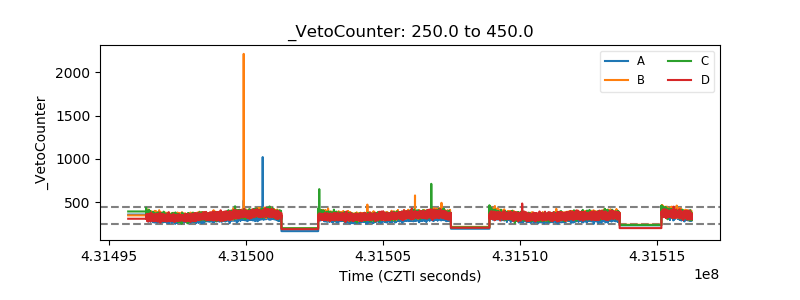 |