| Param | Original file | Final file |
|---|---|---|
| Filename | modeM0/AS1T05_143T01_9000005830_42904cztM0_level2.fits | modeM0/AS1T05_143T01_9000005830_42904cztM0_level2_quad_clean.evt |
| Size (bytes) | 370,981,440 | 91,641,600 |
| Size | 353.8 MB | 87.4 MB |
| Events in quadrant A | 3,404,317 | 617,297 |
| Events in quadrant B | 2,505,996 | 639,868 |
| Events in quadrant C | 2,890,784 | 592,077 |
| Events in quadrant D | 4,490,669 | 529,818 |
| Mode M0 | |||
|---|---|---|---|
| Quadrant | BADHDUFLAG | Total packets | Discarded packets |
| A | 0 | 13482 | 2 |
| B | 0 | 11428 | 2 |
| C | 0 | 12196 | 2 |
| D | 0 | 17344 | 2 |
| Mode M9 | |||
|---|---|---|---|
| Quadrant | BADHDUFLAG | Total packets | Discarded packets |
| A | 0 | 28 | 0 |
| B | 0 | 29 | 0 |
| C | 0 | 29 | 0 |
| D | 0 | 29 | 0 |
| Mode SS | |||
|---|---|---|---|
| Quadrant | BADHDUFLAG | Total packets | Discarded packets |
| A | 0 | 114 | 0 |
| B | 0 | 114 | 0 |
| C | 0 | 114 | 0 |
| D | 0 | 114 | 0 |
| Quadrant | Total seconds | Saturated seconds | Saturation percentage |
|---|---|---|---|
| A | 5661 | 145 | 2.561385% |
| B | 5661 | 9 | 0.158983% |
| C | 5661 | 41 | 0.724254% |
| D | 5661 | 310 | 5.476064% |
Noise dominated data is calculated using 1-second bins in cleaned event files. If a bin has >2000 counts, and if more than 50% of those come from <1% of pixels, then it is considered to be noise-dominated and hence unusable.
| Quadrant | # 1 sec bins | Bins with >0 counts | Bins with >2000 counts | High rate bins dominated by noise | Noise dominated (total time) | Noise dominated (detector-on time) | Marked lightcurve |
|---|---|---|---|---|---|---|---|
| A | 7304 | 5662 | 101 | 101 | 1.38% | 1.78% | 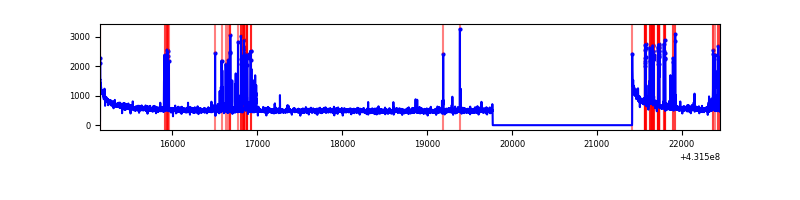 |
| B | 7304 | 5662 | 3 | 3 | 0.04% | 0.05% | 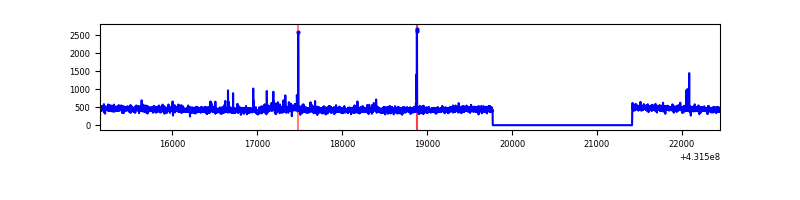 |
| C | 7304 | 5662 | 44 | 44 | 0.60% | 0.78% | 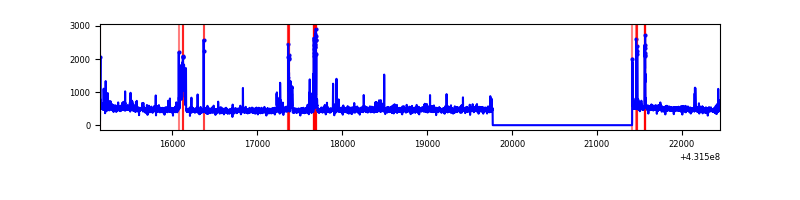 |
| D | 7304 | 5662 | 297 | 297 | 4.07% | 5.25% | 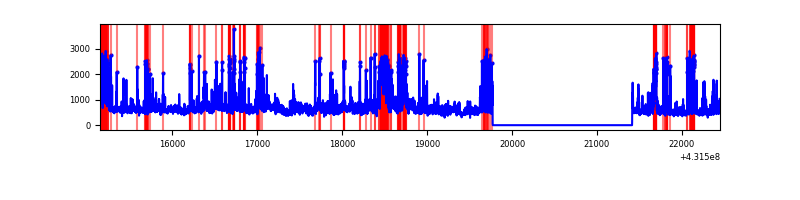 |
Top three noisy pixels from each quadrant. If the there are fewer than three noisy pixels in the level2.evt file, extra rows are filled as -1
| Pixel properties | Quadrant properties | ||||||
|---|---|---|---|---|---|---|---|
| Quadrant | DetID | PixID | Counts | Sigma | Mean | Median | Sigma |
| A | 10 | 83 | 615140 | 4819.5 | 616 | 601 | 127.5 |
| A | 15 | 237 | 382647 | 2996.18 | 616 | 601 | 127.5 |
| A | 2 | 79 | 9320 | 68.38 | 616 | 601 | 127.5 |
| B | 0 | 229 | 56996 | 471.24 | 616 | 598 | 119.7 |
| B | 3 | 112 | 16123 | 129.72 | 616 | 598 | 119.7 |
| B | 12 | 111 | 15041 | 120.68 | 616 | 598 | 119.7 |
| C | 15 | 214 | 248558 | 1774.01 | 598 | 601 | 139.8 |
| C | 12 | 2 | 145537 | 1036.95 | 598 | 601 | 139.8 |
| C | 14 | 254 | 136613 | 973.1 | 598 | 601 | 139.8 |
| D | 1 | 52 | 978134 | 6887.1 | 588 | 571 | 141.9 |
| D | 2 | 249 | 388783 | 2735.02 | 588 | 571 | 141.9 |
| D | 1 | 47 | 374722 | 2635.96 | 588 | 571 | 141.9 |
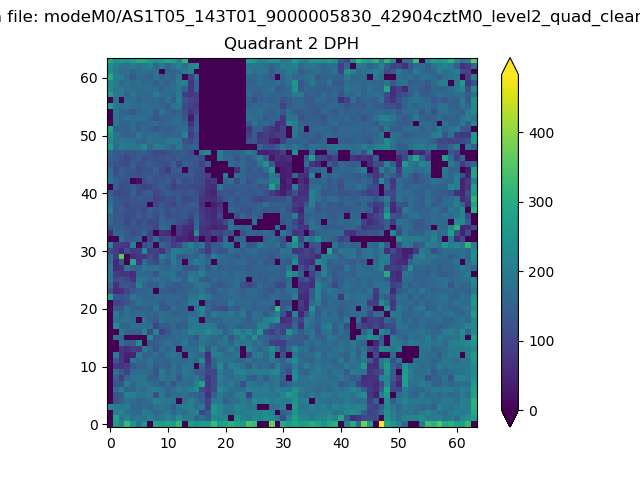
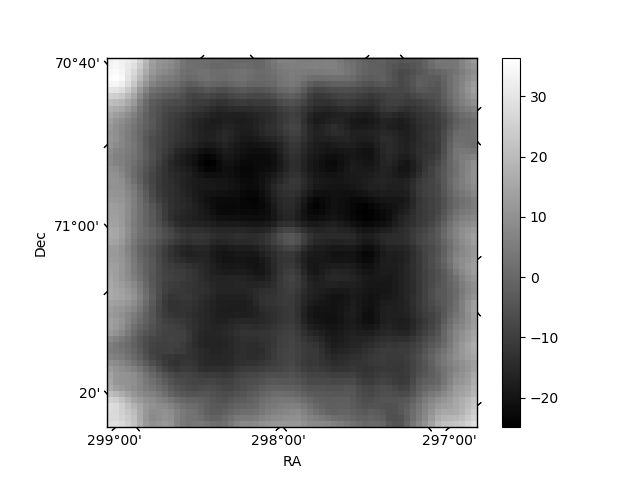
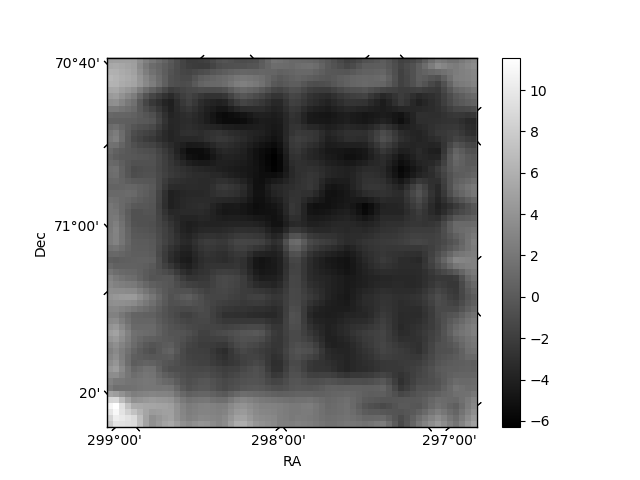
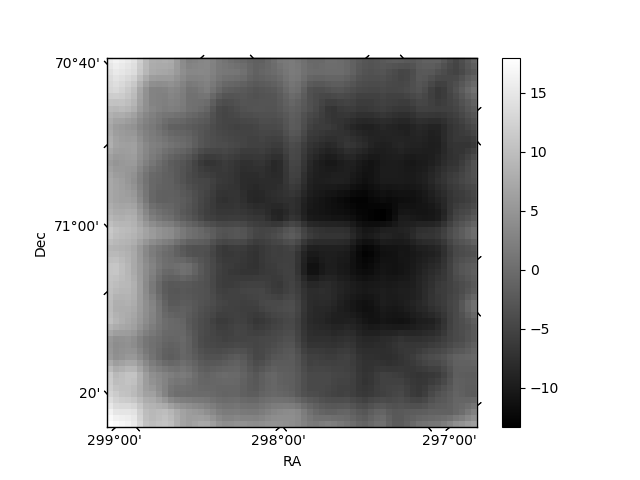
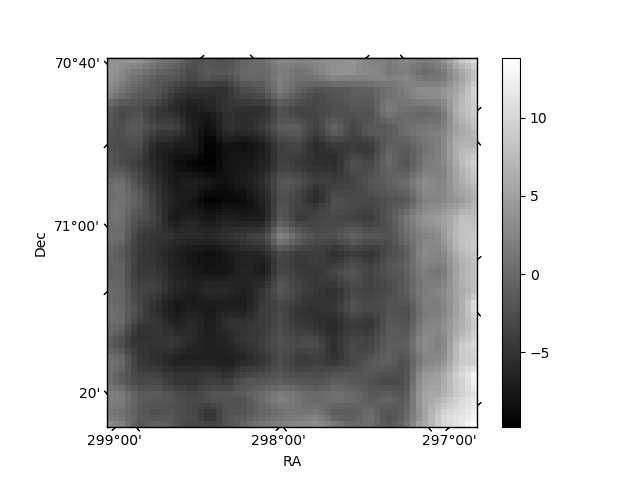
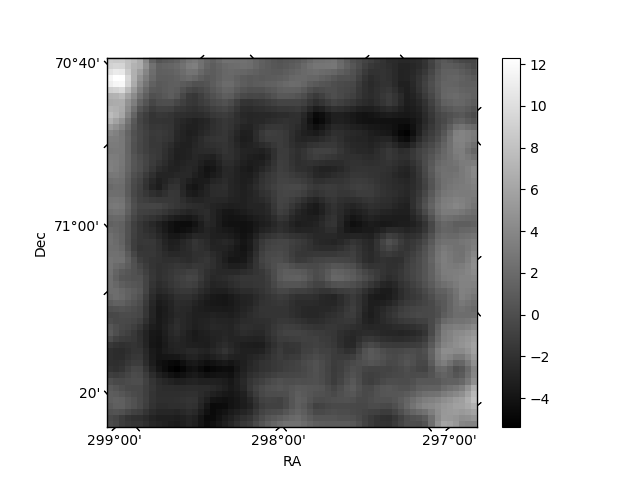
Histogram calculated using DETX and DETY for each event in the final _common_clean file
| Quadrant A | 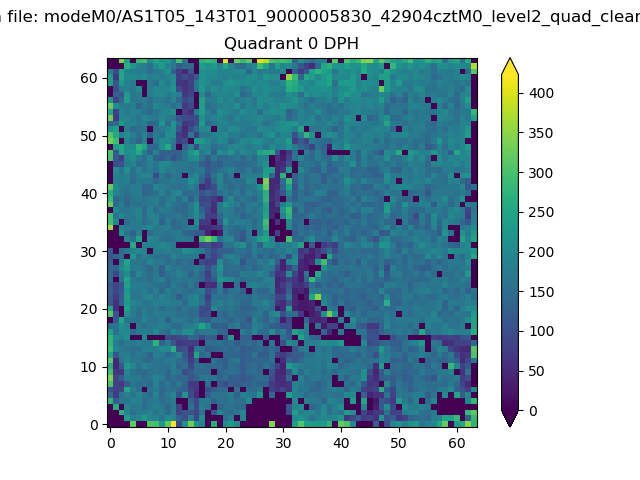 |
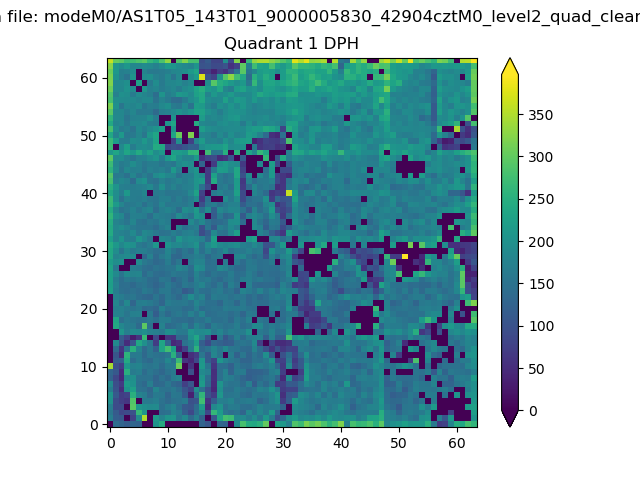 |
Quadrant B |
|---|---|---|---|
| Quadrant D | 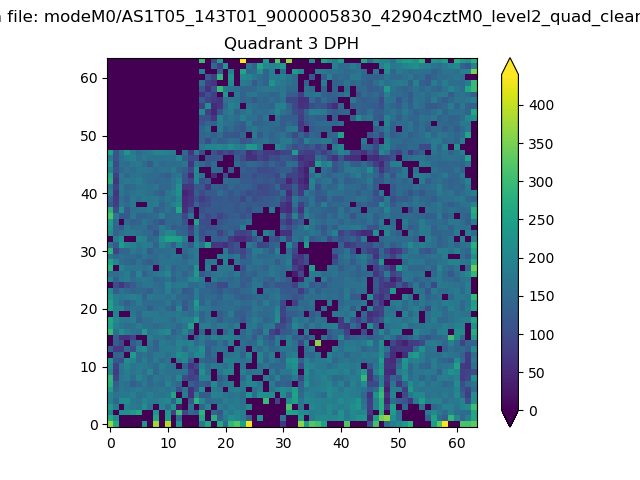 |
 |
Quadrant C |
| Plot type | Count rate plots | Images |
|---|---|---|
| Comparison with Poisson distribution Blue bars denote a histogram of data divided into 1 sec bins. Red curve is a Poisson curve with rate = median count rate of data. |
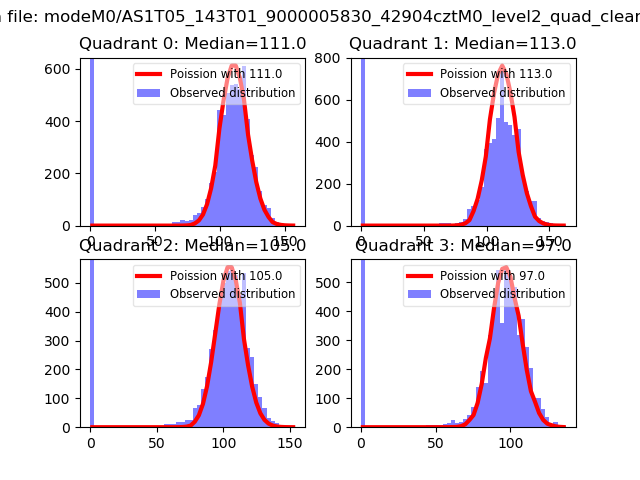 |
 |
| Quadrant-wise count rates Data is divided into 100 sec bins |
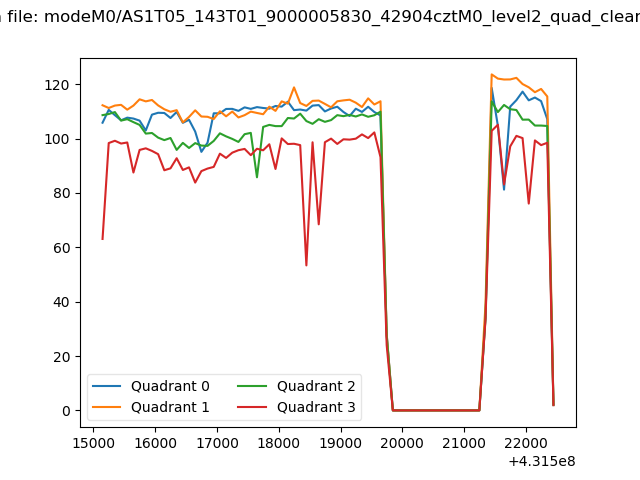 |
|
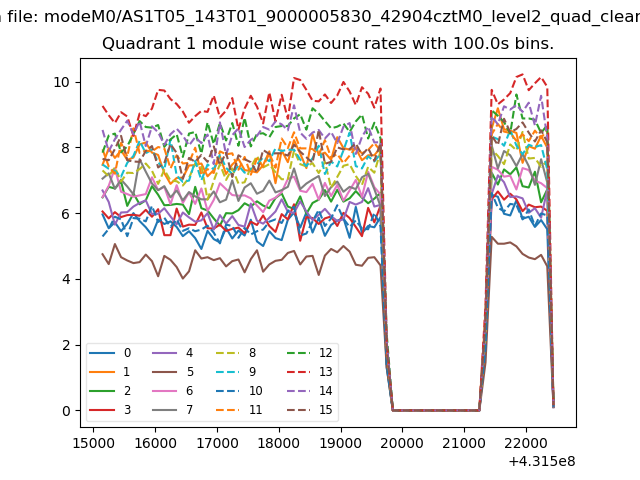
| Module-wise count rates for Quadrant A Data is divided into 100 sec bins |
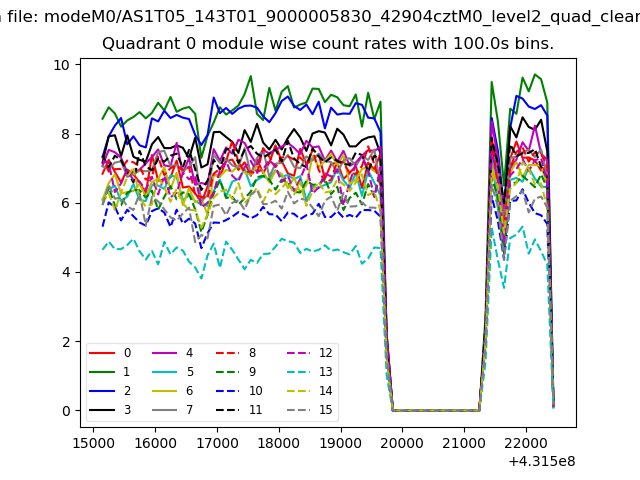 |
 |
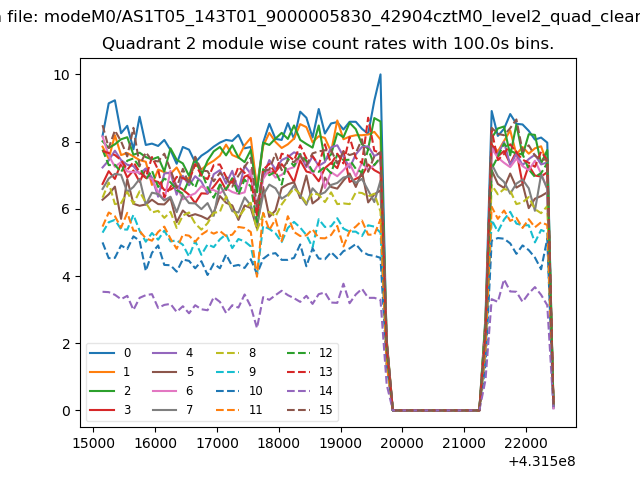
| Module-wise count rates for Quadrant B Data is divided into 100 sec bins |
 |
 |
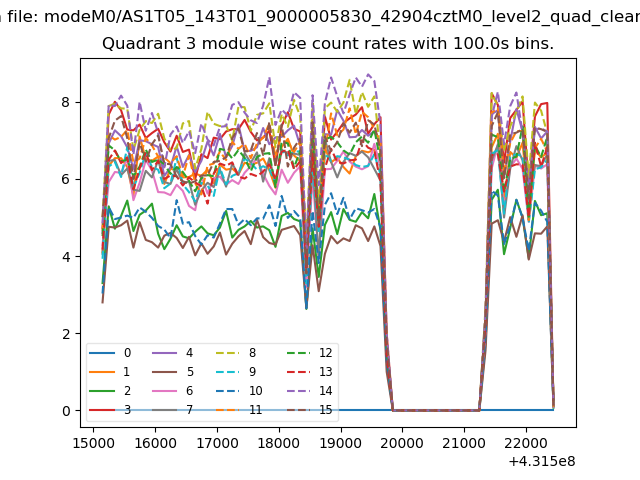
| Module-wise count rates for Quadrant C Data is divided into 100 sec bins |
 |
 |
| Module-wise count rates for Quadrant D Data is divided into 100 sec bins |
 |
 |
| Parameter | Plot |
|---|---|
| CZT HV Monitor | 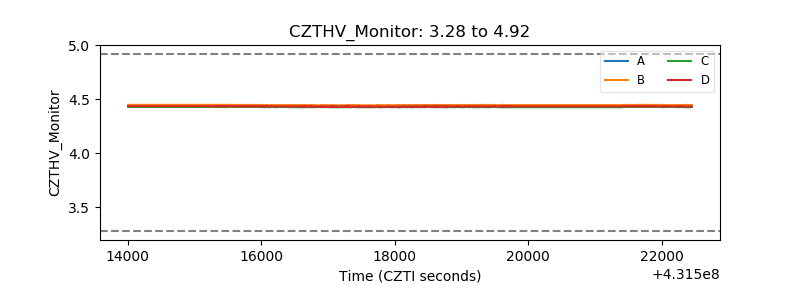 |
| D_VDD | 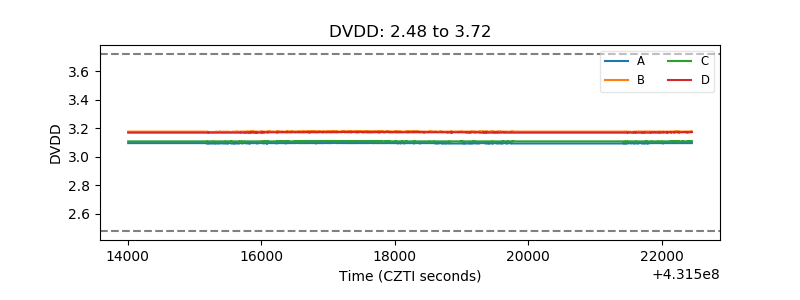 |
| Temperature 1 | 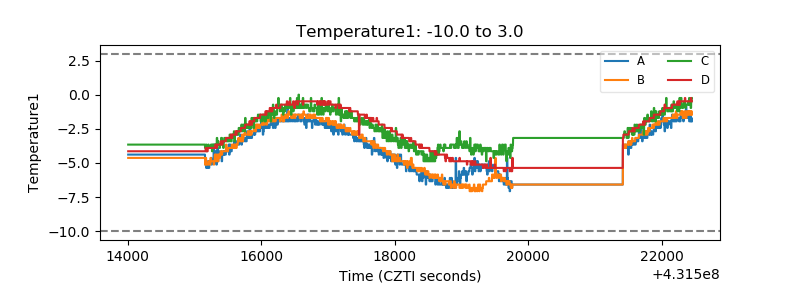 |
| Veto HV Monitor |  |
| Veto LLD | 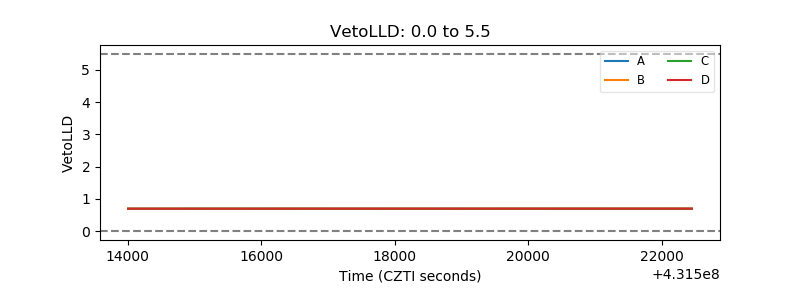 |
| Alpha Counter | 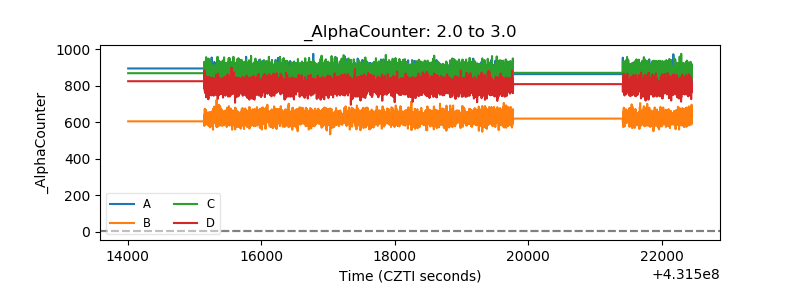 |
| _CPM_Rate | 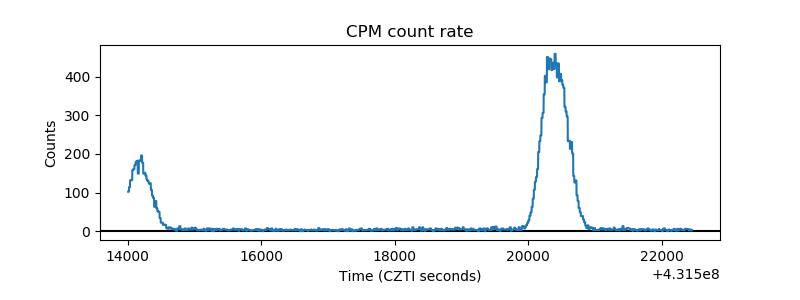 |
| CZT Counter | 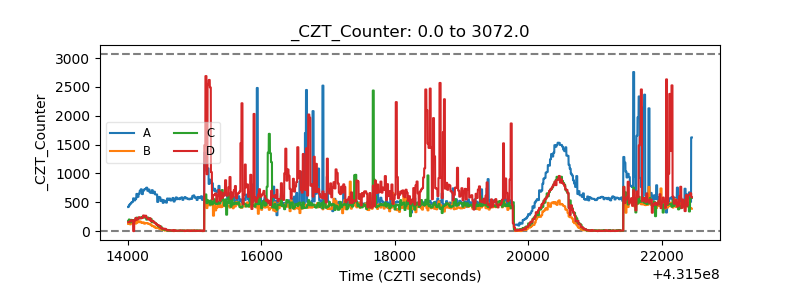 |
| +2.5 Volts monitor | 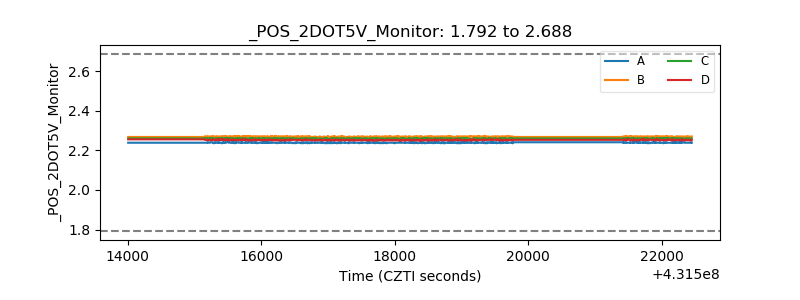 |
| +5 Volts monitor | 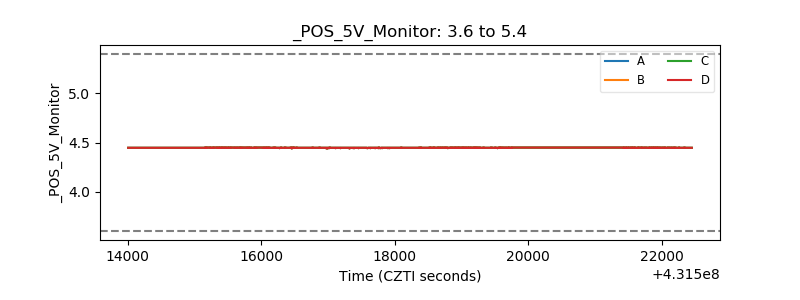 |
| _ROLL_ROT | 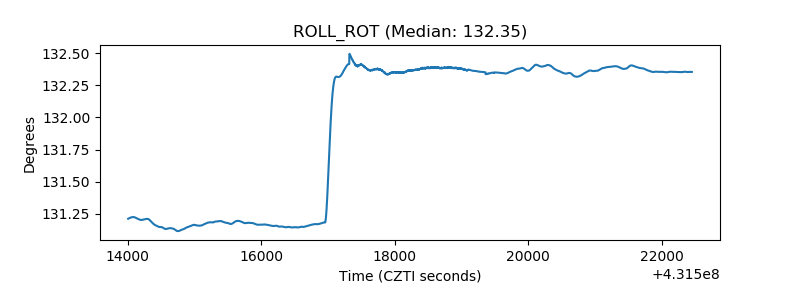 |
| _Roll_DEC | 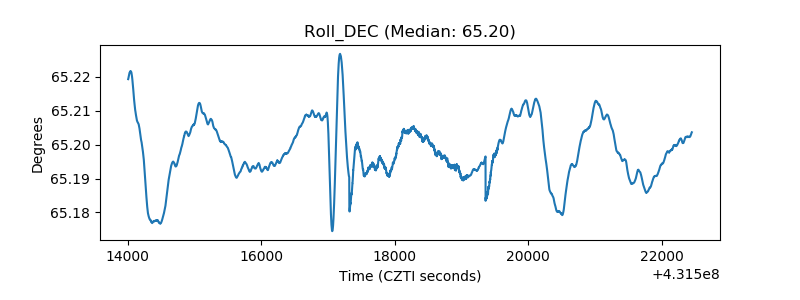 |
| _Roll_RA | 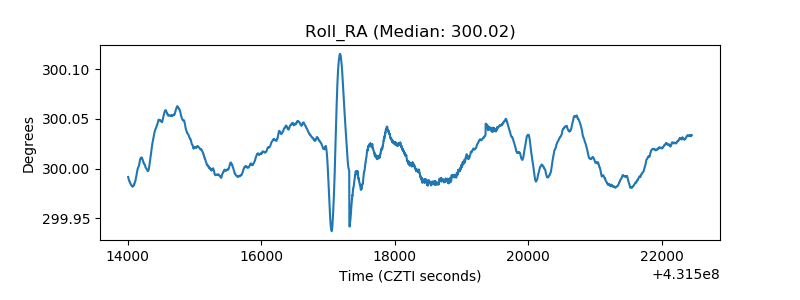 |
| Veto Counter | 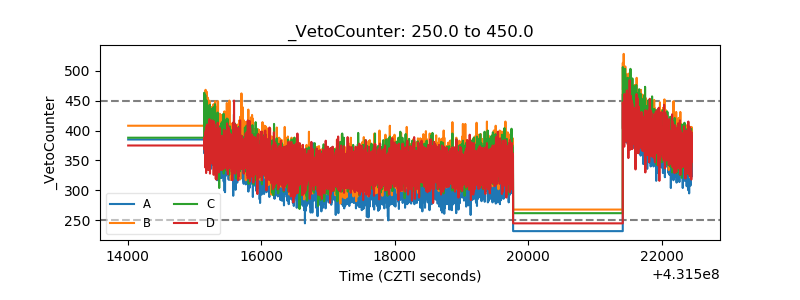 |