| Param | Original file | Final file |
|---|---|---|
| Filename | modeM0/AS1T05_143T01_9000005830_42906cztM0_level2.fits | modeM0/AS1T05_143T01_9000005830_42906cztM0_level2_quad_clean.evt |
| Size (bytes) | 369,529,920 | 90,561,600 |
| Size | 352.4 MB | 86.4 MB |
| Events in quadrant A | 3,591,277 | 613,074 |
| Events in quadrant B | 2,674,606 | 638,284 |
| Events in quadrant C | 2,901,786 | 588,747 |
| Events in quadrant D | 4,085,445 | 519,857 |
| Mode M0 | |||
|---|---|---|---|
| Quadrant | BADHDUFLAG | Total packets | Discarded packets |
| A | 0 | 14047 | 2 |
| B | 0 | 11693 | 2 |
| C | 0 | 12110 | 2 |
| D | 0 | 15845 | 2 |
| Mode M9 | |||
|---|---|---|---|
| Quadrant | BADHDUFLAG | Total packets | Discarded packets |
| A | 0 | 32 | 0 |
| B | 0 | 33 | 0 |
| C | 0 | 33 | 0 |
| D | 0 | 33 | 0 |
| Mode SS | |||
|---|---|---|---|
| Quadrant | BADHDUFLAG | Total packets | Discarded packets |
| A | 0 | 110 | 0 |
| B | 0 | 110 | 0 |
| C | 0 | 110 | 0 |
| D | 0 | 110 | 0 |
| Quadrant | Total seconds | Saturated seconds | Saturation percentage |
|---|---|---|---|
| A | 5466 | 223 | 4.079766% |
| B | 5466 | 41 | 0.750091% |
| C | 5466 | 83 | 1.518478% |
| D | 5466 | 413 | 7.555799% |
Noise dominated data is calculated using 1-second bins in cleaned event files. If a bin has >2000 counts, and if more than 50% of those come from <1% of pixels, then it is considered to be noise-dominated and hence unusable.
| Quadrant | # 1 sec bins | Bins with >0 counts | Bins with >2000 counts | High rate bins dominated by noise | Noise dominated (total time) | Noise dominated (detector-on time) | Marked lightcurve |
|---|---|---|---|---|---|---|---|
| A | 7258 | 5467 | 170 | 170 | 2.34% | 3.11% | 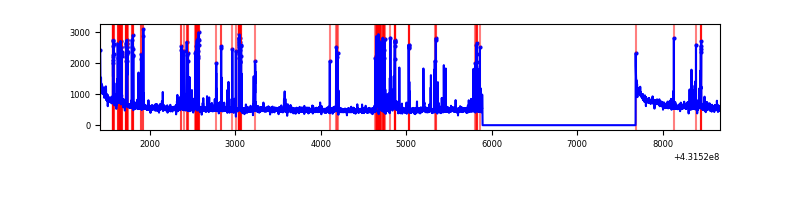 |
| B | 7258 | 5467 | 27 | 27 | 0.37% | 0.49% | 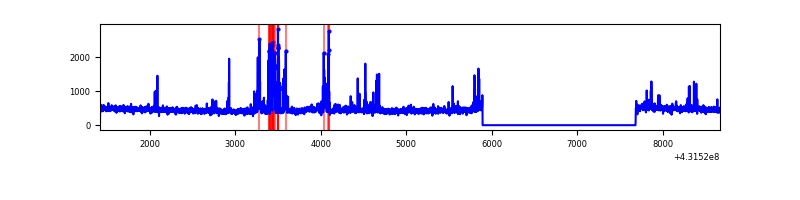 |
| C | 7258 | 5467 | 79 | 79 | 1.09% | 1.45% | 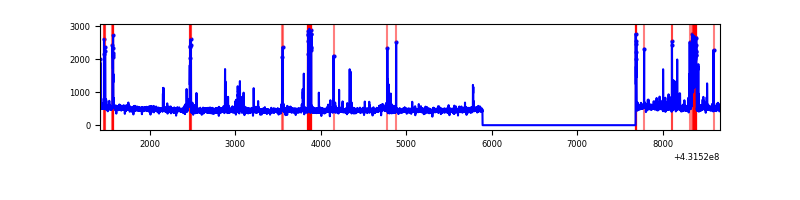 |
| D | 7257 | 5466 | 404 | 404 | 5.57% | 7.39% | 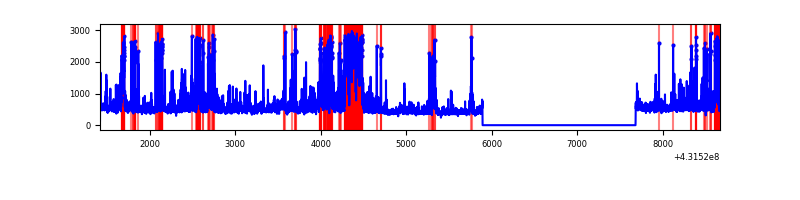 |
Top three noisy pixels from each quadrant. If the there are fewer than three noisy pixels in the level2.evt file, extra rows are filled as -1
| Pixel properties | Quadrant properties | ||||||
|---|---|---|---|---|---|---|---|
| Quadrant | DetID | PixID | Counts | Sigma | Mean | Median | Sigma |
| A | 15 | 237 | 650956 | 5291.47 | 596 | 583 | 122.9 |
| A | 10 | 83 | 606427 | 4929.18 | 596 | 583 | 122.9 |
| A | 13 | 248 | 17097 | 134.36 | 596 | 583 | 122.9 |
| B | 0 | 229 | 197282 | 1691.16 | 599 | 580 | 116.3 |
| B | 4 | 171 | 44626 | 378.69 | 599 | 580 | 116.3 |
| B | 3 | 112 | 42301 | 358.7 | 599 | 580 | 116.3 |
| C | 12 | 2 | 234216 | 1709.55 | 584 | 585 | 136.7 |
| C | 15 | 214 | 229660 | 1676.21 | 584 | 585 | 136.7 |
| C | 14 | 254 | 125953 | 917.36 | 584 | 585 | 136.7 |
| D | 1 | 47 | 555570 | 4021.88 | 570 | 554 | 138.0 |
| D | 1 | 52 | 518961 | 3756.6 | 570 | 554 | 138.0 |
| D | 2 | 249 | 323941 | 2343.4 | 570 | 554 | 138.0 |
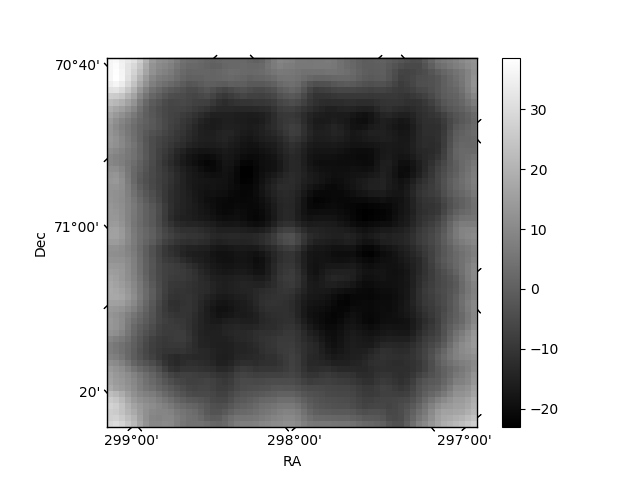
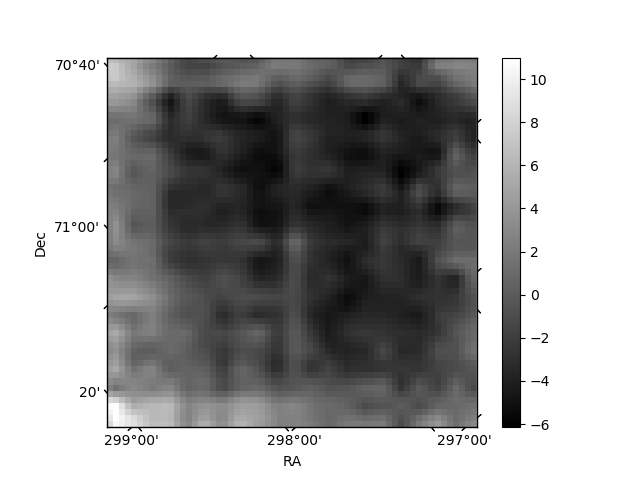
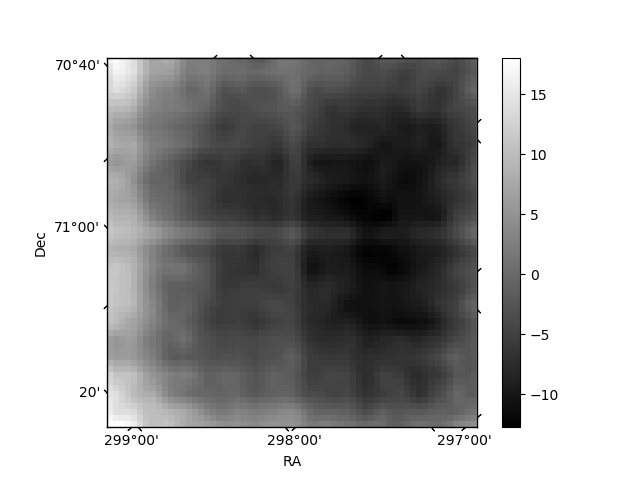
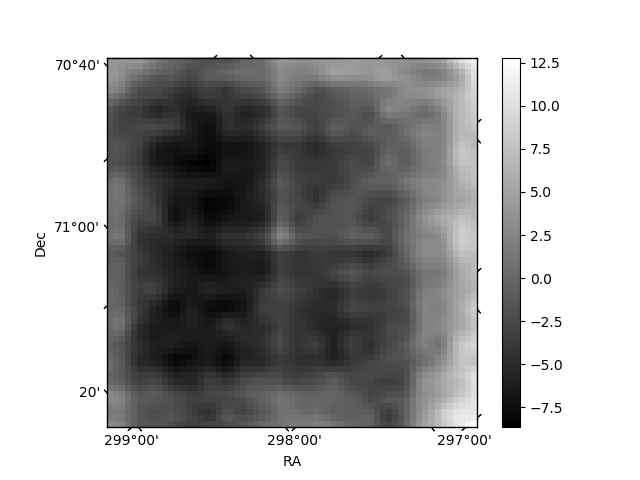
Histogram calculated using DETX and DETY for each event in the final _common_clean file
| Quadrant A | 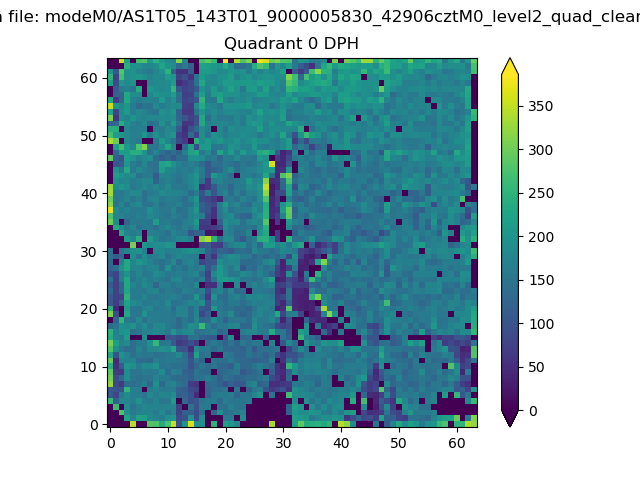 |
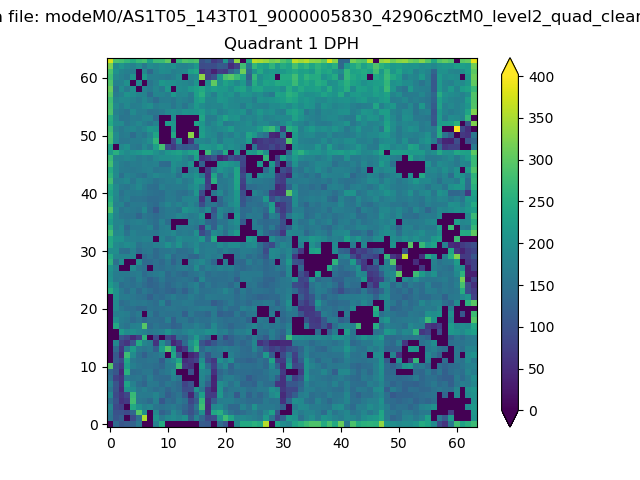 |
Quadrant B |
|---|---|---|---|
| Quadrant D | 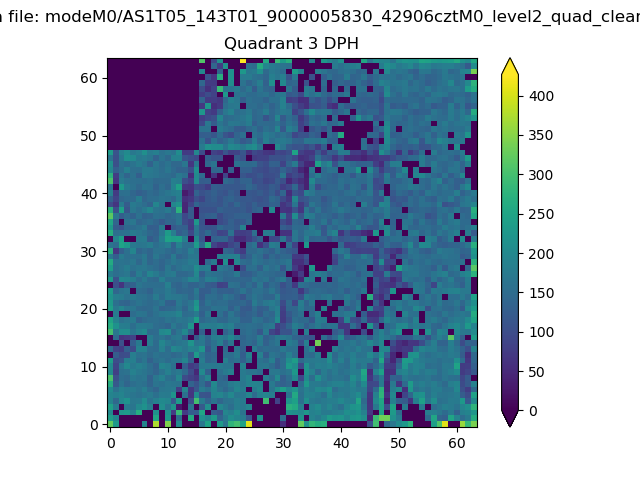 |
 |
Quadrant C |
| Plot type | Count rate plots | Images |
|---|---|---|
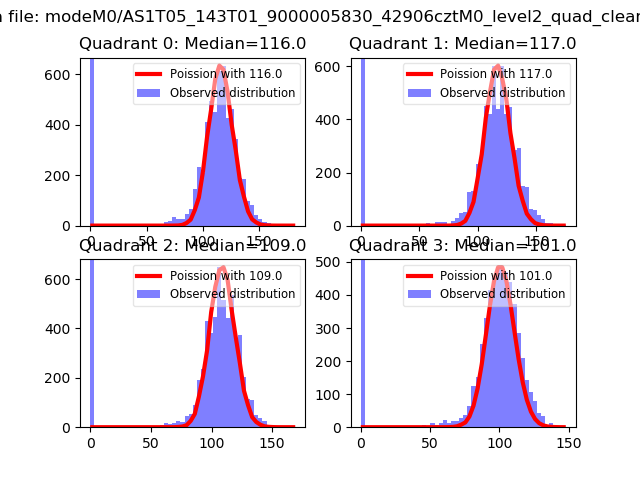
| Comparison with Poisson distribution Blue bars denote a histogram of data divided into 1 sec bins. Red curve is a Poisson curve with rate = median count rate of data. |
 |
 |
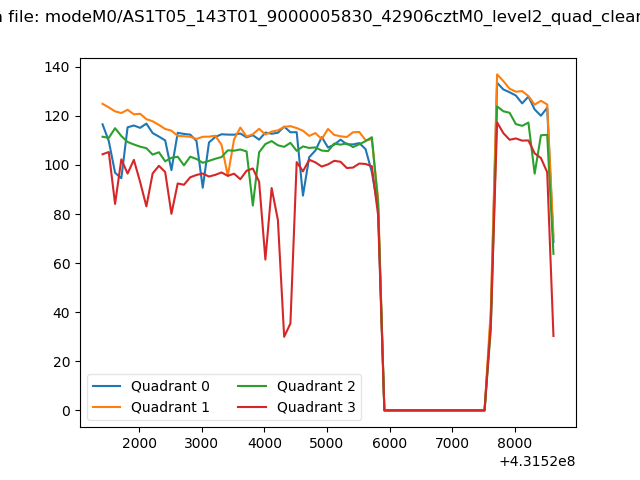
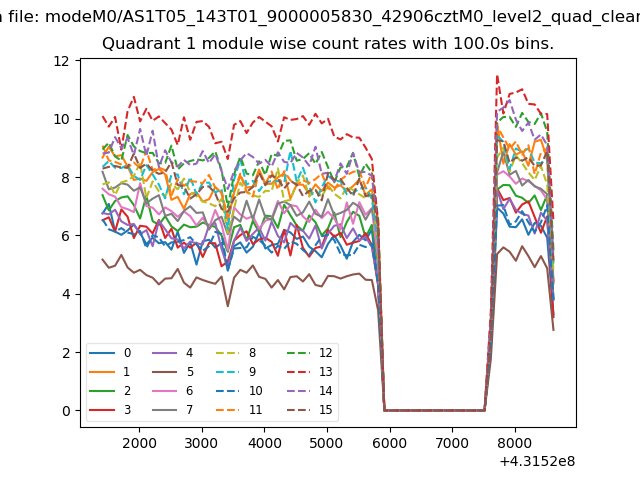
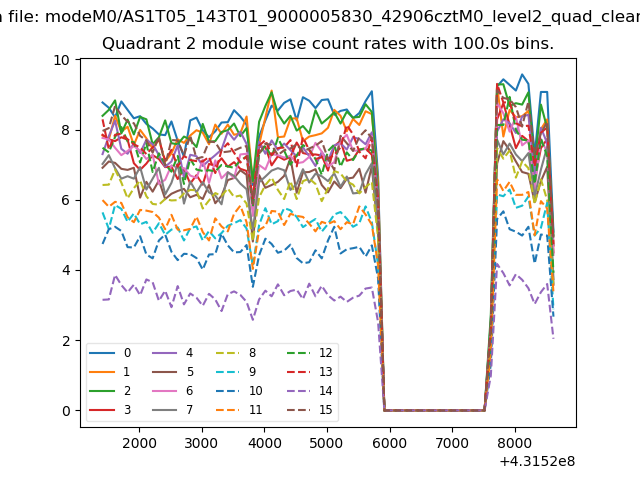
| Quadrant-wise count rates Data is divided into 100 sec bins |
 |
|
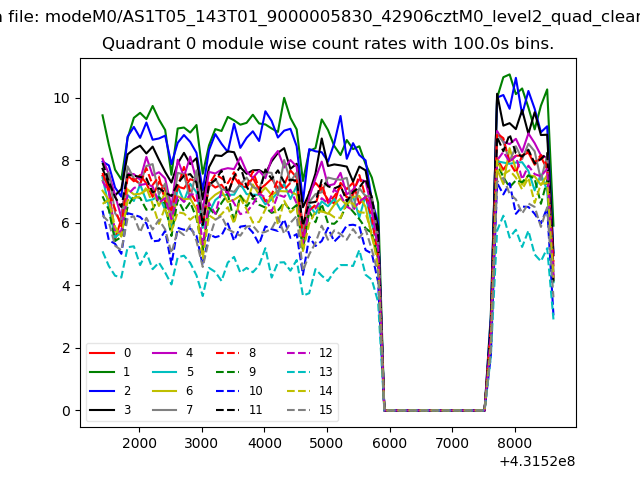
| Module-wise count rates for Quadrant A Data is divided into 100 sec bins |
 |
 |
| Module-wise count rates for Quadrant B Data is divided into 100 sec bins |
 |
 |
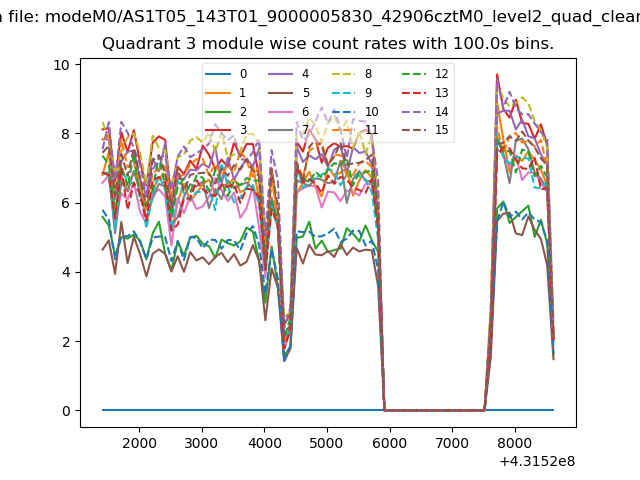
| Module-wise count rates for Quadrant C Data is divided into 100 sec bins |
 |
 |
| Module-wise count rates for Quadrant D Data is divided into 100 sec bins |
 |
 |
| Parameter | Plot |
|---|---|
| CZT HV Monitor | 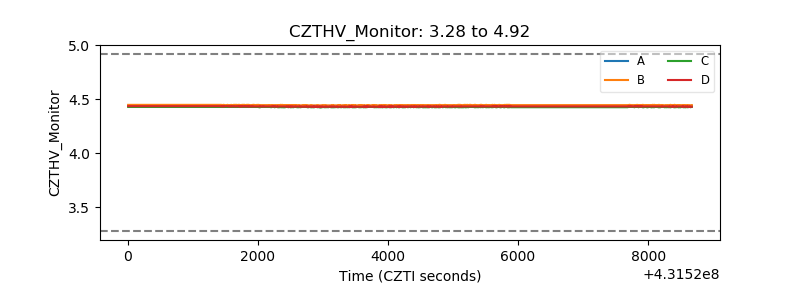 |
| D_VDD | 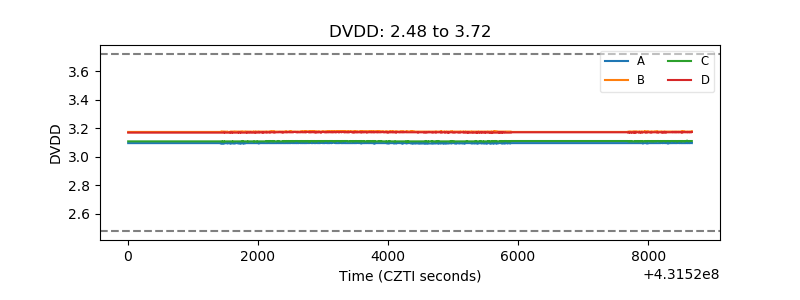 |
| Temperature 1 | 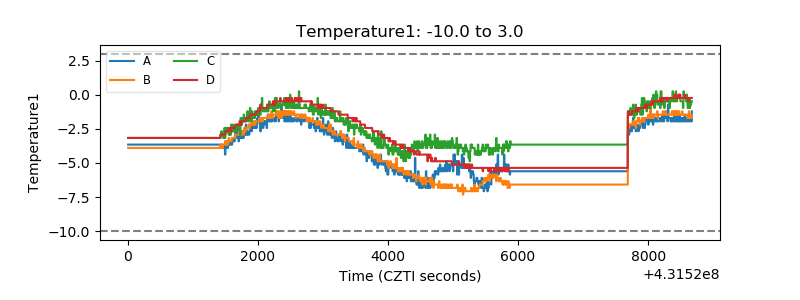 |
| Veto HV Monitor | 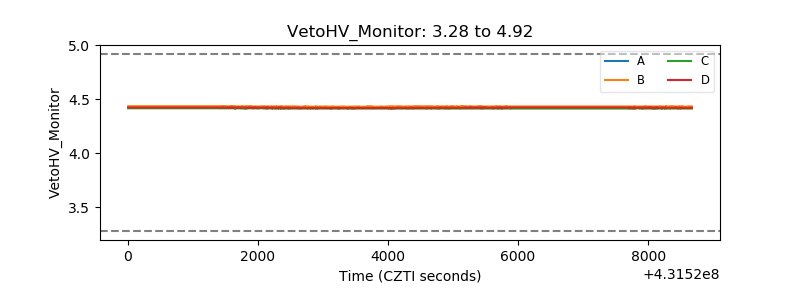 |
| Veto LLD | 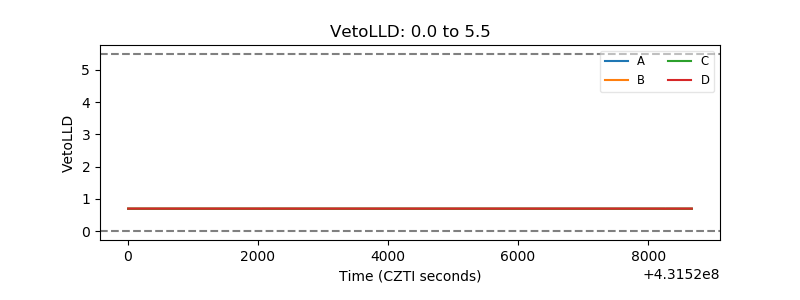 |
| Alpha Counter | 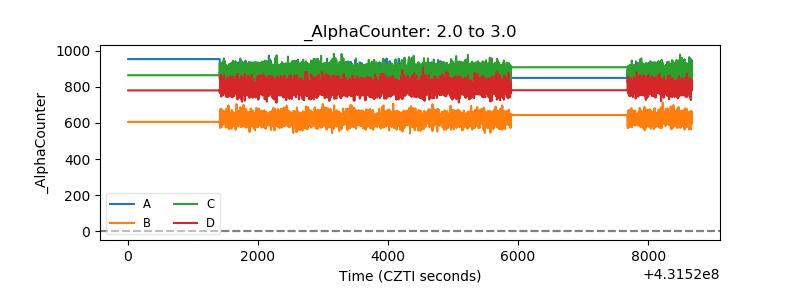 |
| _CPM_Rate | 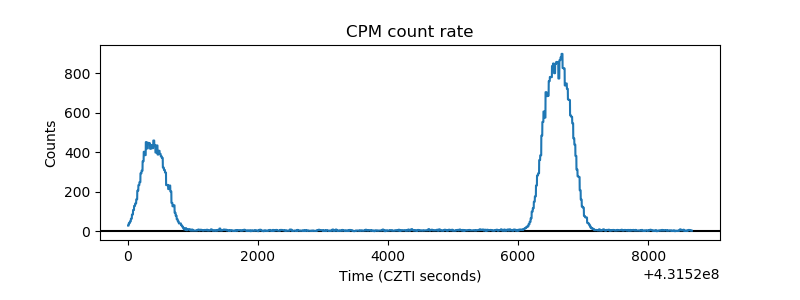 |
| CZT Counter | 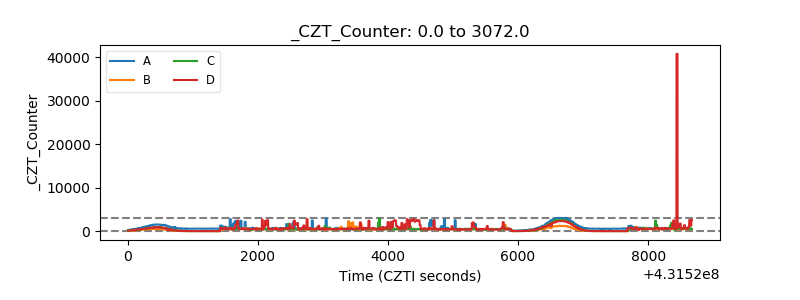 |
| +2.5 Volts monitor | 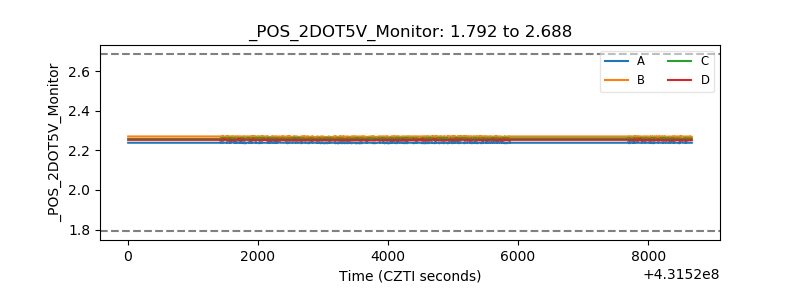 |
| +5 Volts monitor | 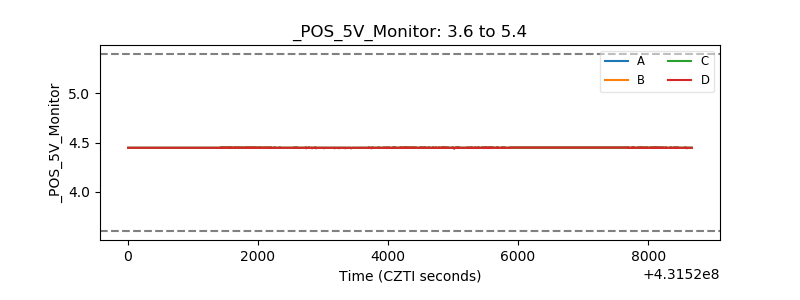 |
| _ROLL_ROT | 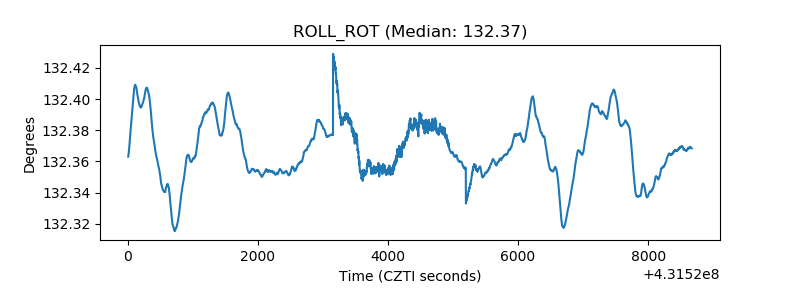 |
| _Roll_DEC | 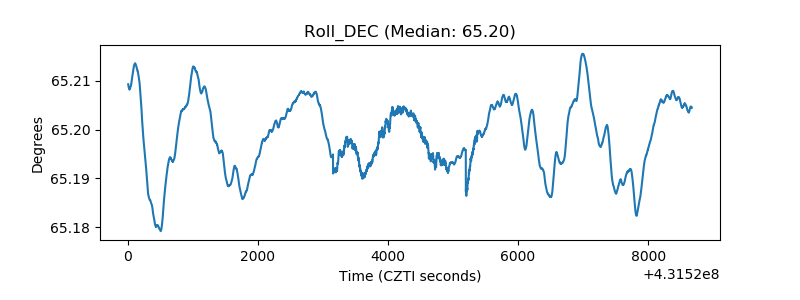 |
| _Roll_RA | 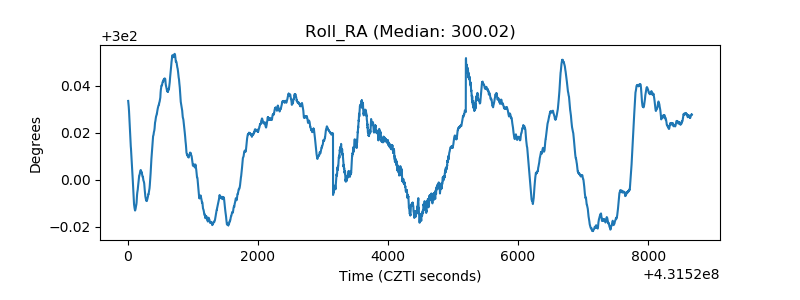 |
| Veto Counter | 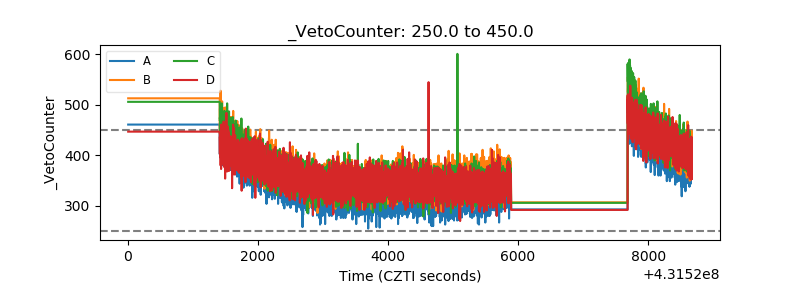 |