| Param | Original file | Final file |
|---|---|---|
| Filename | modeM0/AS1T05_143T01_9000005830_42907cztM0_level2.fits | modeM0/AS1T05_143T01_9000005830_42907cztM0_level2_quad_clean.evt |
| Size (bytes) | 345,283,200 | 84,991,680 |
| Size | 329.3 MB | 81.1 MB |
| Events in quadrant A | 3,265,388 | 574,039 |
| Events in quadrant B | 2,255,639 | 601,145 |
| Events in quadrant C | 2,674,543 | 559,261 |
| Events in quadrant D | 4,198,713 | 490,924 |
| Mode M0 | |||
|---|---|---|---|
| Quadrant | BADHDUFLAG | Total packets | Discarded packets |
| A | 0 | 12827 | 1 |
| B | 0 | 10168 | 1 |
| C | 0 | 11095 | 1 |
| D | 0 | 15886 | 1 |
| Mode M9 | |||
|---|---|---|---|
| Quadrant | BADHDUFLAG | Total packets | Discarded packets |
| A | 0 | 19 | 0 |
| B | 0 | 19 | 0 |
| C | 0 | 19 | 0 |
| D | 0 | 19 | 0 |
| Mode SS | |||
|---|---|---|---|
| Quadrant | BADHDUFLAG | Total packets | Discarded packets |
| A | 0 | 100 | 0 |
| B | 0 | 100 | 0 |
| C | 0 | 100 | 0 |
| D | 0 | 100 | 0 |
| Quadrant | Total seconds | Saturated seconds | Saturation percentage |
|---|---|---|---|
| A | 4967 | 208 | 4.187638% |
| B | 4968 | 13 | 0.261675% |
| C | 4968 | 61 | 1.227858% |
| D | 4968 | 427 | 8.595008% |
Noise dominated data is calculated using 1-second bins in cleaned event files. If a bin has >2000 counts, and if more than 50% of those come from <1% of pixels, then it is considered to be noise-dominated and hence unusable.
| Quadrant | # 1 sec bins | Bins with >0 counts | Bins with >2000 counts | High rate bins dominated by noise | Noise dominated (total time) | Noise dominated (detector-on time) | Marked lightcurve |
|---|---|---|---|---|---|---|---|
| A | 6849 | 4967 | 193 | 193 | 2.82% | 3.89% | 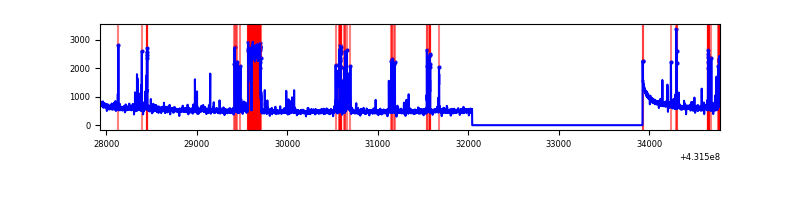 |
| B | 6851 | 4969 | 4 | 4 | 0.06% | 0.08% | 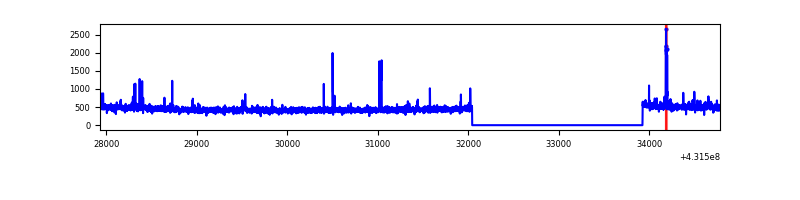 |
| C | 6851 | 4969 | 60 | 60 | 0.88% | 1.21% | 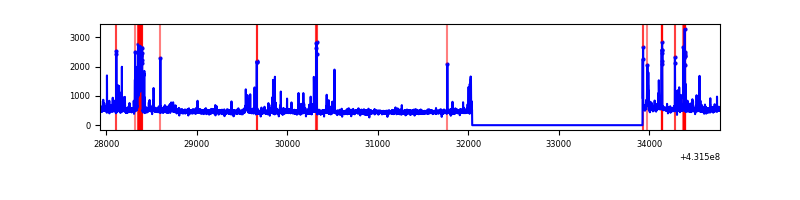 |
| D | 6851 | 4969 | 465 | 465 | 6.79% | 9.36% | 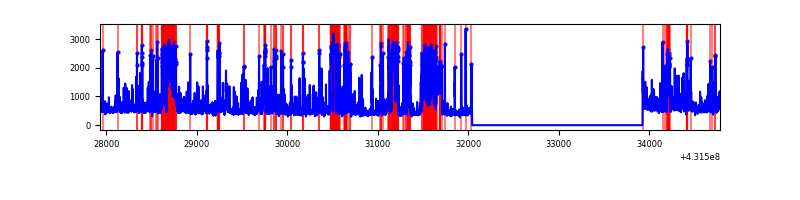 |
Top three noisy pixels from each quadrant. If the there are fewer than three noisy pixels in the level2.evt file, extra rows are filled as -1
| Pixel properties | Quadrant properties | ||||||
|---|---|---|---|---|---|---|---|
| Quadrant | DetID | PixID | Counts | Sigma | Mean | Median | Sigma |
| A | 15 | 237 | 647765 | 5838.41 | 543 | 533 | 110.9 |
| A | 10 | 83 | 496337 | 4472.44 | 543 | 533 | 110.9 |
| A | 2 | 79 | 11181 | 96.05 | 543 | 533 | 110.9 |
| B | 0 | 229 | 28261 | 262.67 | 550 | 536 | 105.6 |
| B | 0 | 159 | 16111 | 147.56 | 550 | 536 | 105.6 |
| B | 3 | 112 | 13632 | 124.07 | 550 | 536 | 105.6 |
| C | 15 | 214 | 198966 | 1567.7 | 541 | 544 | 126.6 |
| C | 14 | 254 | 168598 | 1327.76 | 541 | 544 | 126.6 |
| C | 12 | 2 | 153041 | 1204.85 | 541 | 544 | 126.6 |
| D | 1 | 52 | 741236 | 5892.92 | 521 | 507 | 125.7 |
| D | 1 | 47 | 367135 | 2916.73 | 521 | 507 | 125.7 |
| D | 5 | 70 | 306689 | 2435.85 | 521 | 507 | 125.7 |
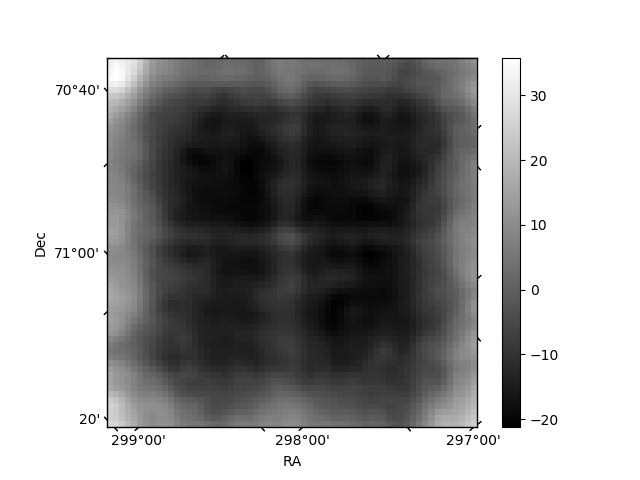
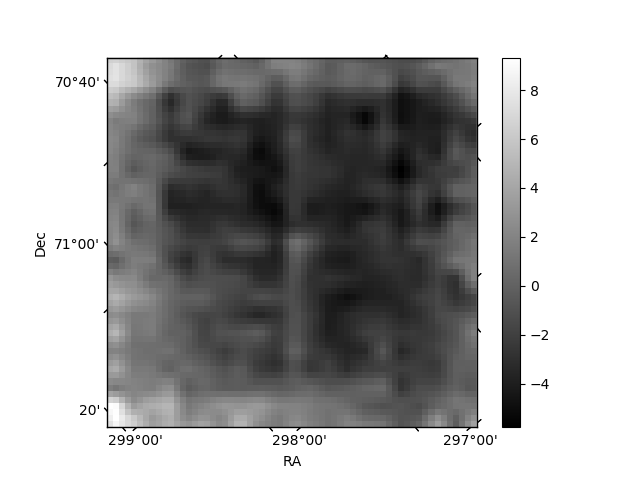
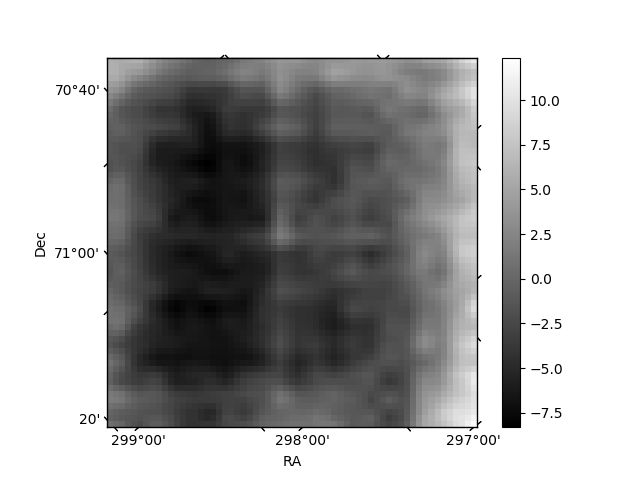
Histogram calculated using DETX and DETY for each event in the final _common_clean file
| Quadrant A | 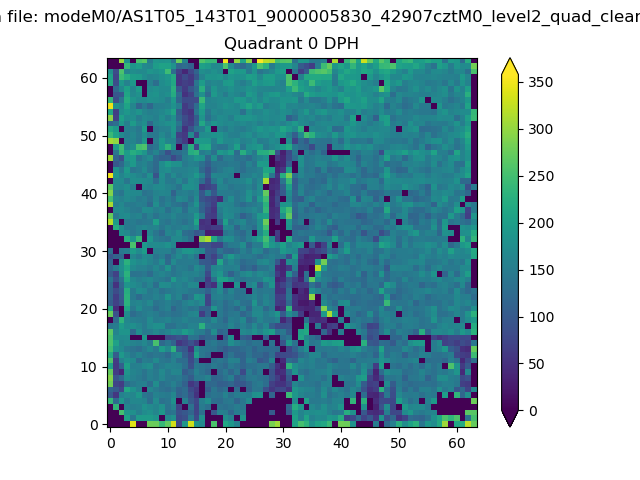 |
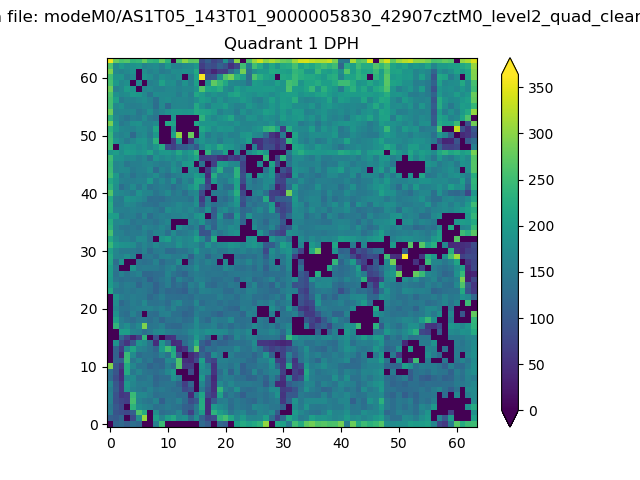 |
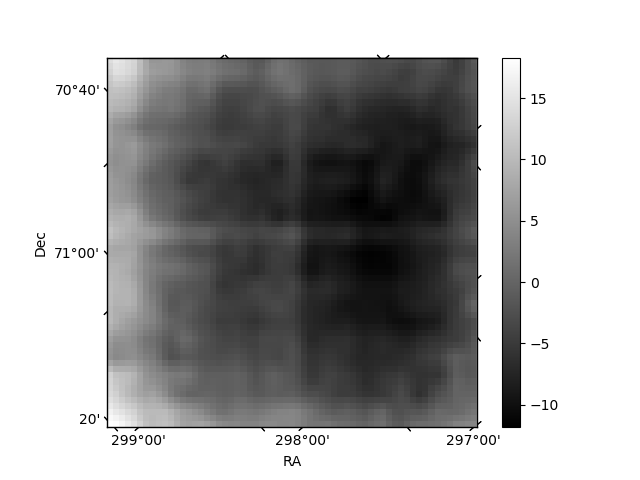
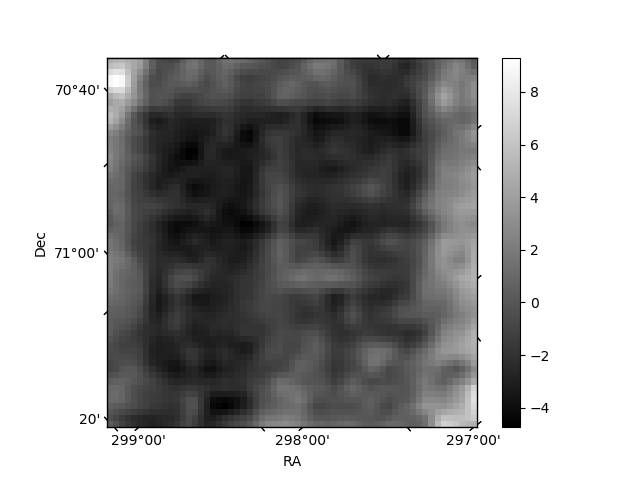
Quadrant B |
|---|---|---|---|
| Quadrant D | 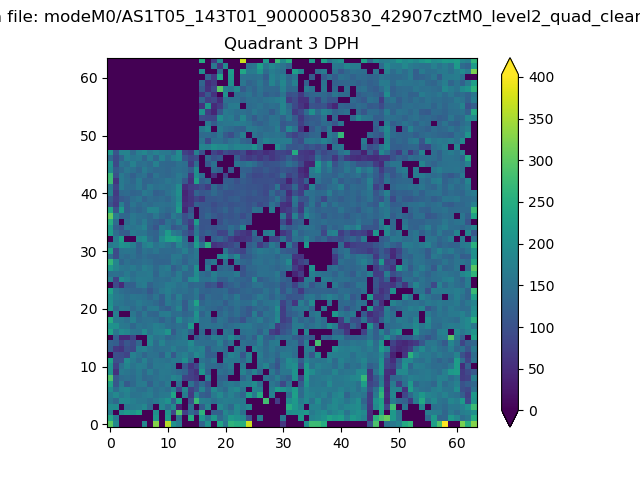 |
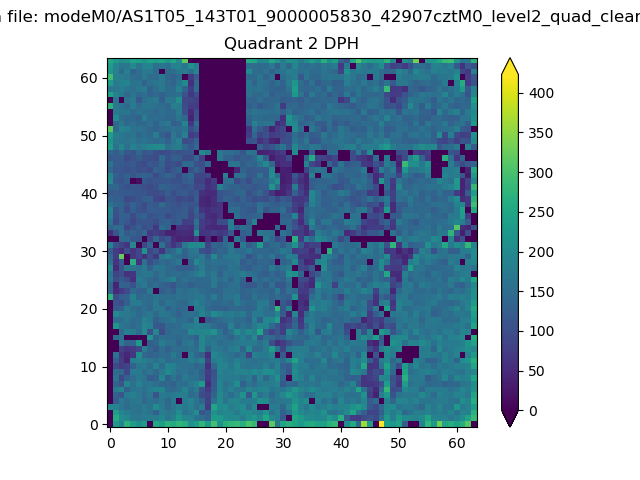 |
Quadrant C |
| Plot type | Count rate plots | Images |
|---|---|---|
| Comparison with Poisson distribution Blue bars denote a histogram of data divided into 1 sec bins. Red curve is a Poisson curve with rate = median count rate of data. |
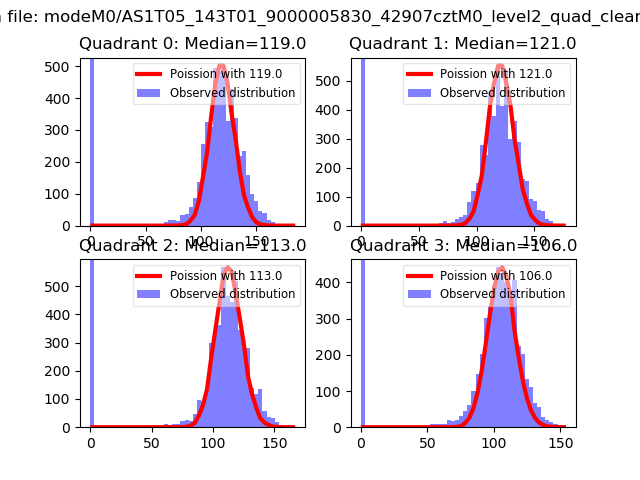 |
 |
| Quadrant-wise count rates Data is divided into 100 sec bins |
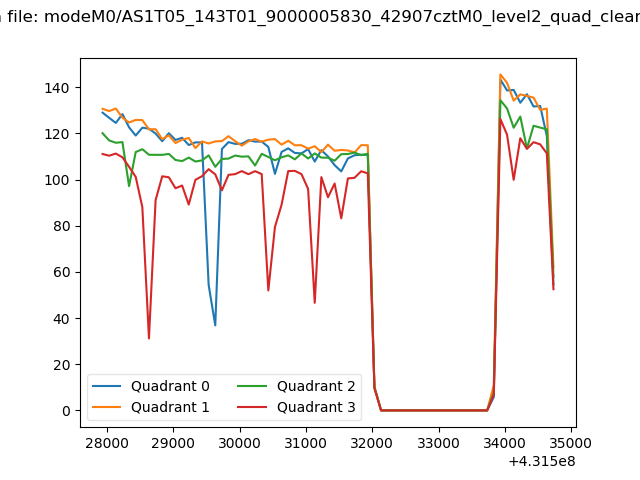 |
|
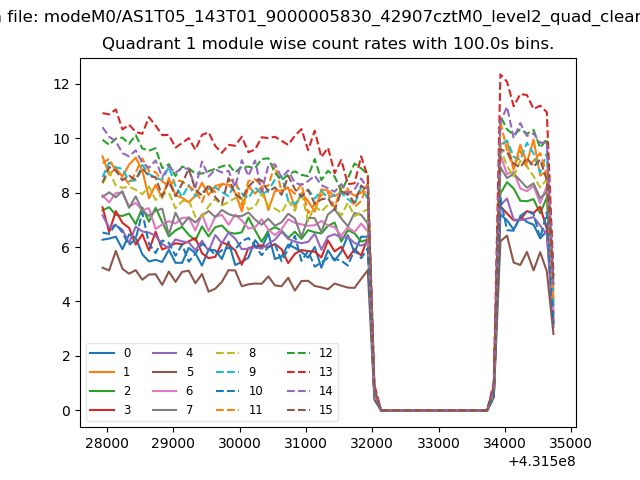
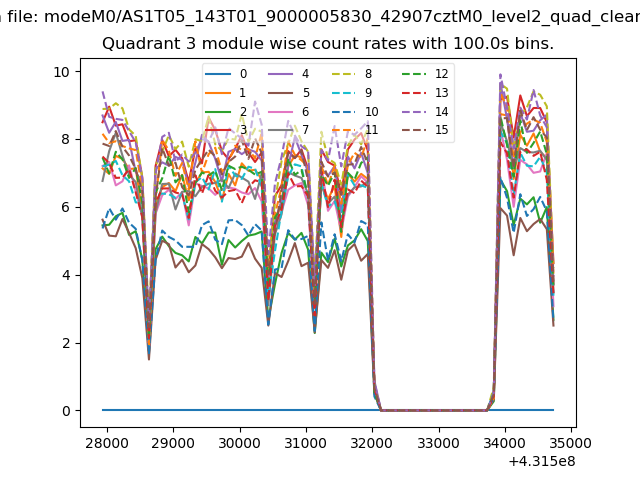
| Module-wise count rates for Quadrant A Data is divided into 100 sec bins |
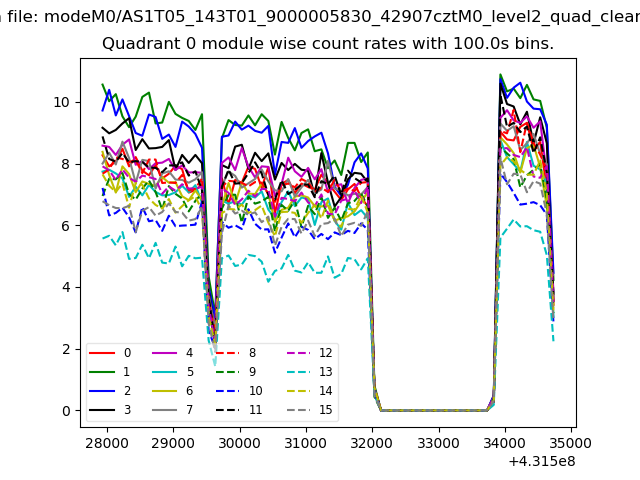 |
 |
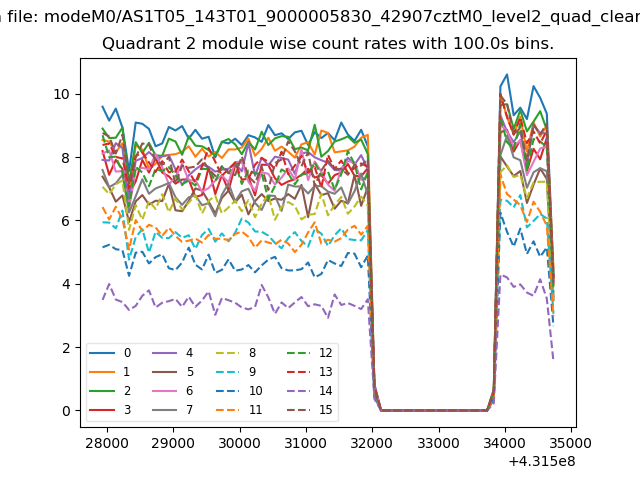
| Module-wise count rates for Quadrant B Data is divided into 100 sec bins |
 |
 |
| Module-wise count rates for Quadrant C Data is divided into 100 sec bins |
 |
 |
| Module-wise count rates for Quadrant D Data is divided into 100 sec bins |
 |
 |
| Parameter | Plot |
|---|---|
| CZT HV Monitor | 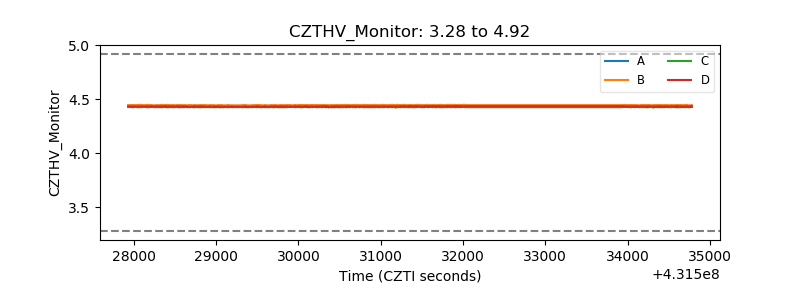 |
| D_VDD | 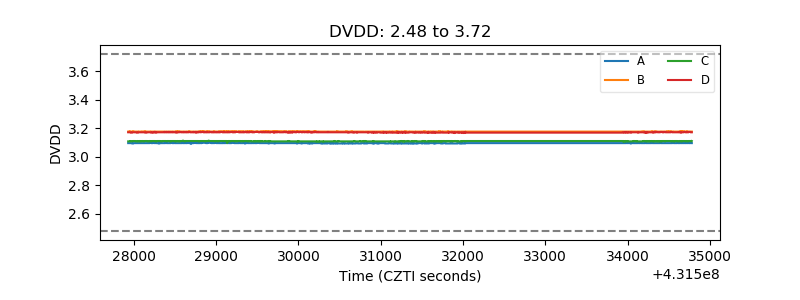 |
| Temperature 1 | 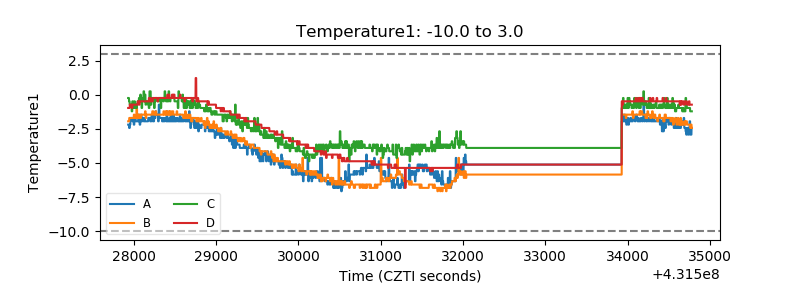 |
| Veto HV Monitor |  |
| Veto LLD | 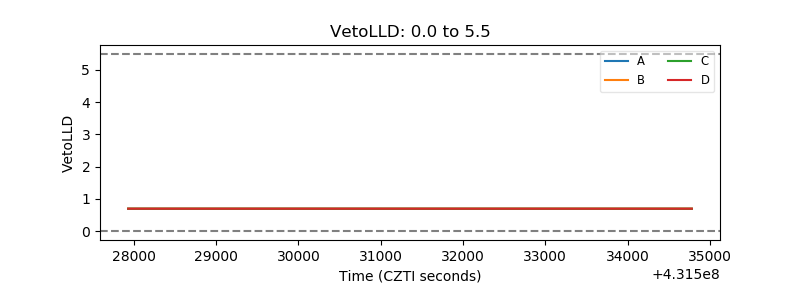 |
| Alpha Counter | 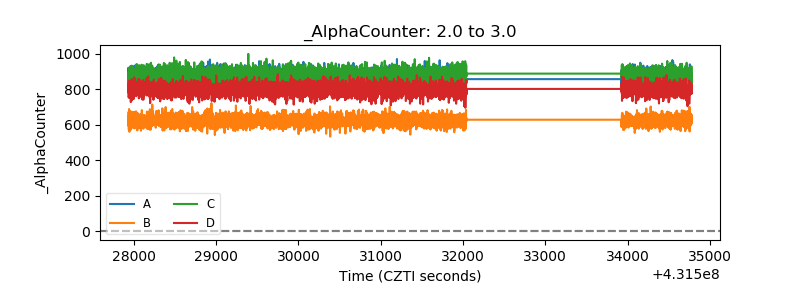 |
| _CPM_Rate |  |
| CZT Counter | 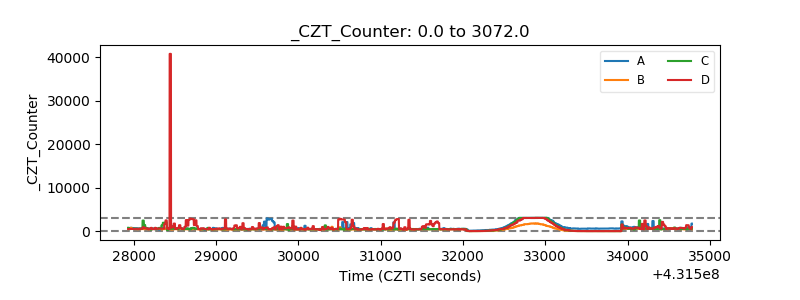 |
| +2.5 Volts monitor | 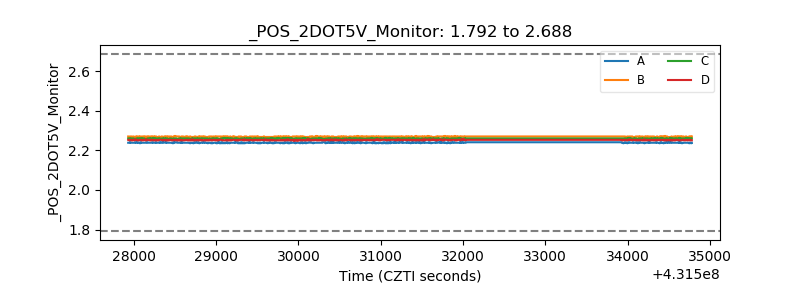 |
| +5 Volts monitor | 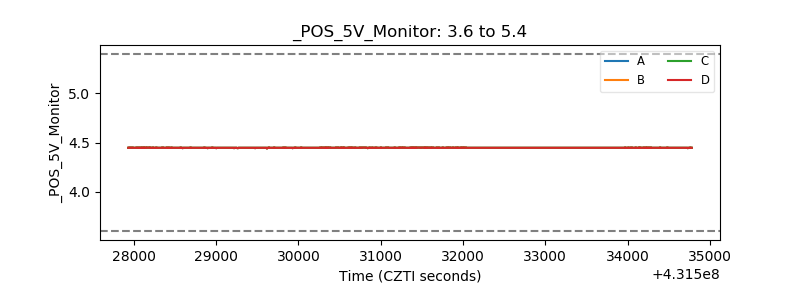 |
| _ROLL_ROT | 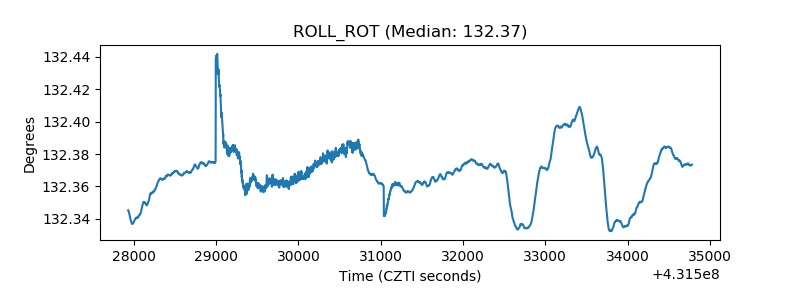 |
| _Roll_DEC | 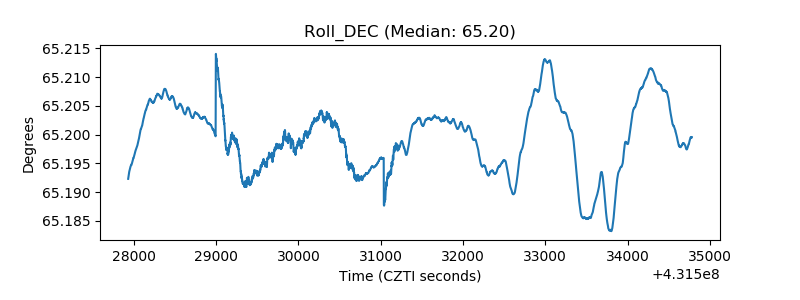 |
| _Roll_RA | 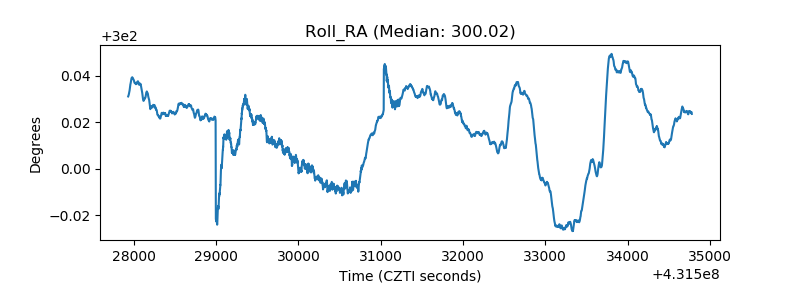 |
| Veto Counter | 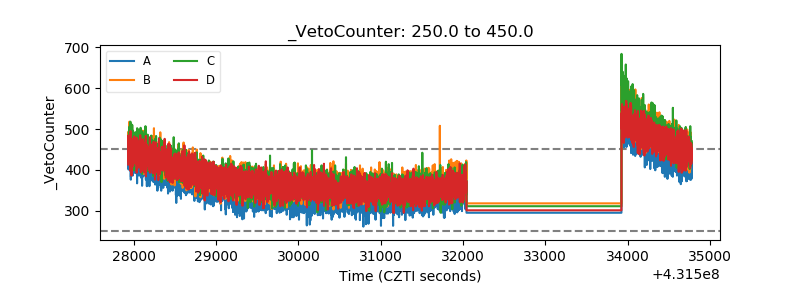 |