| Param | Original file | Final file |
|---|---|---|
| Filename | modeM0/AS1T05_143T01_9000005830_42908cztM0_level2.fits | modeM0/AS1T05_143T01_9000005830_42908cztM0_level2_quad_clean.evt |
| Size (bytes) | 338,506,560 | 89,124,480 |
| Size | 322.8 MB | 85.0 MB |
| Events in quadrant A | 3,244,996 | 605,235 |
| Events in quadrant B | 2,282,323 | 625,851 |
| Events in quadrant C | 2,665,610 | 591,942 |
| Events in quadrant D | 3,947,371 | 524,730 |
| Mode M0 | |||
|---|---|---|---|
| Quadrant | BADHDUFLAG | Total packets | Discarded packets |
| A | 0 | 12852 | 1 |
| B | 0 | 10161 | 1 |
| C | 0 | 10985 | 1 |
| D | 0 | 15179 | 1 |
| Mode M9 | |||
|---|---|---|---|
| Quadrant | BADHDUFLAG | Total packets | Discarded packets |
| A | 0 | 20 | 0 |
| B | 0 | 20 | 0 |
| C | 0 | 20 | 0 |
| D | 0 | 20 | 0 |
| Mode SS | |||
|---|---|---|---|
| Quadrant | BADHDUFLAG | Total packets | Discarded packets |
| A | 0 | 102 | 0 |
| B | 0 | 102 | 0 |
| C | 0 | 102 | 0 |
| D | 0 | 102 | 0 |
| Quadrant | Total seconds | Saturated seconds | Saturation percentage |
|---|---|---|---|
| A | 5007 | 149 | 2.975834% |
| B | 5008 | 15 | 0.299521% |
| C | 5008 | 25 | 0.499201% |
| D | 5007 | 321 | 6.411025% |
Noise dominated data is calculated using 1-second bins in cleaned event files. If a bin has >2000 counts, and if more than 50% of those come from <1% of pixels, then it is considered to be noise-dominated and hence unusable.
| Quadrant | # 1 sec bins | Bins with >0 counts | Bins with >2000 counts | High rate bins dominated by noise | Noise dominated (total time) | Noise dominated (detector-on time) | Marked lightcurve |
|---|---|---|---|---|---|---|---|
| A | 7011 | 5008 | 130 | 130 | 1.85% | 2.60% | 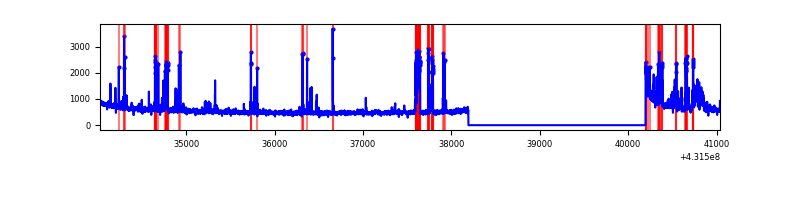 |
| B | 7012 | 5009 | 4 | 4 | 0.06% | 0.08% | 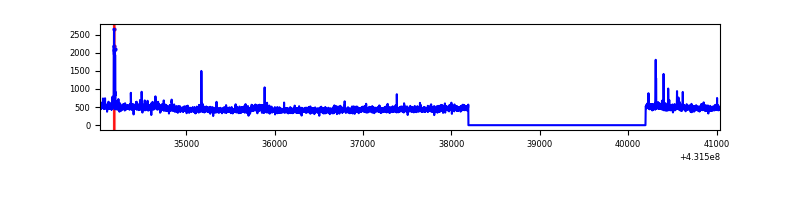 |
| C | 7012 | 5009 | 25 | 25 | 0.36% | 0.50% | 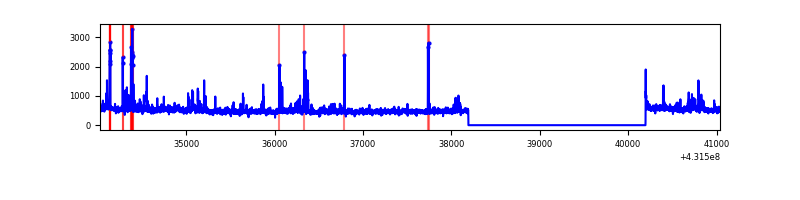 |
| D | 7011 | 5008 | 332 | 332 | 4.74% | 6.63% | 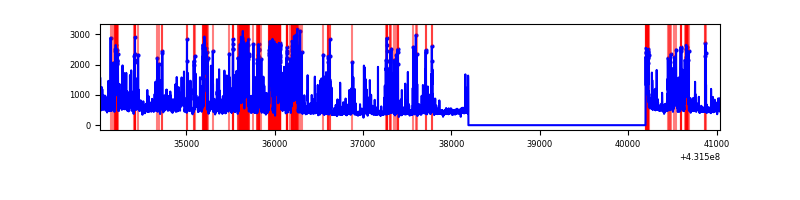 |
Top three noisy pixels from each quadrant. If the there are fewer than three noisy pixels in the level2.evt file, extra rows are filled as -1
| Pixel properties | Quadrant properties | ||||||
|---|---|---|---|---|---|---|---|
| Quadrant | DetID | PixID | Counts | Sigma | Mean | Median | Sigma |
| A | 10 | 83 | 528057 | 4575.84 | 559 | 549 | 115.3 |
| A | 15 | 237 | 373952 | 3239.07 | 559 | 549 | 115.3 |
| A | 15 | 190 | 140784 | 1216.46 | 559 | 549 | 115.3 |
| B | 0 | 229 | 25950 | 238.06 | 563 | 548 | 106.7 |
| B | 0 | 230 | 17008 | 154.26 | 563 | 548 | 106.7 |
| B | 12 | 111 | 12689 | 113.78 | 563 | 548 | 106.7 |
| C | 15 | 214 | 201903 | 1555.41 | 557 | 560 | 129.4 |
| C | 14 | 254 | 129470 | 995.85 | 557 | 560 | 129.4 |
| C | 8 | 79 | 58933 | 450.94 | 557 | 560 | 129.4 |
| D | 1 | 52 | 704538 | 5357.19 | 543 | 527 | 131.4 |
| D | 1 | 47 | 528172 | 4015.13 | 543 | 527 | 131.4 |
| D | 10 | 118 | 176860 | 1341.81 | 543 | 527 | 131.4 |
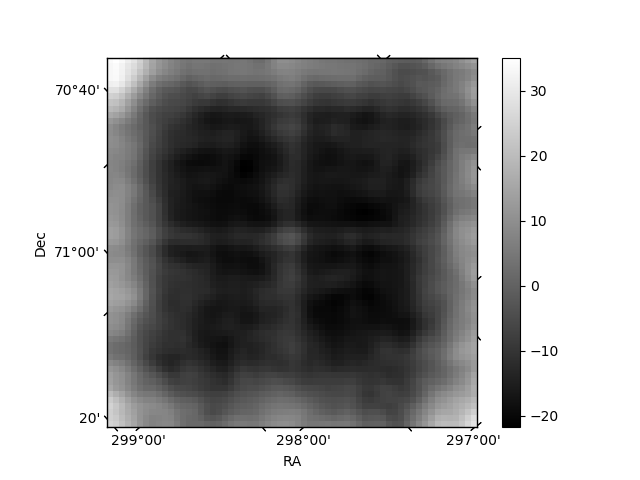
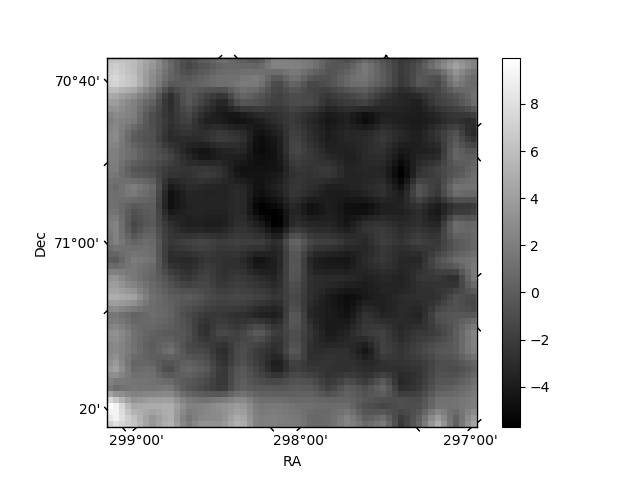
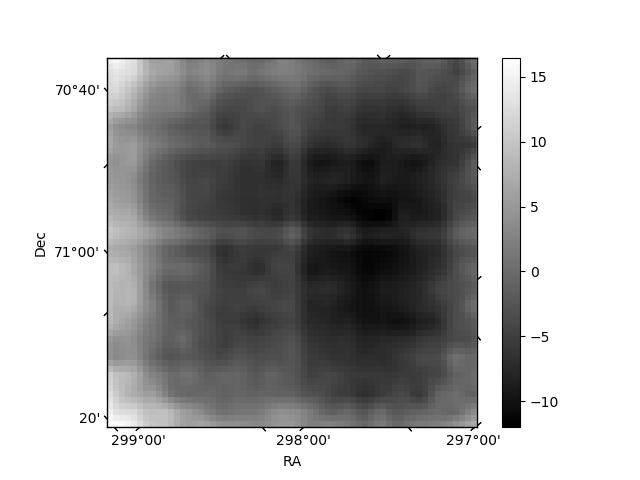
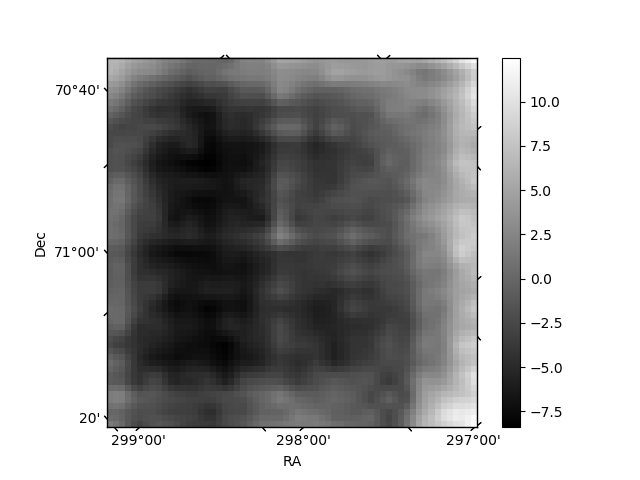
Histogram calculated using DETX and DETY for each event in the final _common_clean file
| Quadrant A | 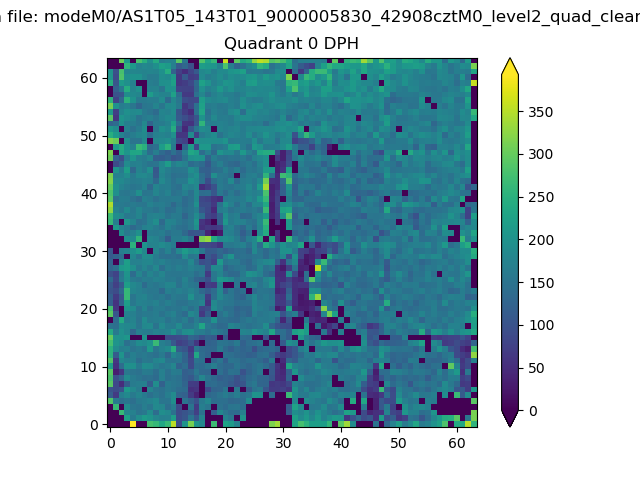 |
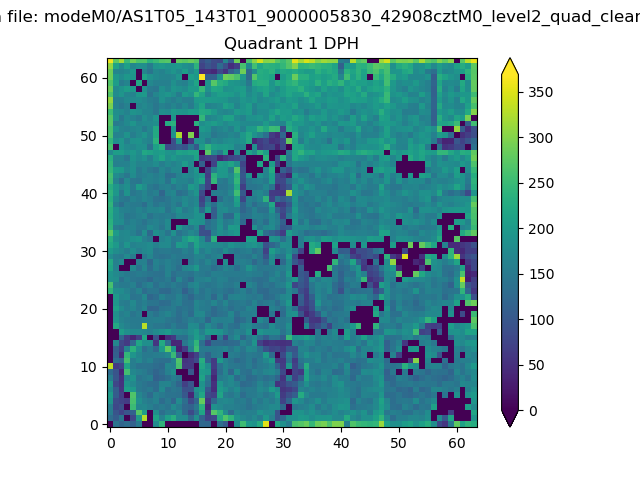 |
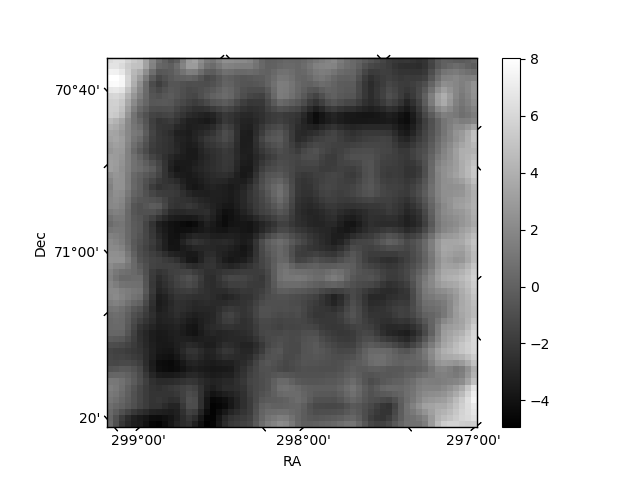
Quadrant B |
|---|---|---|---|
| Quadrant D | 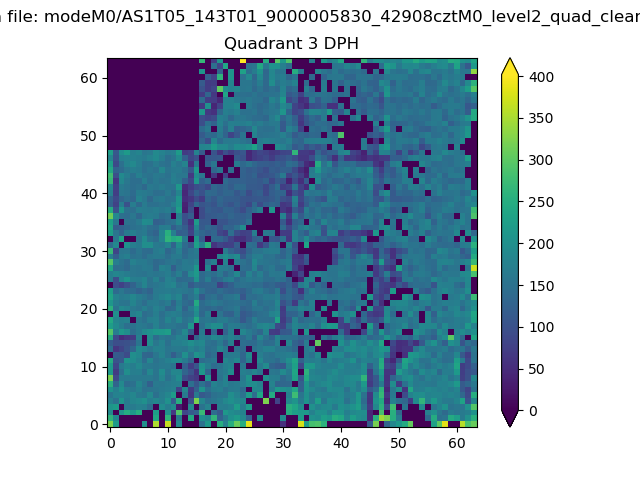 |
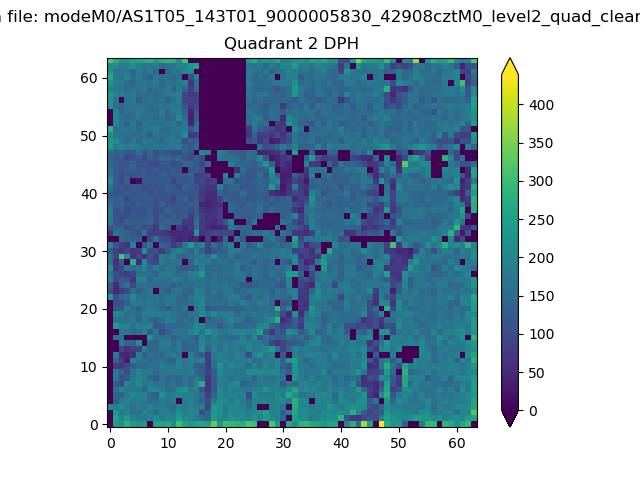 |
Quadrant C |
| Plot type | Count rate plots | Images |
|---|---|---|
| Comparison with Poisson distribution Blue bars denote a histogram of data divided into 1 sec bins. Red curve is a Poisson curve with rate = median count rate of data. |
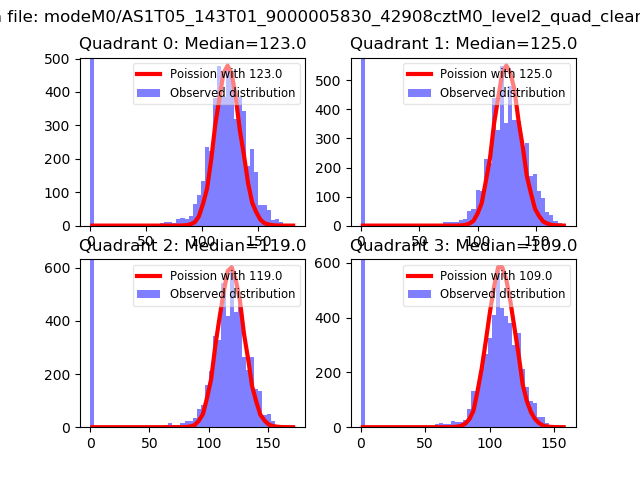 |
 |
| Quadrant-wise count rates Data is divided into 100 sec bins |
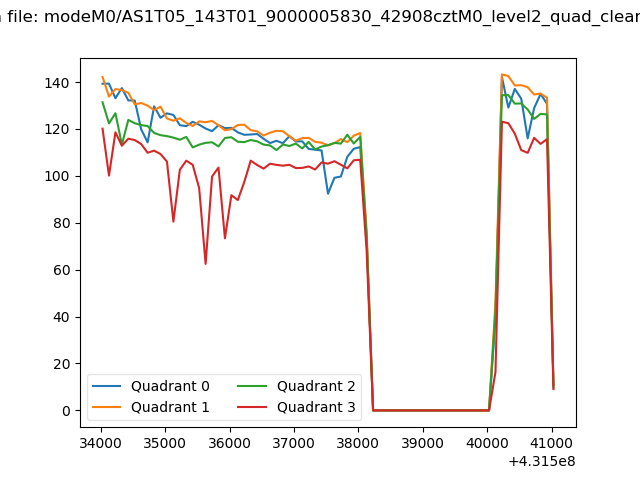 |
|
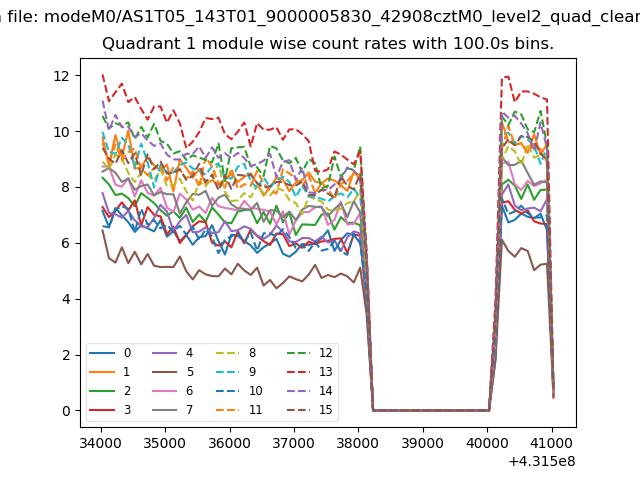
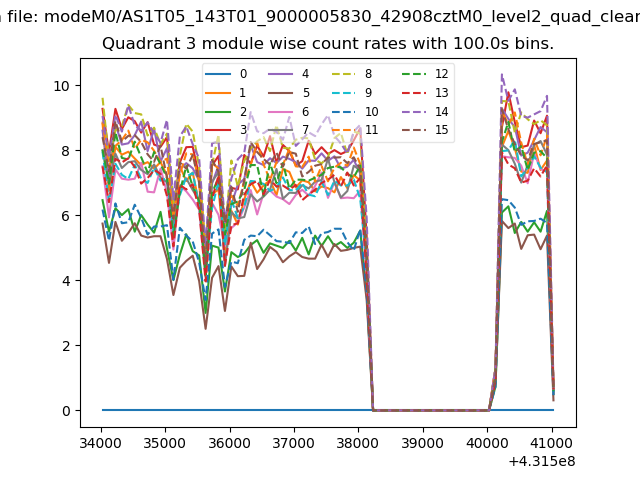
| Module-wise count rates for Quadrant A Data is divided into 100 sec bins |
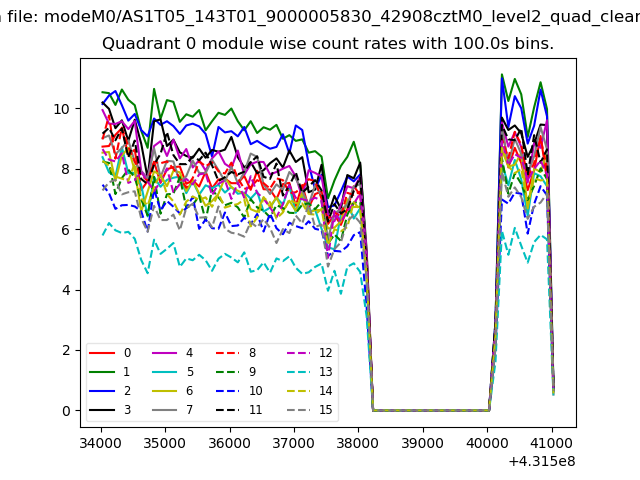 |
 |
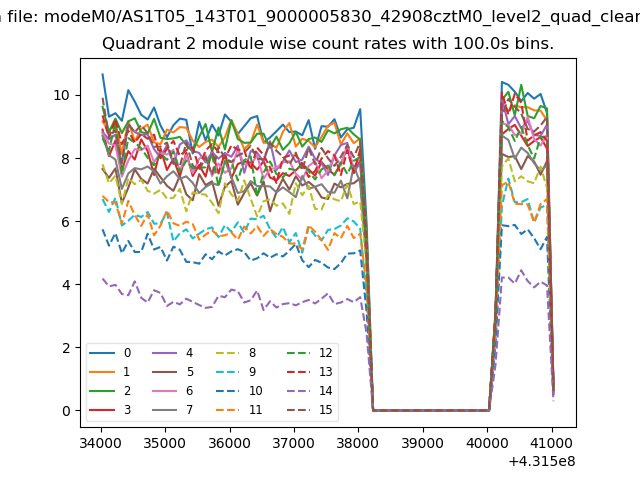
| Module-wise count rates for Quadrant B Data is divided into 100 sec bins |
 |
 |
| Module-wise count rates for Quadrant C Data is divided into 100 sec bins |
 |
 |
| Module-wise count rates for Quadrant D Data is divided into 100 sec bins |
 |
 |
| Parameter | Plot |
|---|---|
| CZT HV Monitor | 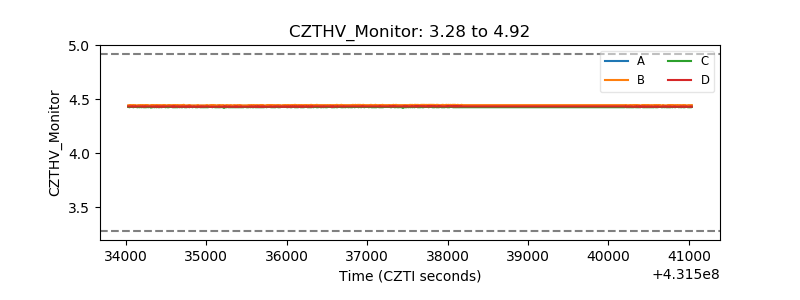 |
| D_VDD | 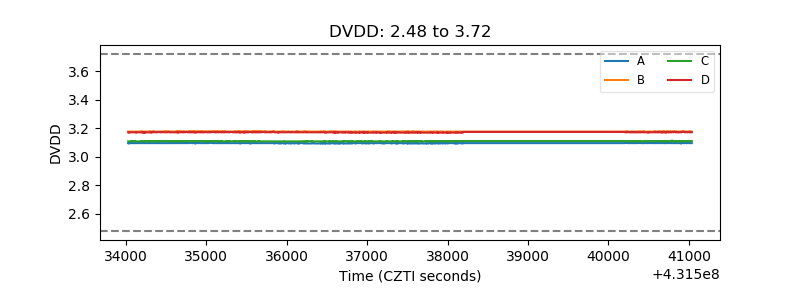 |
| Temperature 1 | 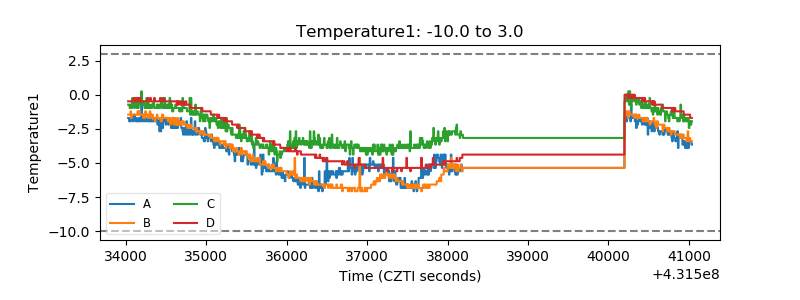 |
| Veto HV Monitor |  |
| Veto LLD | 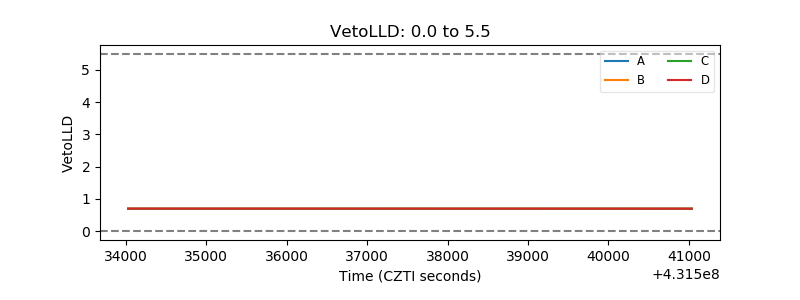 |
| Alpha Counter | 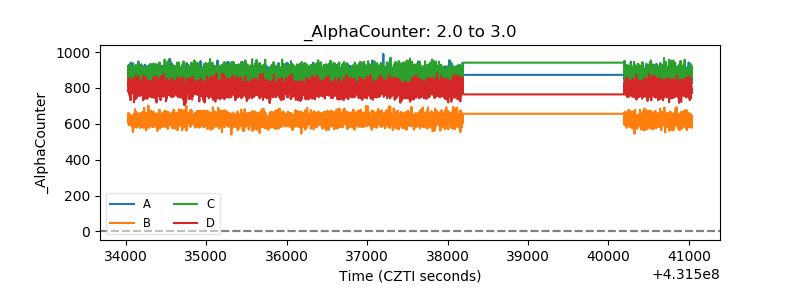 |
| _CPM_Rate | 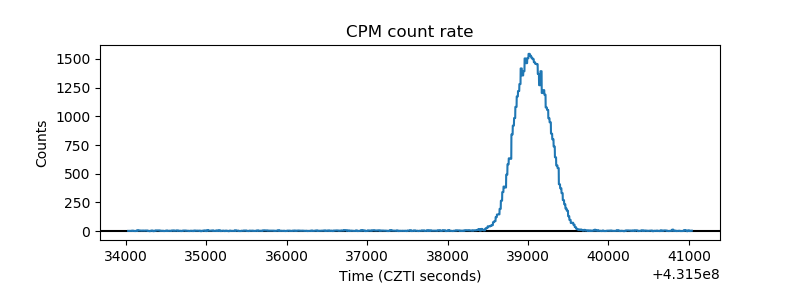 |
| CZT Counter | 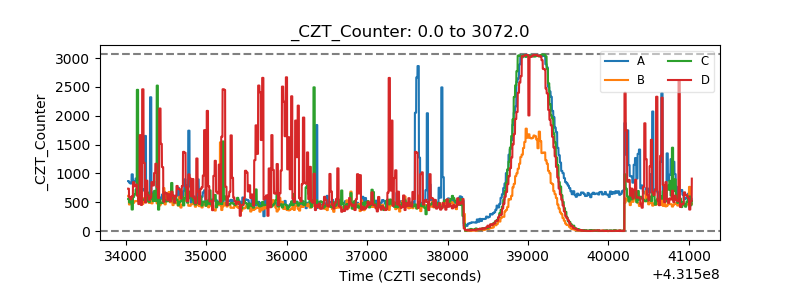 |
| +2.5 Volts monitor | 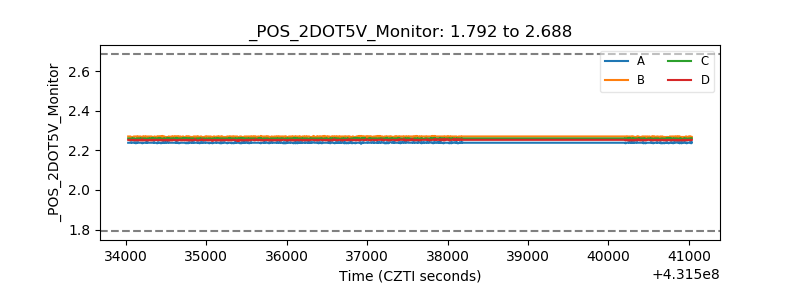 |
| +5 Volts monitor | 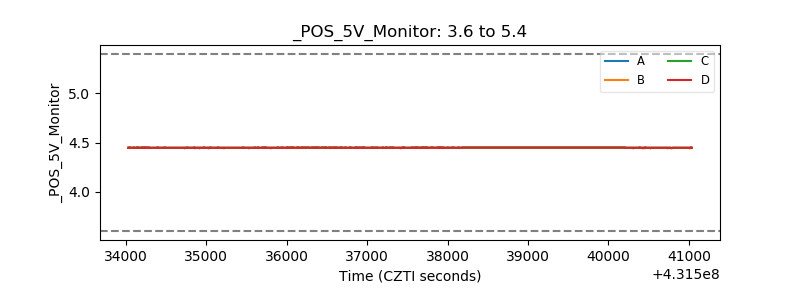 |
| _ROLL_ROT | 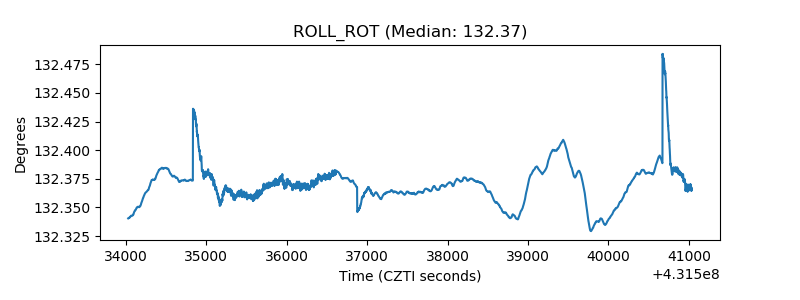 |
| _Roll_DEC | 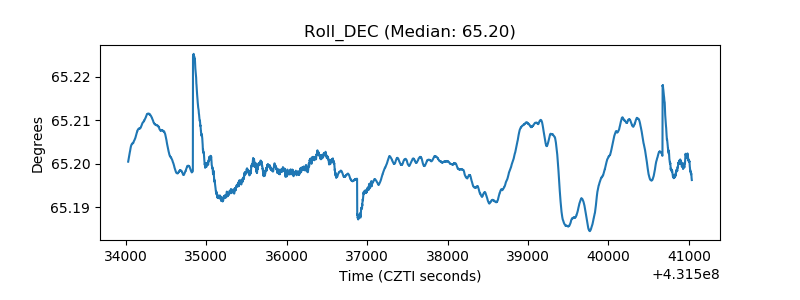 |
| _Roll_RA | 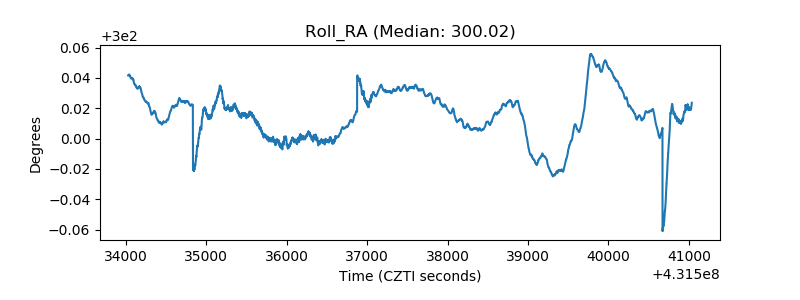 |
| Veto Counter | 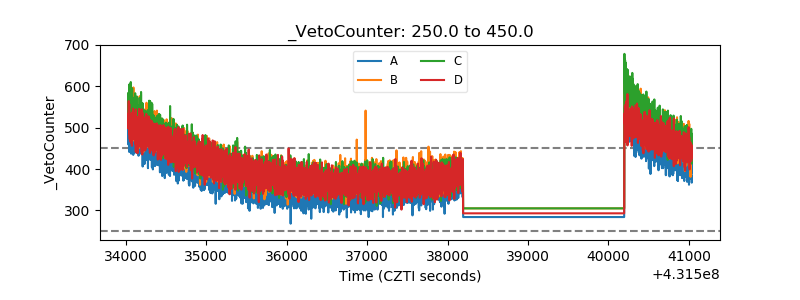 |