| Param | Original file | Final file |
|---|---|---|
| Filename | modeM0/AS1T05_143T01_9000005830_42909cztM0_level2.fits | modeM0/AS1T05_143T01_9000005830_42909cztM0_level2_quad_clean.evt |
| Size (bytes) | 344,001,600 | 85,512,960 |
| Size | 328.1 MB | 81.6 MB |
| Events in quadrant A | 3,120,504 | 587,509 |
| Events in quadrant B | 2,179,970 | 604,076 |
| Events in quadrant C | 2,649,170 | 578,105 |
| Events in quadrant D | 4,406,621 | 479,433 |
| Mode M0 | |||
|---|---|---|---|
| Quadrant | BADHDUFLAG | Total packets | Discarded packets |
| A | 0 | 12396 | 2 |
| B | 0 | 9816 | 2 |
| C | 0 | 10925 | 2 |
| D | 0 | 16453 | 2 |
| Mode M9 | |||
|---|---|---|---|
| Quadrant | BADHDUFLAG | Total packets | Discarded packets |
| A | 0 | 30 | 0 |
| B | 0 | 31 | 0 |
| C | 0 | 31 | 0 |
| D | 0 | 31 | 0 |
| Mode SS | |||
|---|---|---|---|
| Quadrant | BADHDUFLAG | Total packets | Discarded packets |
| A | 0 | 100 | 0 |
| B | 0 | 100 | 0 |
| C | 0 | 100 | 0 |
| D | 0 | 100 | 0 |
| Quadrant | Total seconds | Saturated seconds | Saturation percentage |
|---|---|---|---|
| A | 4846 | 84 | 1.733388% |
| B | 4846 | 10 | 0.206356% |
| C | 4846 | 20 | 0.412712% |
| D | 4846 | 598 | 12.340074% |
Noise dominated data is calculated using 1-second bins in cleaned event files. If a bin has >2000 counts, and if more than 50% of those come from <1% of pixels, then it is considered to be noise-dominated and hence unusable.
| Quadrant | # 1 sec bins | Bins with >0 counts | Bins with >2000 counts | High rate bins dominated by noise | Noise dominated (total time) | Noise dominated (detector-on time) | Marked lightcurve |
|---|---|---|---|---|---|---|---|
| A | 6939 | 4847 | 65 | 65 | 0.94% | 1.34% | 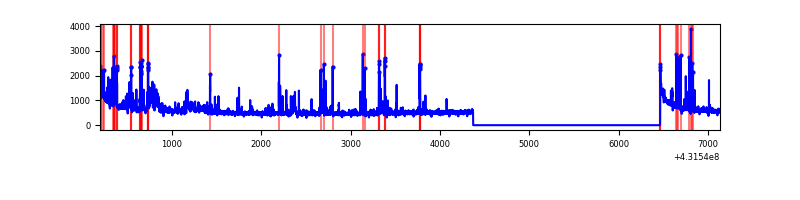 |
| B | 6939 | 4847 | 3 | 3 | 0.04% | 0.06% | 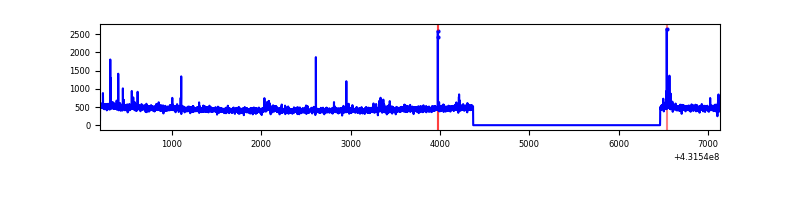 |
| C | 6939 | 4847 | 18 | 18 | 0.26% | 0.37% | 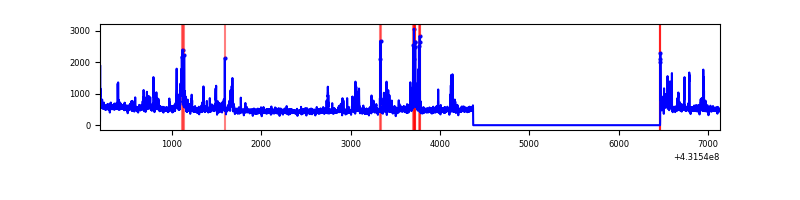 |
| D | 6939 | 4846 | 574 | 574 | 8.27% | 11.84% | 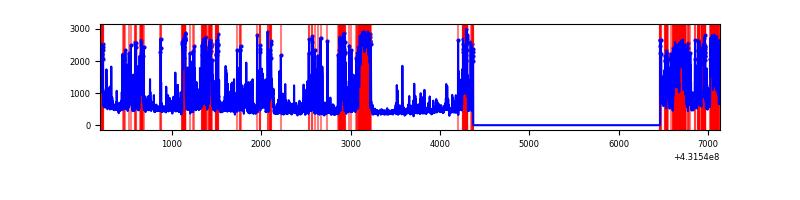 |
Top three noisy pixels from each quadrant. If the there are fewer than three noisy pixels in the level2.evt file, extra rows are filled as -1
| Pixel properties | Quadrant properties | ||||||
|---|---|---|---|---|---|---|---|
| Quadrant | DetID | PixID | Counts | Sigma | Mean | Median | Sigma |
| A | 10 | 83 | 560657 | 5067.31 | 538 | 527 | 110.5 |
| A | 15 | 237 | 402771 | 3638.97 | 538 | 527 | 110.5 |
| A | 2 | 79 | 51931 | 465.03 | 538 | 527 | 110.5 |
| B | 0 | 229 | 12517 | 117.21 | 542 | 527 | 102.3 |
| B | 12 | 111 | 12330 | 115.38 | 542 | 527 | 102.3 |
| B | 11 | 111 | 11203 | 104.37 | 542 | 527 | 102.3 |
| C | 14 | 254 | 237356 | 1888.49 | 538 | 540 | 125.4 |
| C | 15 | 214 | 197143 | 1567.81 | 538 | 540 | 125.4 |
| C | 8 | 79 | 62010 | 490.19 | 538 | 540 | 125.4 |
| D | 12 | 6 | 583129 | 4767.45 | 508 | 495 | 122.2 |
| D | 10 | 118 | 467269 | 3819.41 | 508 | 495 | 122.2 |
| D | 1 | 47 | 396591 | 3241.09 | 508 | 495 | 122.2 |
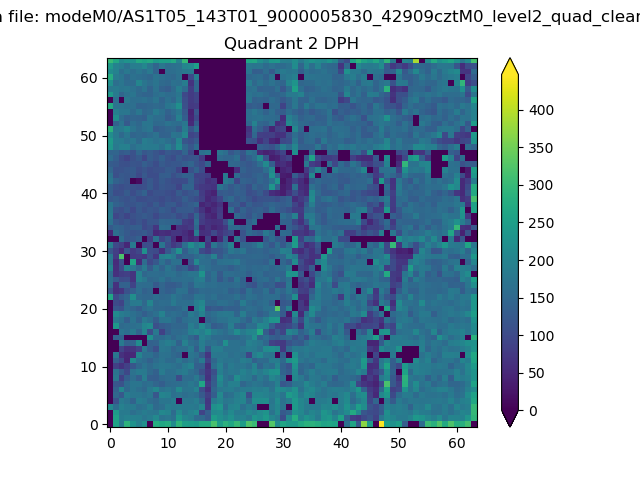
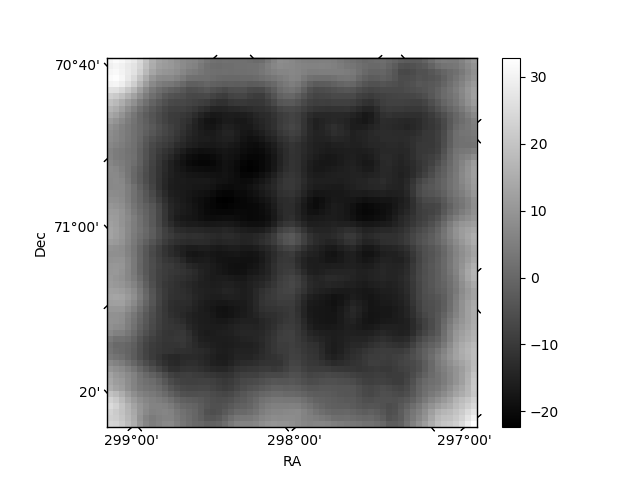
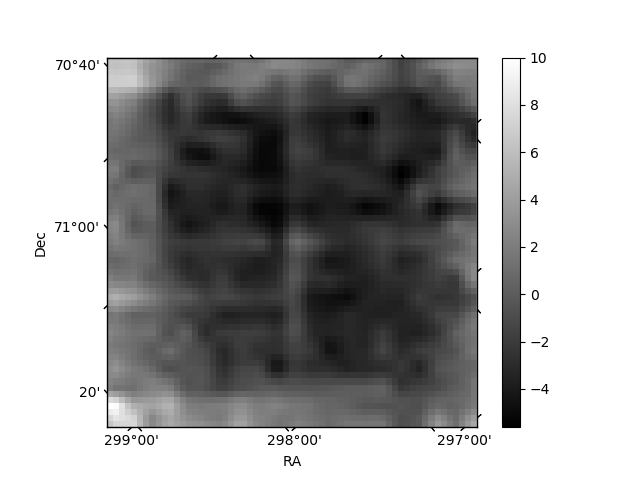
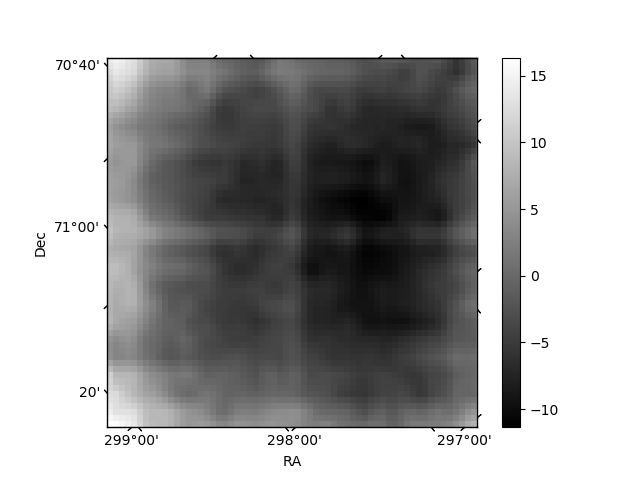
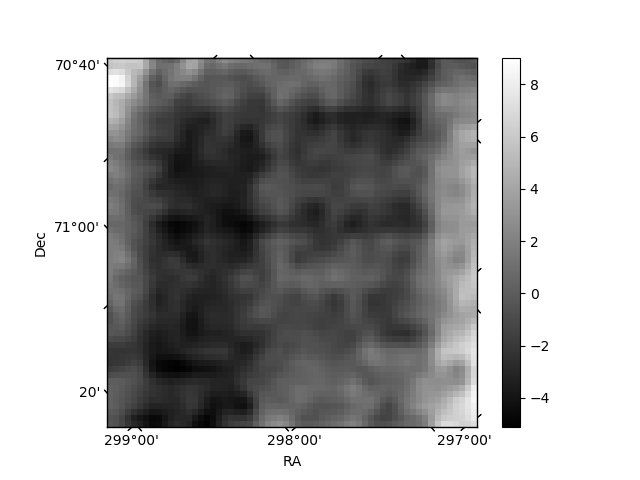
Histogram calculated using DETX and DETY for each event in the final _common_clean file
| Quadrant A | 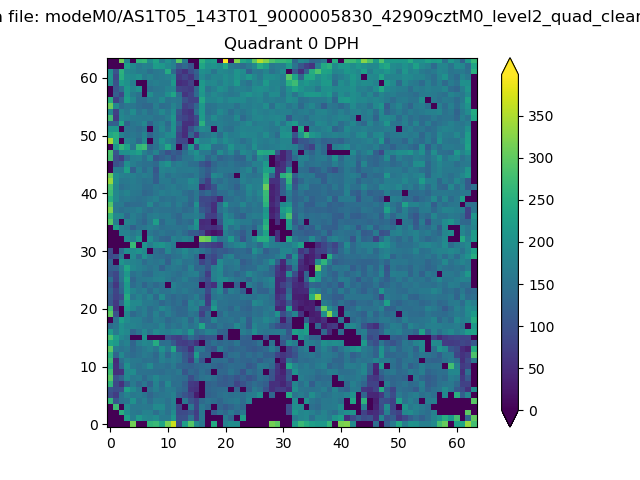 |
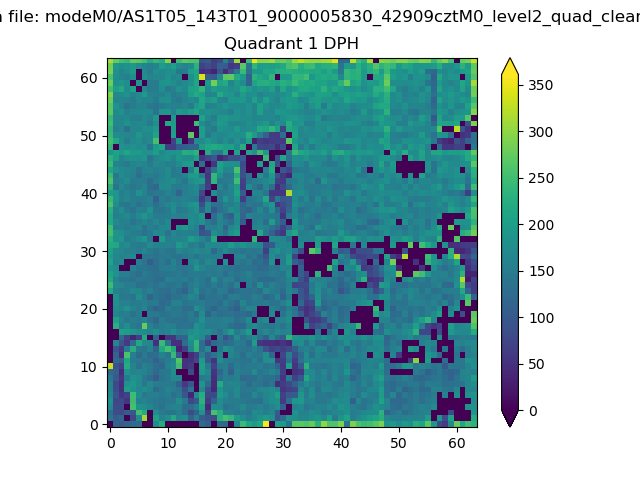 |
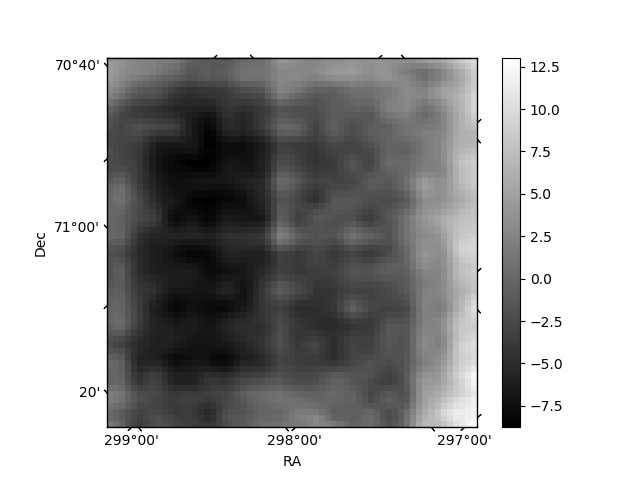
Quadrant B |
|---|---|---|---|
| Quadrant D | 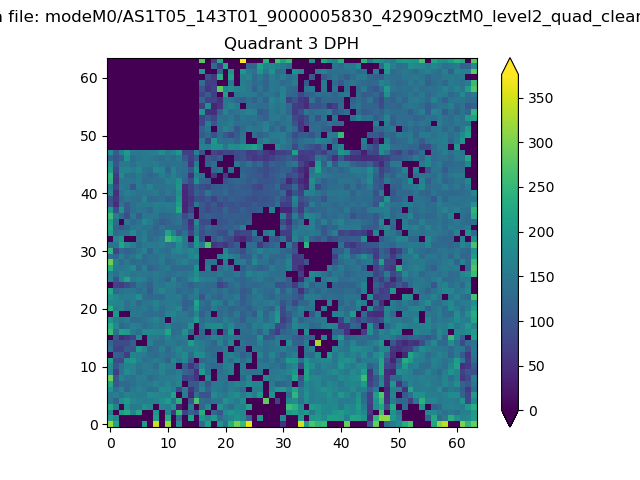 |
 |
Quadrant C |
| Plot type | Count rate plots | Images |
|---|---|---|
| Comparison with Poisson distribution Blue bars denote a histogram of data divided into 1 sec bins. Red curve is a Poisson curve with rate = median count rate of data. |
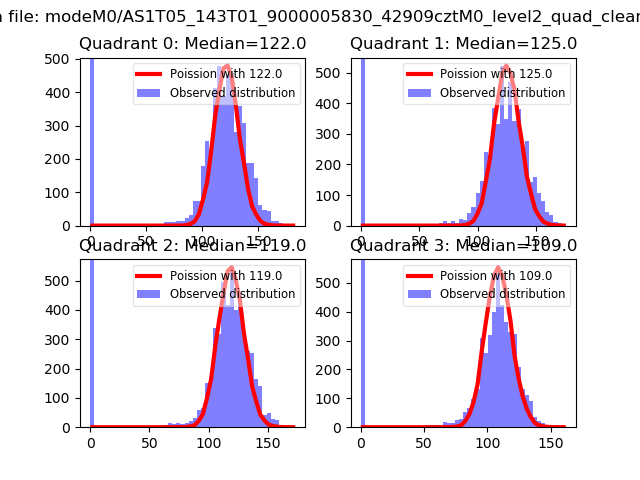 |
 |
| Quadrant-wise count rates Data is divided into 100 sec bins |
 |
|
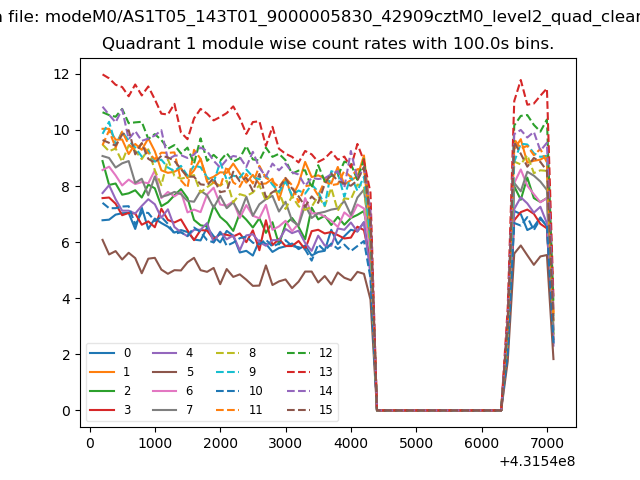
| Module-wise count rates for Quadrant A Data is divided into 100 sec bins |
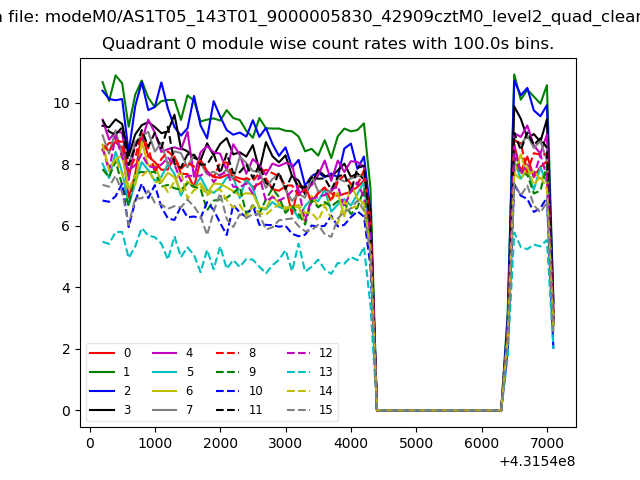 |
 |
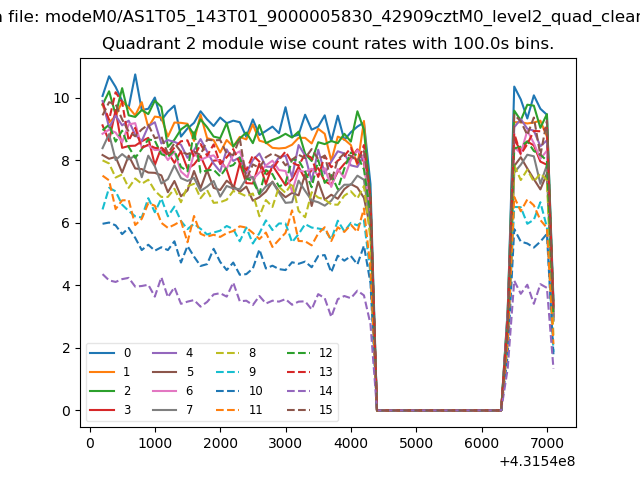
| Module-wise count rates for Quadrant B Data is divided into 100 sec bins |
 |
 |
| Module-wise count rates for Quadrant C Data is divided into 100 sec bins |
 |
 |
| Module-wise count rates for Quadrant D Data is divided into 100 sec bins |
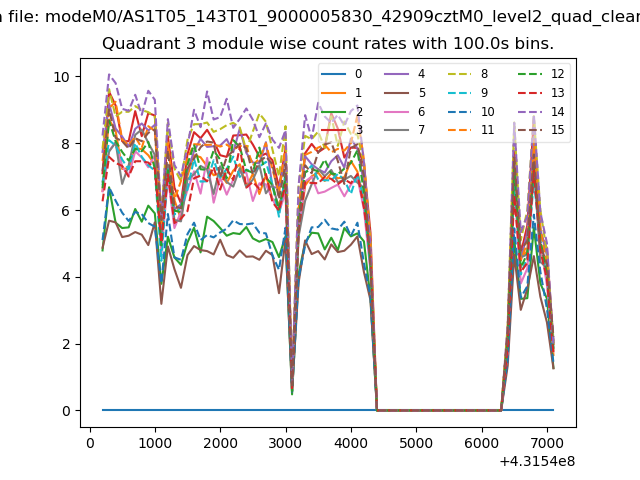 |
 |
| Parameter | Plot |
|---|---|
| CZT HV Monitor | 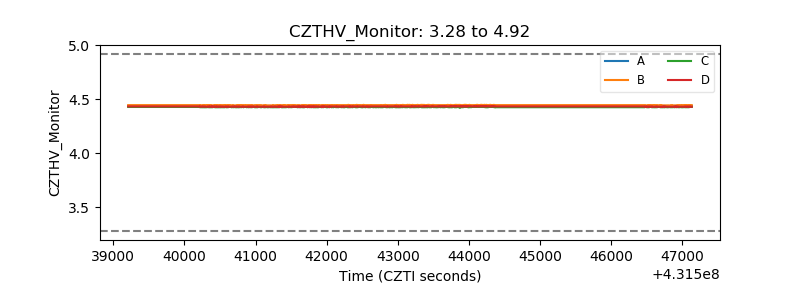 |
| D_VDD | 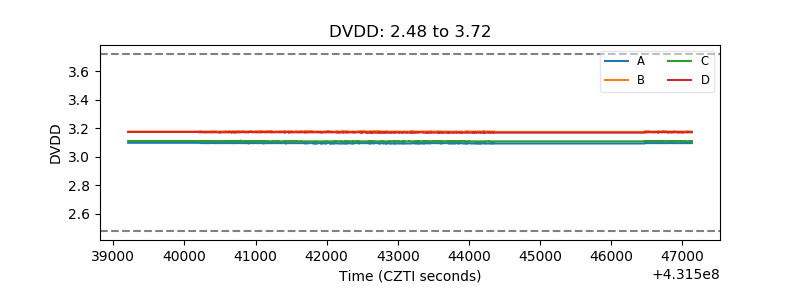 |
| Temperature 1 | 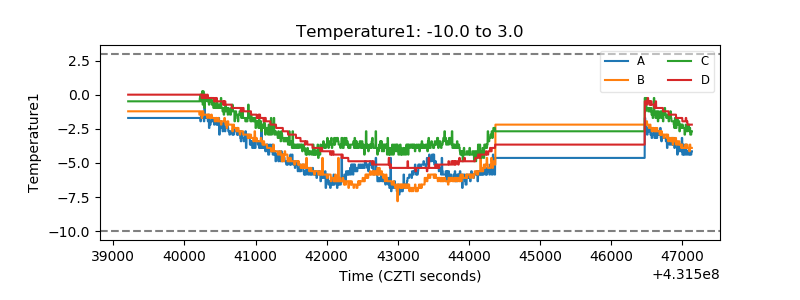 |
| Veto HV Monitor | 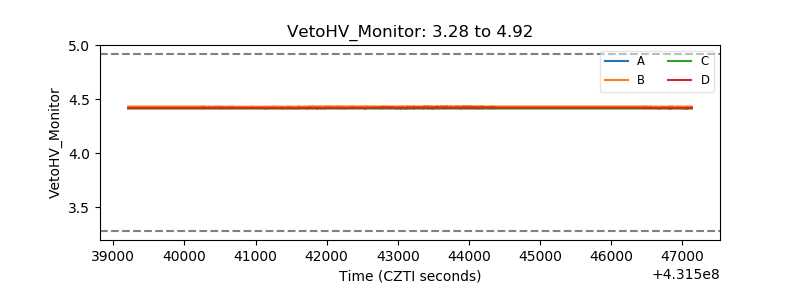 |
| Veto LLD | 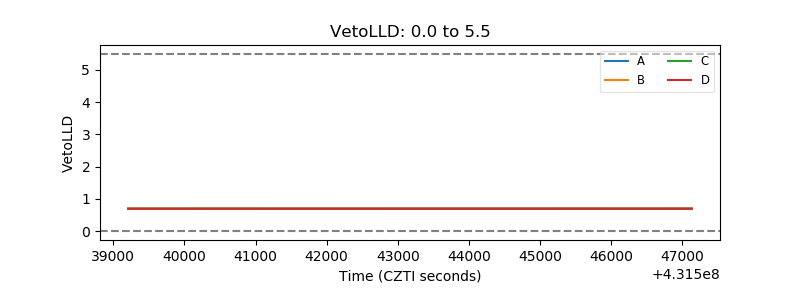 |
| Alpha Counter | 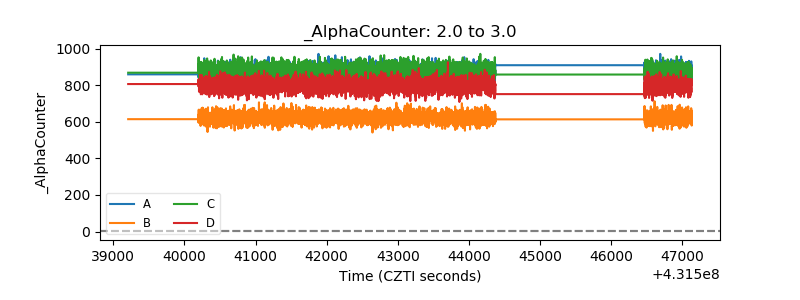 |
| _CPM_Rate | 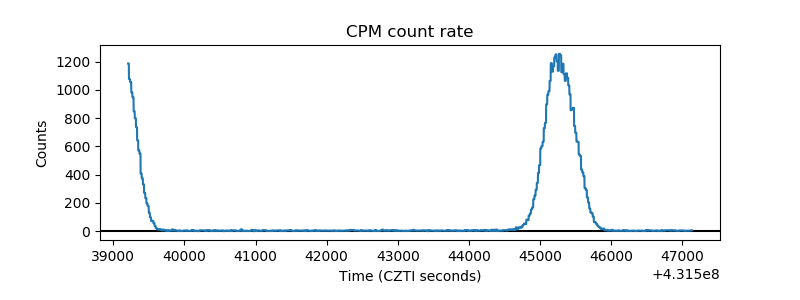 |
| CZT Counter | 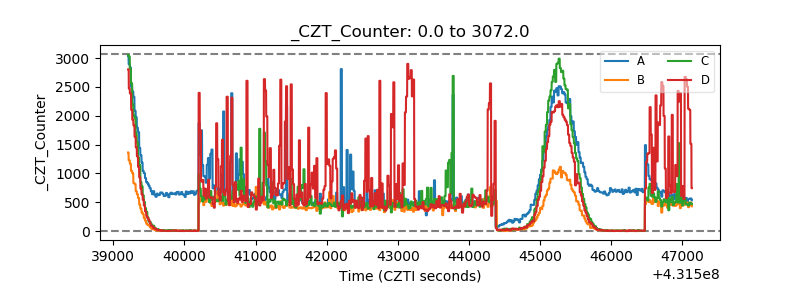 |
| +2.5 Volts monitor | 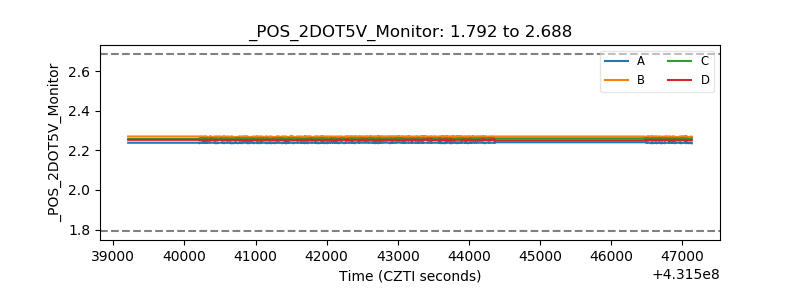 |
| +5 Volts monitor | 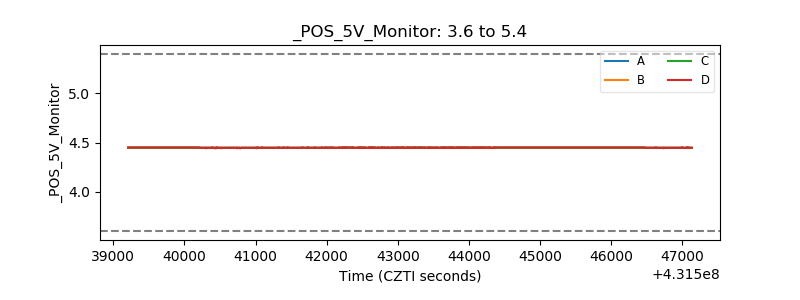 |
| _ROLL_ROT | 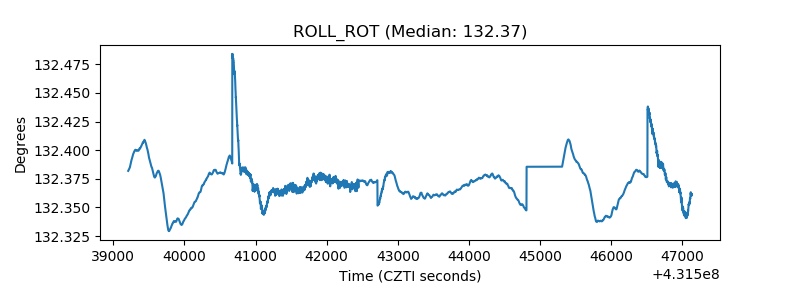 |
| _Roll_DEC | 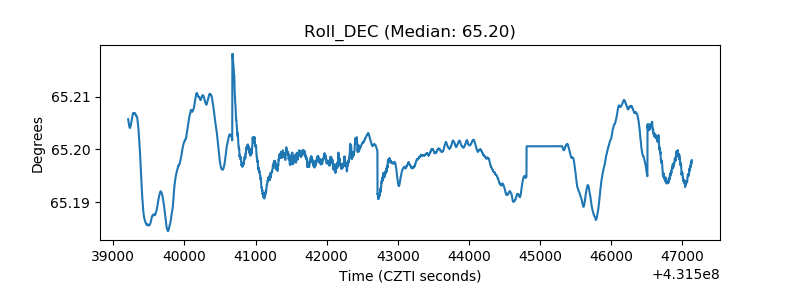 |
| _Roll_RA | 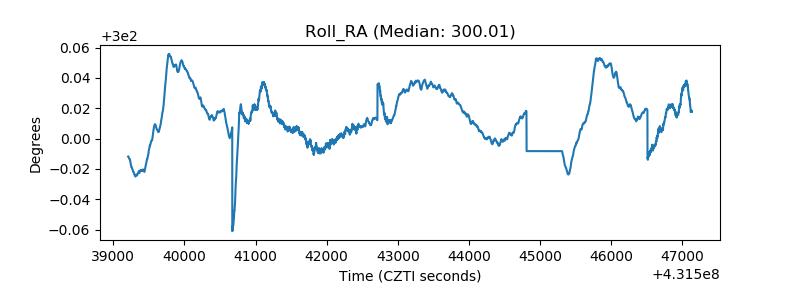 |
| Veto Counter | 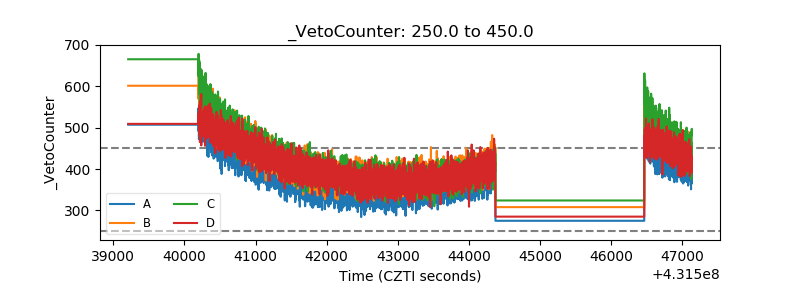 |