| Param | Original file | Final file |
|---|---|---|
| Filename | modeM0/AS1T05_143T01_9000005830_42910cztM0_level2.fits | modeM0/AS1T05_143T01_9000005830_42910cztM0_level2_quad_clean.evt |
| Size (bytes) | 347,120,640 | 82,863,360 |
| Size | 331.0 MB | 79.0 MB |
| Events in quadrant A | 3,011,957 | 563,789 |
| Events in quadrant B | 2,178,933 | 586,778 |
| Events in quadrant C | 2,473,639 | 562,280 |
| Events in quadrant D | 4,805,078 | 454,640 |
| Mode M0 | |||
|---|---|---|---|
| Quadrant | BADHDUFLAG | Total packets | Discarded packets |
| A | 0 | 11997 | 2 |
| B | 0 | 9983 | 3 |
| C | 0 | 10440 | 2 |
| D | 0 | 17773 | 2 |
| Mode M9 | |||
|---|---|---|---|
| Quadrant | BADHDUFLAG | Total packets | Discarded packets |
| A | 0 | 32 | 0 |
| B | 0 | 33 | 0 |
| C | 0 | 33 | 0 |
| D | 0 | 33 | 0 |
| Mode SS | |||
|---|---|---|---|
| Quadrant | BADHDUFLAG | Total packets | Discarded packets |
| A | 0 | 98 | 0 |
| B | 0 | 98 | 0 |
| C | 0 | 98 | 0 |
| D | 0 | 98 | 0 |
| Quadrant | Total seconds | Saturated seconds | Saturation percentage |
|---|---|---|---|
| A | 4872 | 106 | 2.175698% |
| B | 4871 | 9 | 0.184767% |
| C | 4871 | 20 | 0.410593% |
| D | 4871 | 720 | 14.781359% |
Noise dominated data is calculated using 1-second bins in cleaned event files. If a bin has >2000 counts, and if more than 50% of those come from <1% of pixels, then it is considered to be noise-dominated and hence unusable.
| Quadrant | # 1 sec bins | Bins with >0 counts | Bins with >2000 counts | High rate bins dominated by noise | Noise dominated (total time) | Noise dominated (detector-on time) | Marked lightcurve |
|---|---|---|---|---|---|---|---|
| A | 7026 | 4873 | 90 | 90 | 1.28% | 1.85% | 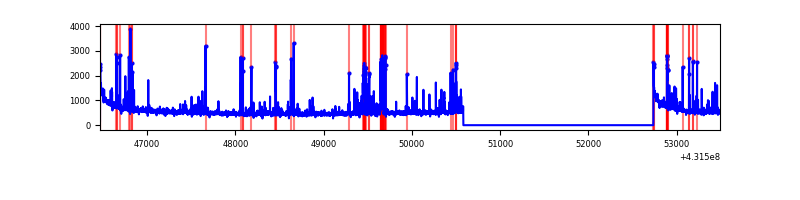 |
| B | 7025 | 4871 | 3 | 3 | 0.04% | 0.06% | 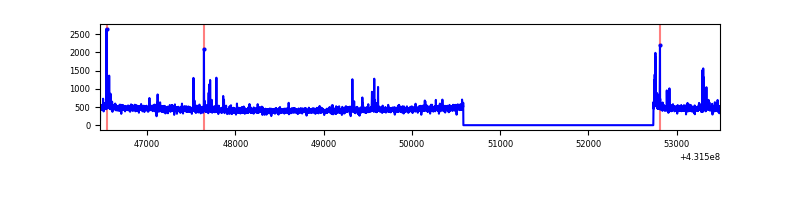 |
| C | 7025 | 4872 | 18 | 18 | 0.26% | 0.37% | 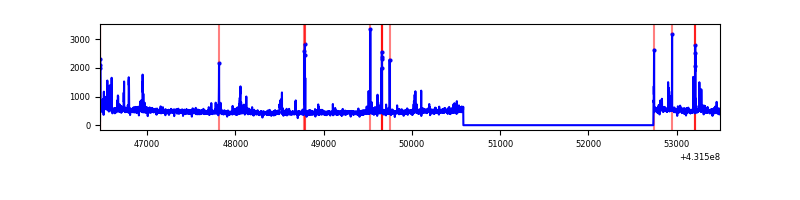 |
| D | 7025 | 4872 | 735 | 735 | 10.46% | 15.09% | 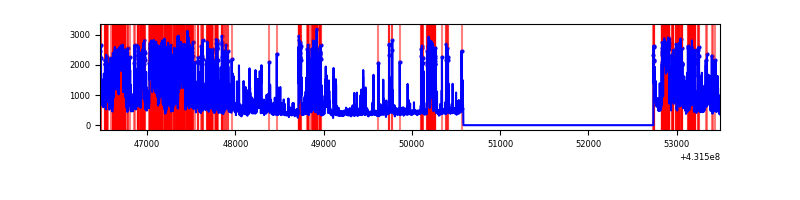 |
Top three noisy pixels from each quadrant. If the there are fewer than three noisy pixels in the level2.evt file, extra rows are filled as -1
| Pixel properties | Quadrant properties | ||||||
|---|---|---|---|---|---|---|---|
| Quadrant | DetID | PixID | Counts | Sigma | Mean | Median | Sigma |
| A | 10 | 83 | 550783 | 5076.37 | 522 | 511 | 108.4 |
| A | 15 | 237 | 354710 | 3267.55 | 522 | 511 | 108.4 |
| A | 2 | 79 | 70140 | 642.34 | 522 | 511 | 108.4 |
| B | 4 | 171 | 48993 | 478.28 | 530 | 515 | 101.4 |
| B | 3 | 112 | 18342 | 175.88 | 530 | 515 | 101.4 |
| B | 5 | 172 | 16593 | 158.63 | 530 | 515 | 101.4 |
| C | 15 | 214 | 198521 | 1611.21 | 525 | 528 | 122.9 |
| C | 14 | 254 | 111604 | 903.91 | 525 | 528 | 122.9 |
| C | 12 | 2 | 75837 | 612.84 | 525 | 528 | 122.9 |
| D | 1 | 47 | 909678 | 7569.57 | 489 | 475 | 120.1 |
| D | 10 | 118 | 523371 | 4353.37 | 489 | 475 | 120.1 |
| D | 12 | 6 | 478378 | 3978.78 | 489 | 475 | 120.1 |
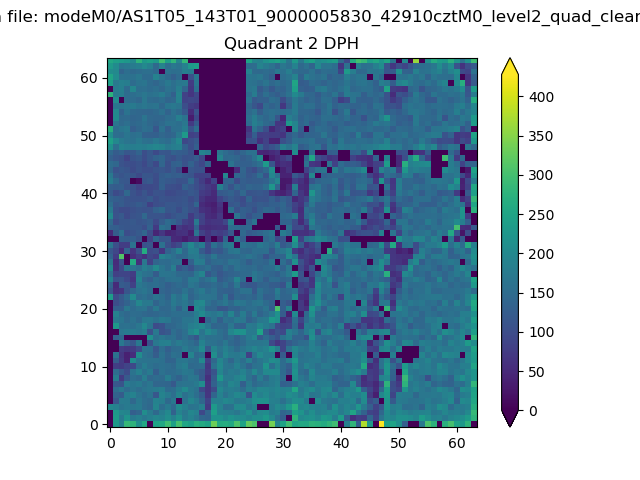
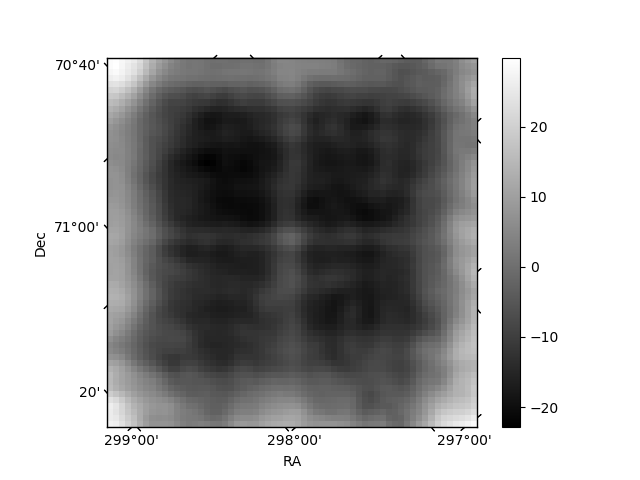
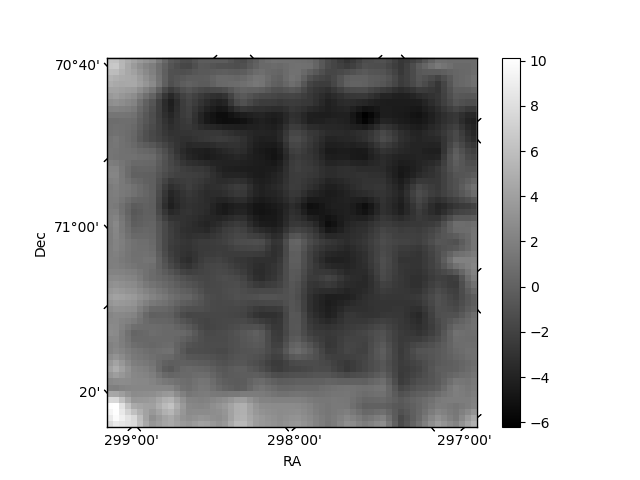
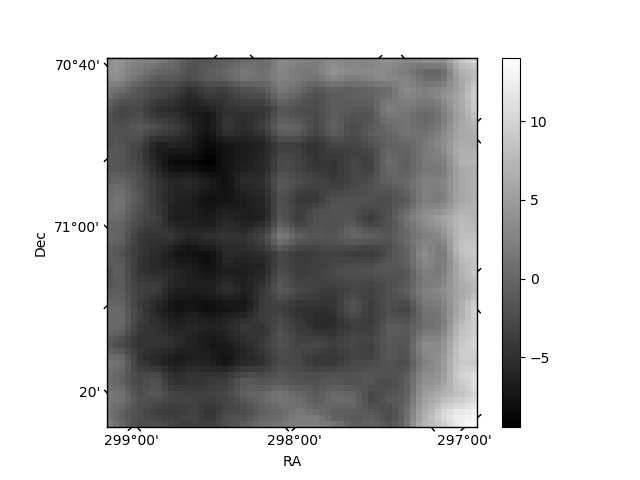
Histogram calculated using DETX and DETY for each event in the final _common_clean file
| Quadrant A | 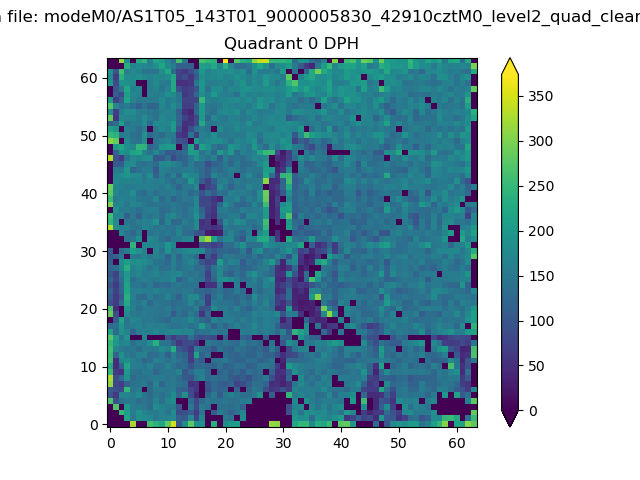 |
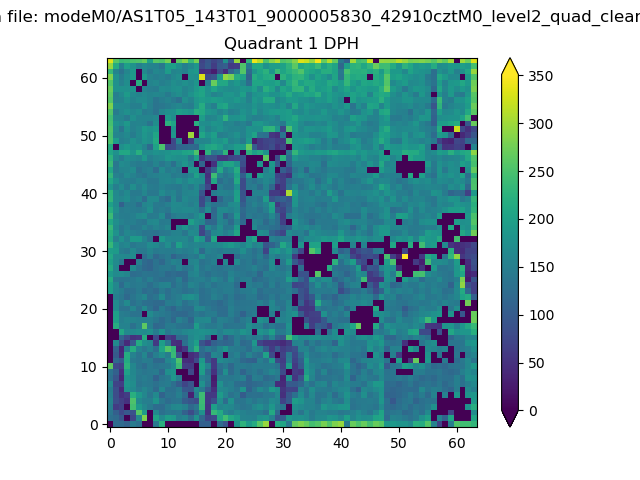 |
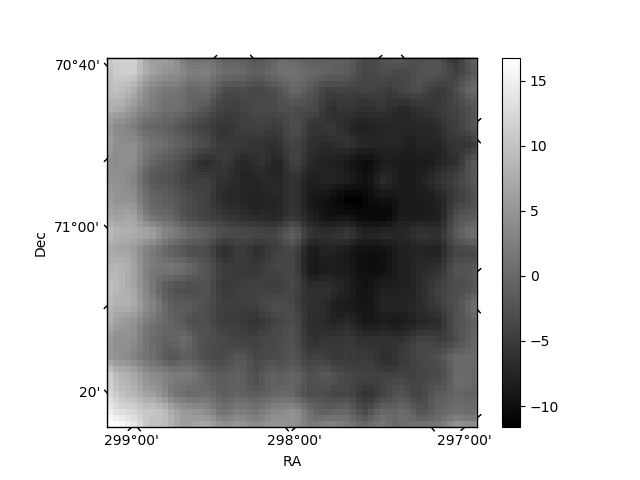
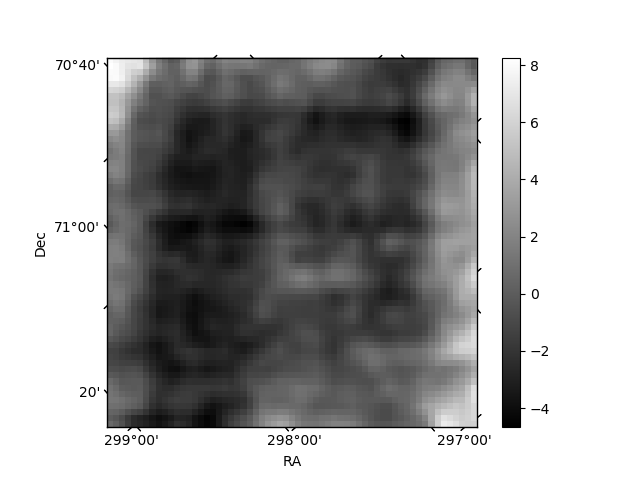
Quadrant B |
|---|---|---|---|
| Quadrant D | 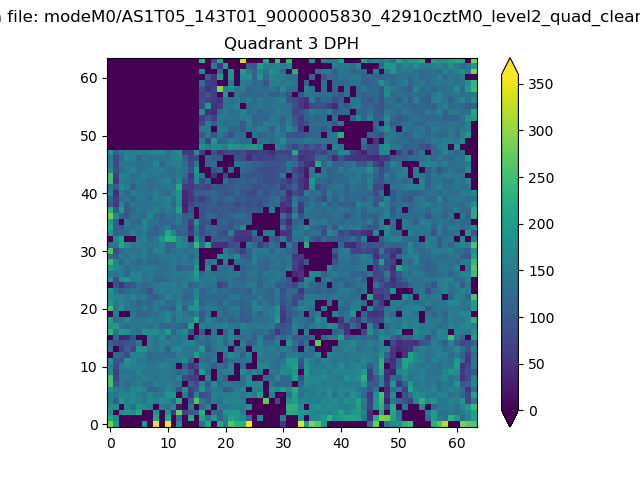 |
 |
Quadrant C |
| Plot type | Count rate plots | Images |
|---|---|---|
| Comparison with Poisson distribution Blue bars denote a histogram of data divided into 1 sec bins. Red curve is a Poisson curve with rate = median count rate of data. |
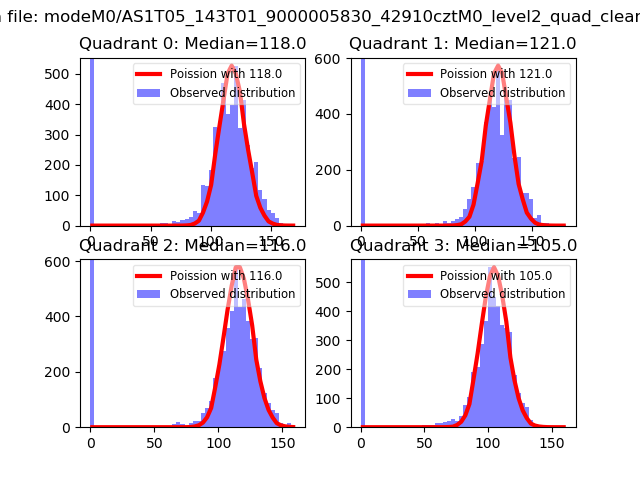 |
 |
| Quadrant-wise count rates Data is divided into 100 sec bins |
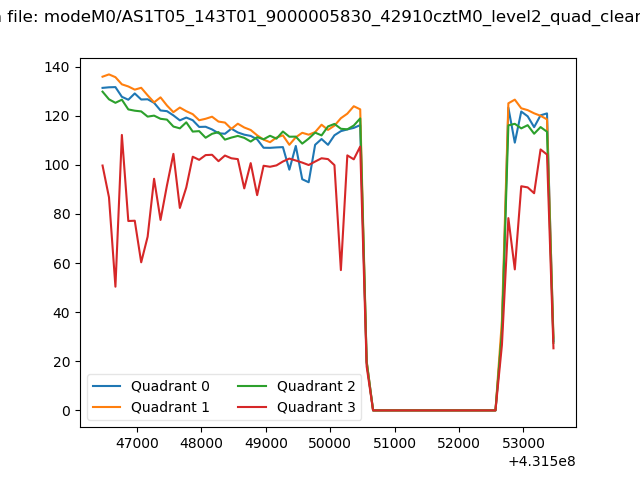 |
|
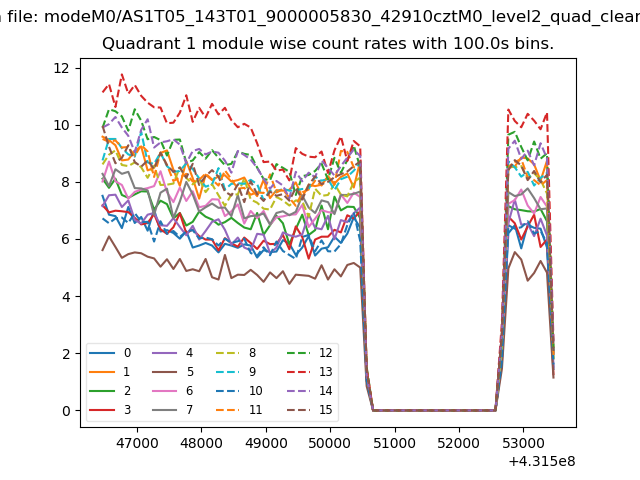
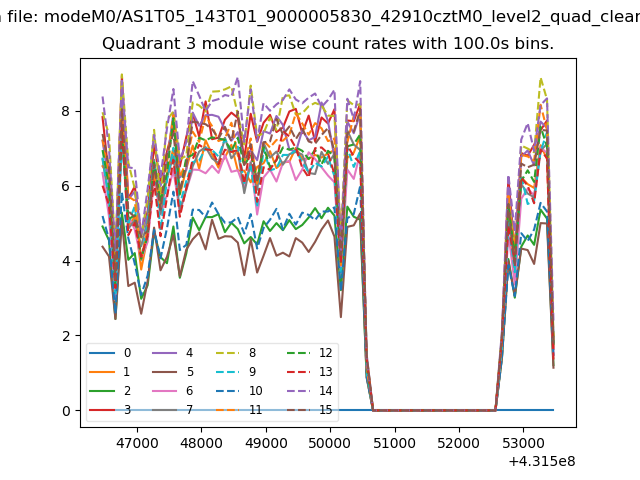
| Module-wise count rates for Quadrant A Data is divided into 100 sec bins |
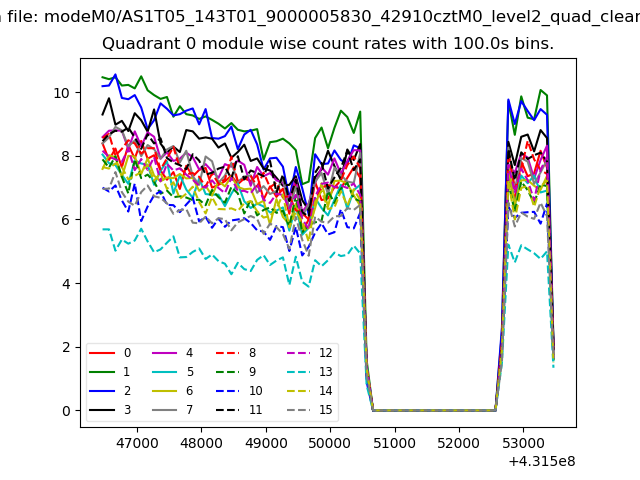 |
 |
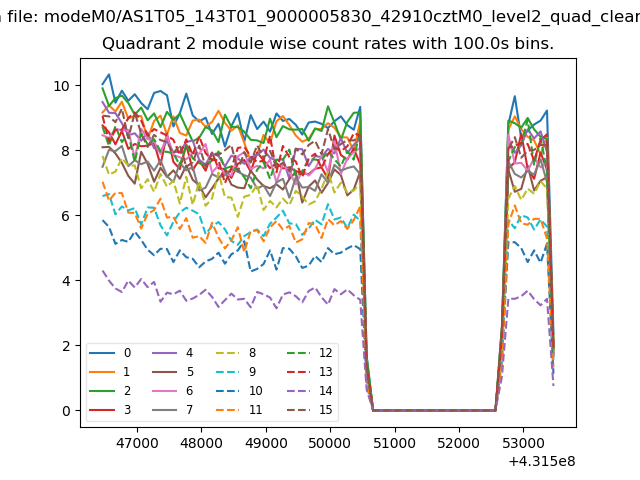
| Module-wise count rates for Quadrant B Data is divided into 100 sec bins |
 |
 |
| Module-wise count rates for Quadrant C Data is divided into 100 sec bins |
 |
 |
| Module-wise count rates for Quadrant D Data is divided into 100 sec bins |
 |
 |
| Parameter | Plot |
|---|---|
| CZT HV Monitor | 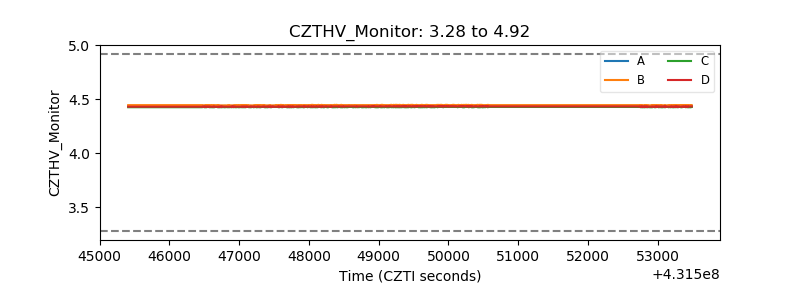 |
| D_VDD | 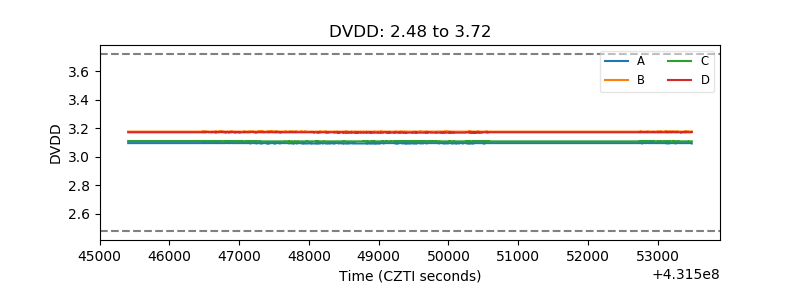 |
| Temperature 1 | 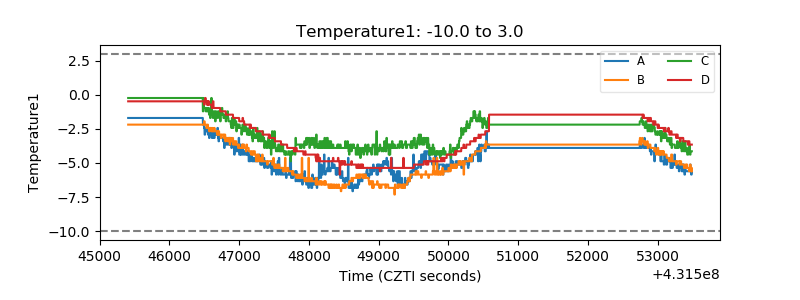 |
| Veto HV Monitor | 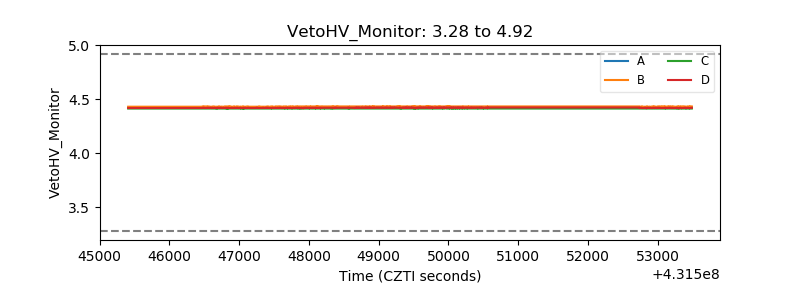 |
| Veto LLD | 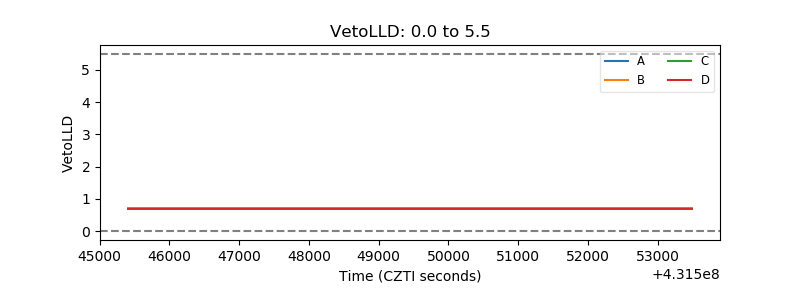 |
| Alpha Counter | 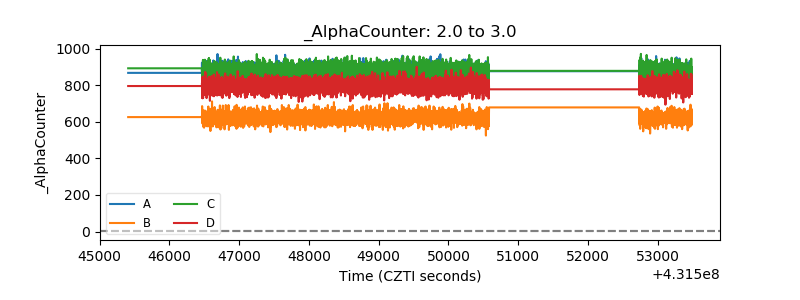 |
| _CPM_Rate | 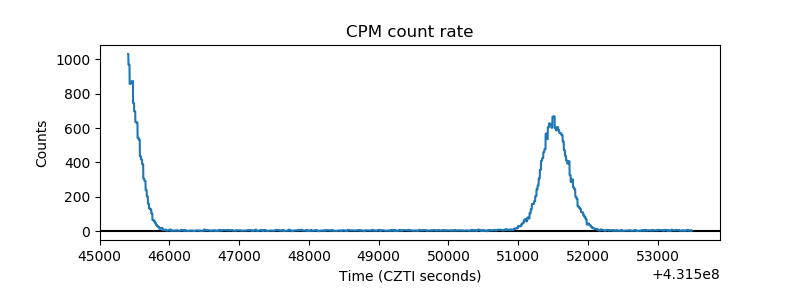 |
| CZT Counter | 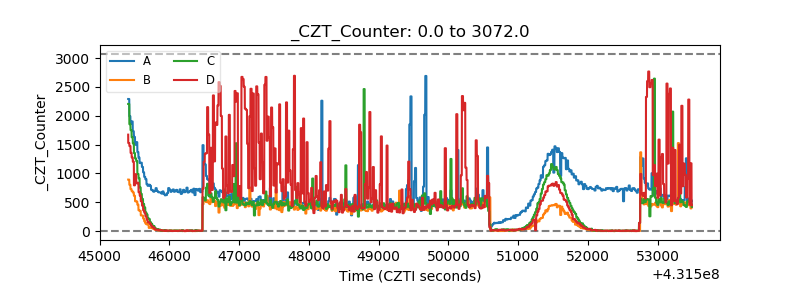 |
| +2.5 Volts monitor | 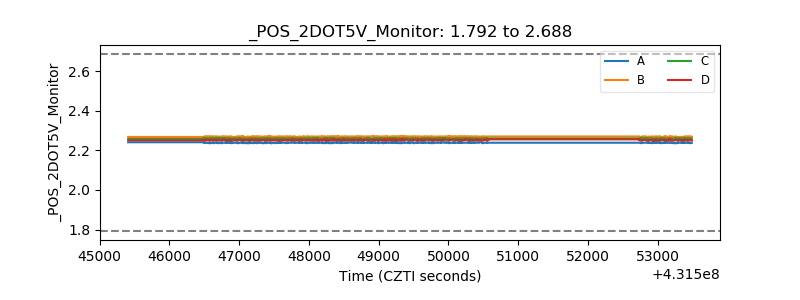 |
| +5 Volts monitor | 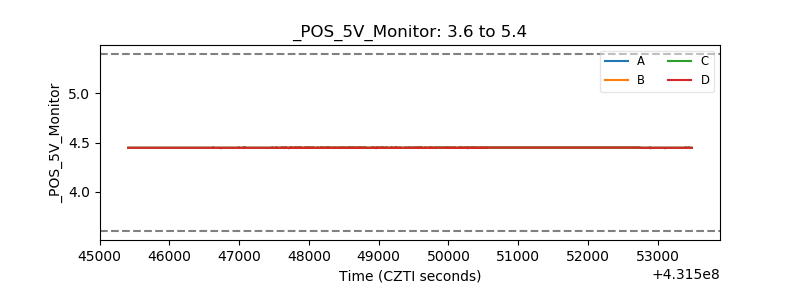 |
| _ROLL_ROT | 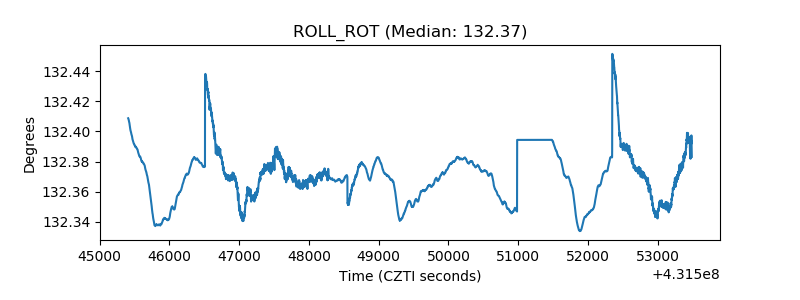 |
| _Roll_DEC | 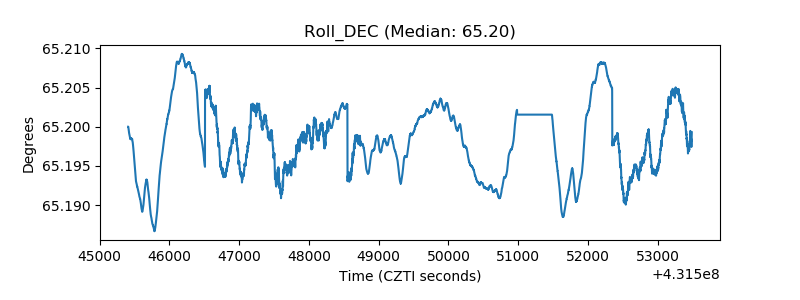 |
| _Roll_RA | 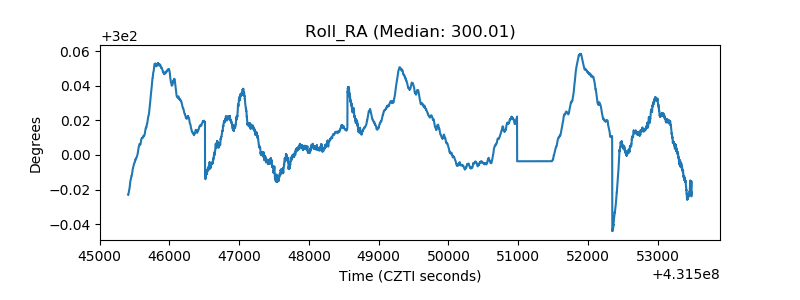 |
| Veto Counter | 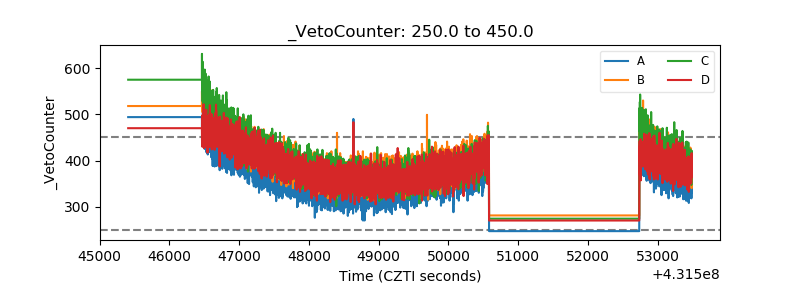 |