| Param | Original file | Final file |
|---|---|---|
| Filename | modeM0/AS1T05_143T01_9000005830_42911cztM0_level2.fits | modeM0/AS1T05_143T01_9000005830_42911cztM0_level2_quad_clean.evt |
| Size (bytes) | 317,108,160 | 80,953,920 |
| Size | 302.4 MB | 77.2 MB |
| Events in quadrant A | 2,903,018 | 541,080 |
| Events in quadrant B | 2,201,640 | 560,637 |
| Events in quadrant C | 2,405,257 | 537,986 |
| Events in quadrant D | 3,846,986 | 467,793 |
| Mode M0 | |||
|---|---|---|---|
| Quadrant | BADHDUFLAG | Total packets | Discarded packets |
| A | 0 | 11757 | 2 |
| B | 0 | 10217 | 2 |
| C | 0 | 10369 | 2 |
| D | 0 | 14990 | 2 |
| Mode M9 | |||
|---|---|---|---|
| Quadrant | BADHDUFLAG | Total packets | Discarded packets |
| A | 0 | 32 | 0 |
| B | 0 | 33 | 0 |
| C | 0 | 33 | 0 |
| D | 0 | 33 | 0 |
| Mode SS | |||
|---|---|---|---|
| Quadrant | BADHDUFLAG | Total packets | Discarded packets |
| A | 0 | 102 | 0 |
| B | 0 | 102 | 0 |
| C | 0 | 102 | 0 |
| D | 0 | 102 | 0 |
| Quadrant | Total seconds | Saturated seconds | Saturation percentage |
|---|---|---|---|
| A | 4892 | 89 | 1.819297% |
| B | 4892 | 25 | 0.511038% |
| C | 4892 | 16 | 0.327065% |
| D | 4892 | 381 | 7.788226% |
Noise dominated data is calculated using 1-second bins in cleaned event files. If a bin has >2000 counts, and if more than 50% of those come from <1% of pixels, then it is considered to be noise-dominated and hence unusable.
| Quadrant | # 1 sec bins | Bins with >0 counts | Bins with >2000 counts | High rate bins dominated by noise | Noise dominated (total time) | Noise dominated (detector-on time) | Marked lightcurve |
|---|---|---|---|---|---|---|---|
| A | 6985 | 4893 | 67 | 67 | 0.96% | 1.37% | 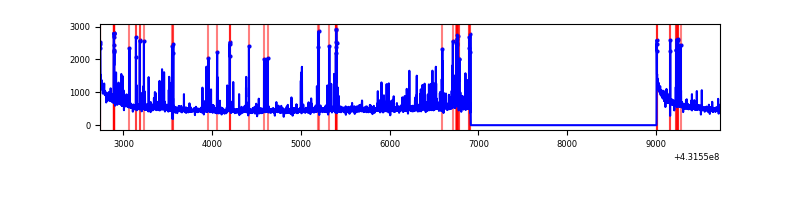 |
| B | 6985 | 4893 | 17 | 17 | 0.24% | 0.35% | 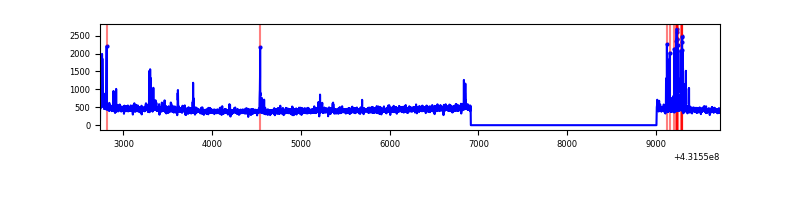 |
| C | 6985 | 4893 | 12 | 12 | 0.17% | 0.25% | 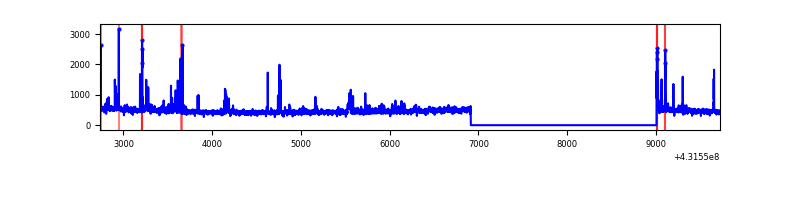 |
| D | 6985 | 4893 | 418 | 418 | 5.98% | 8.54% | 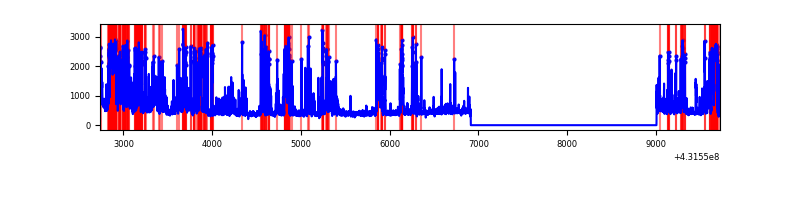 |
Top three noisy pixels from each quadrant. If the there are fewer than three noisy pixels in the level2.evt file, extra rows are filled as -1
| Pixel properties | Quadrant properties | ||||||
|---|---|---|---|---|---|---|---|
| Quadrant | DetID | PixID | Counts | Sigma | Mean | Median | Sigma |
| A | 10 | 83 | 530119 | 5052.37 | 510 | 500 | 104.8 |
| A | 15 | 237 | 277365 | 2641.19 | 510 | 500 | 104.8 |
| A | 15 | 190 | 63550 | 601.47 | 510 | 500 | 104.8 |
| B | 5 | 172 | 107067 | 1068.47 | 517 | 500 | 99.7 |
| B | 4 | 171 | 41708 | 413.16 | 517 | 500 | 99.7 |
| B | 5 | 255 | 17228 | 167.72 | 517 | 500 | 99.7 |
| C | 15 | 214 | 200713 | 1670.32 | 510 | 514 | 119.9 |
| C | 14 | 254 | 90464 | 750.48 | 510 | 514 | 119.9 |
| C | 12 | 2 | 82592 | 684.8 | 510 | 514 | 119.9 |
| D | 1 | 47 | 637033 | 5270.88 | 491 | 474 | 120.8 |
| D | 12 | 6 | 404070 | 3341.89 | 491 | 474 | 120.8 |
| D | 13 | 249 | 327388 | 2706.94 | 491 | 474 | 120.8 |
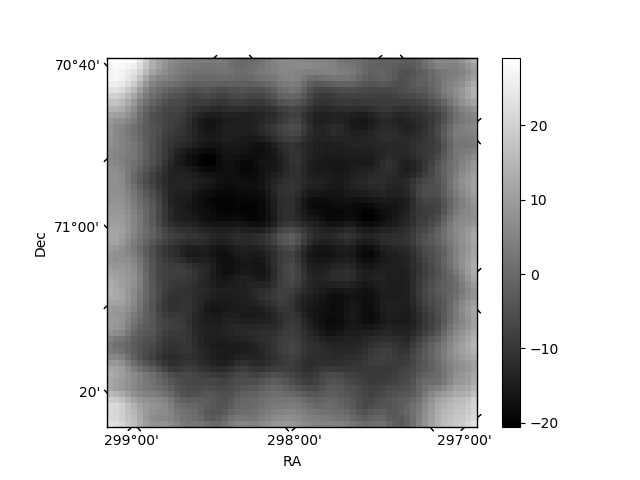
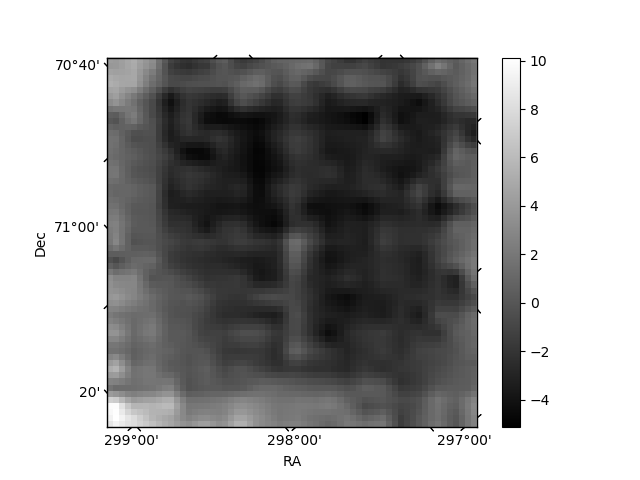
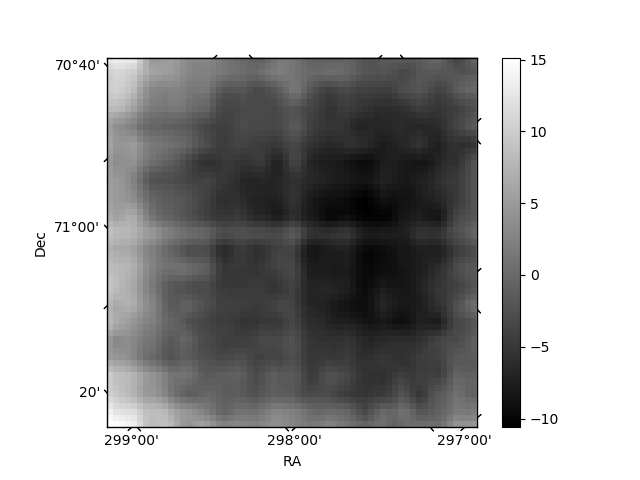
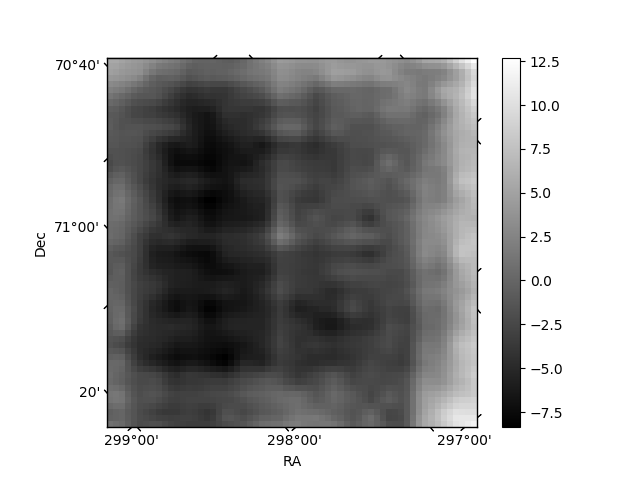
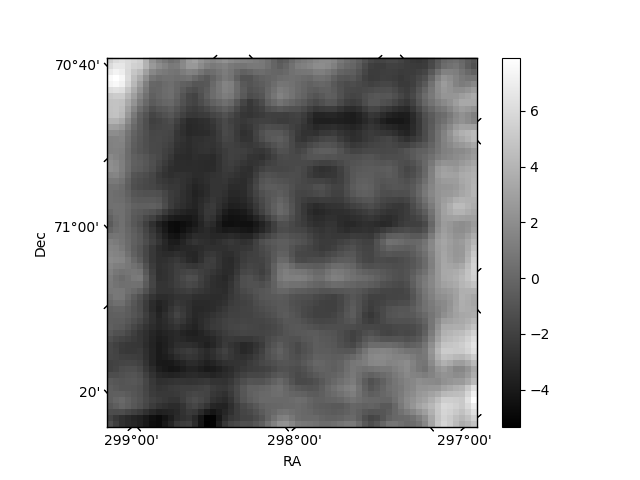
Histogram calculated using DETX and DETY for each event in the final _common_clean file
| Quadrant A | 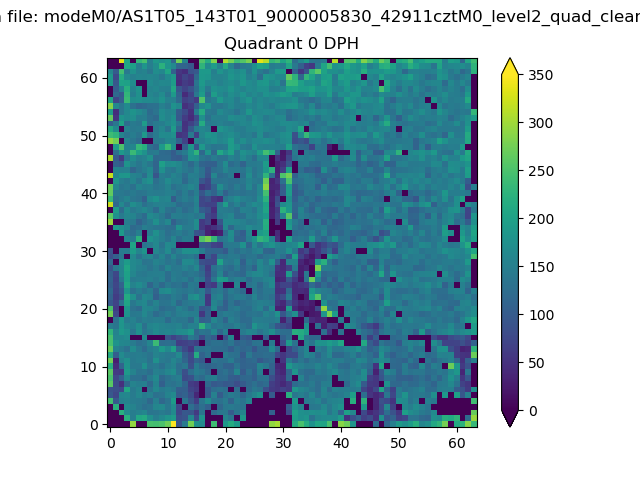 |
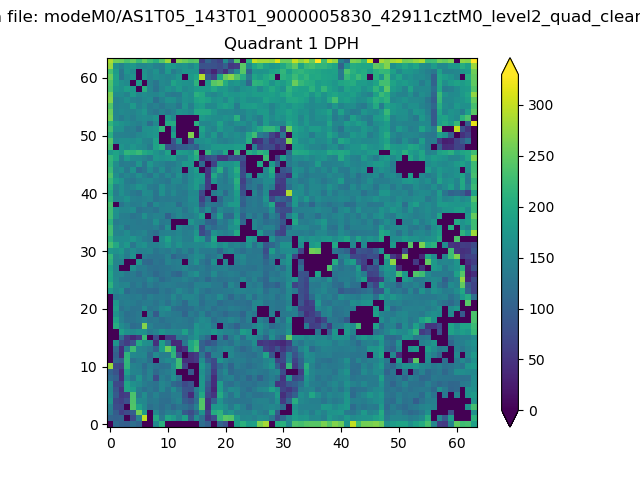 |
Quadrant B |
|---|---|---|---|
| Quadrant D | 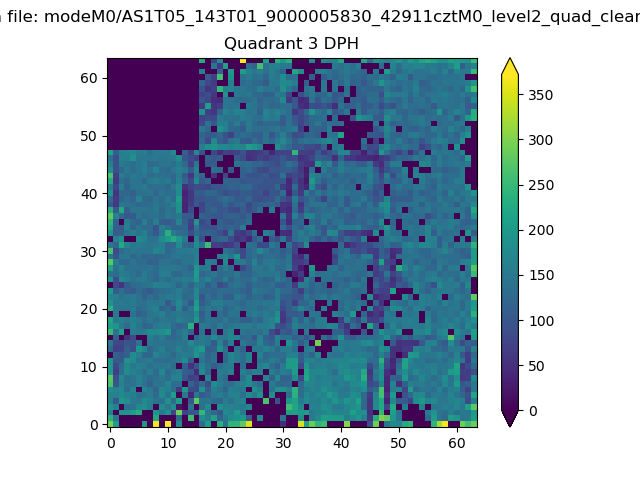 |
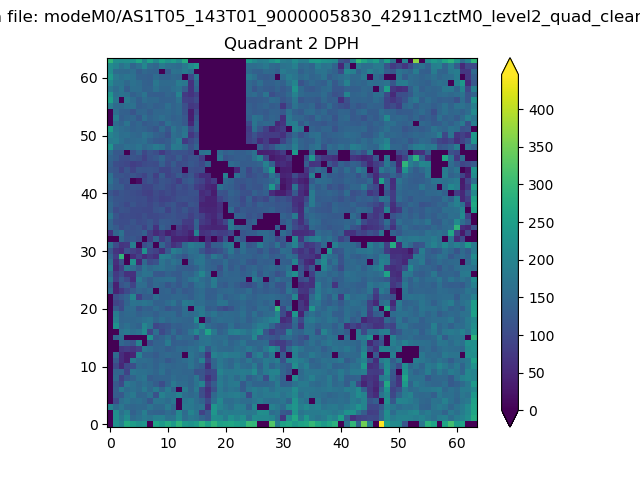 |
Quadrant C |
| Plot type | Count rate plots | Images |
|---|---|---|
| Comparison with Poisson distribution Blue bars denote a histogram of data divided into 1 sec bins. Red curve is a Poisson curve with rate = median count rate of data. |
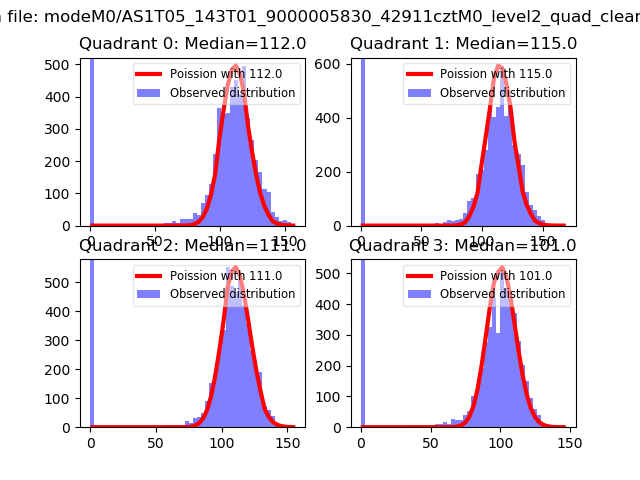 |
 |
| Quadrant-wise count rates Data is divided into 100 sec bins |
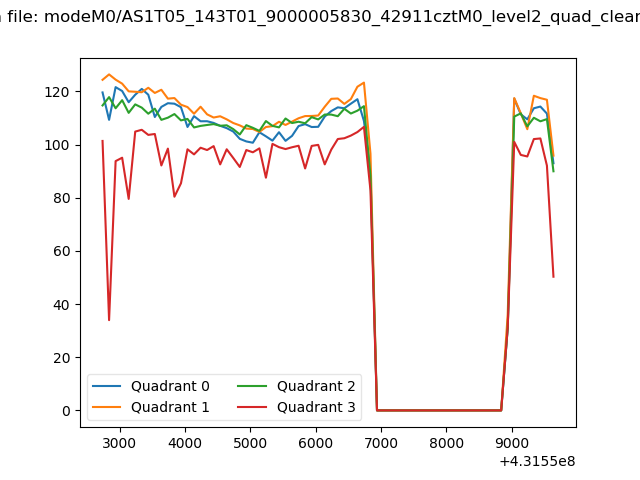 |
|
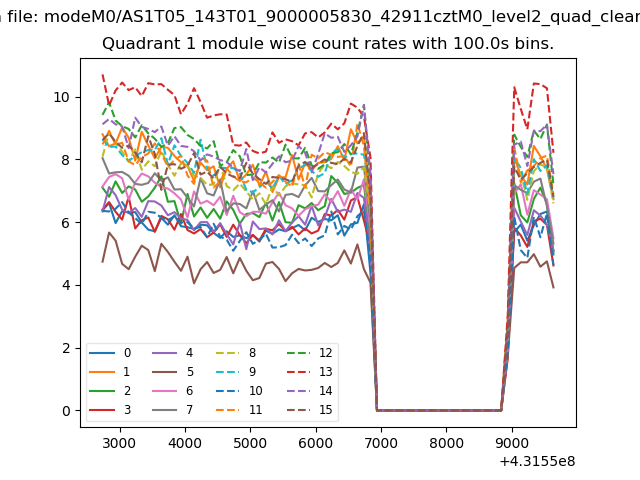
| Module-wise count rates for Quadrant A Data is divided into 100 sec bins |
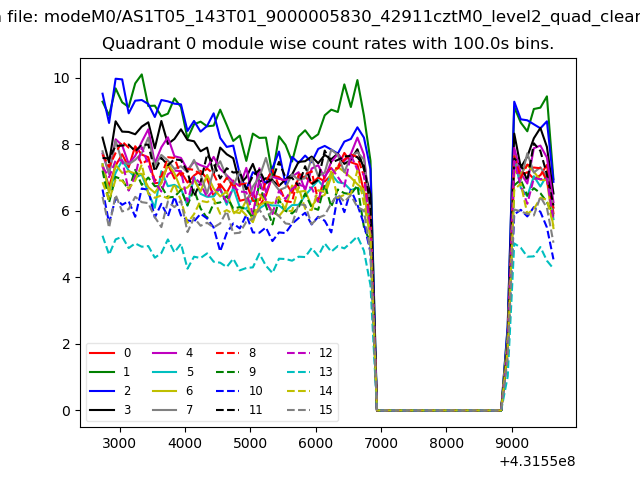 |
 |
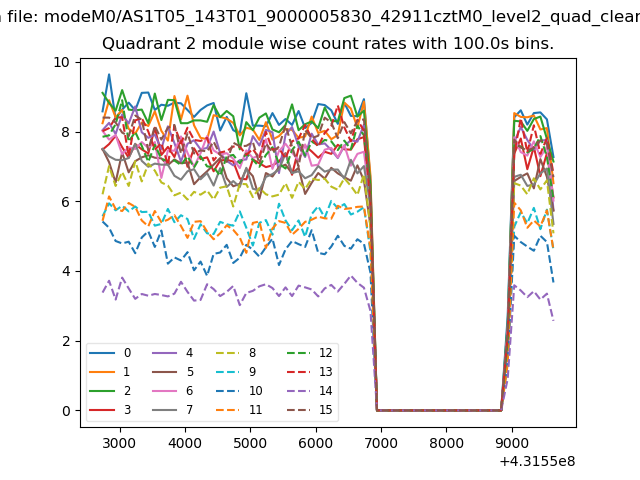
| Module-wise count rates for Quadrant B Data is divided into 100 sec bins |
 |
 |
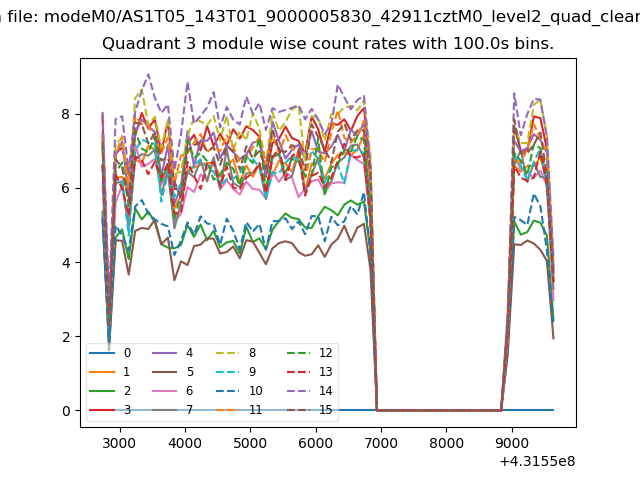
| Module-wise count rates for Quadrant C Data is divided into 100 sec bins |
 |
 |
| Module-wise count rates for Quadrant D Data is divided into 100 sec bins |
 |
 |
| Parameter | Plot |
|---|---|
| CZT HV Monitor | 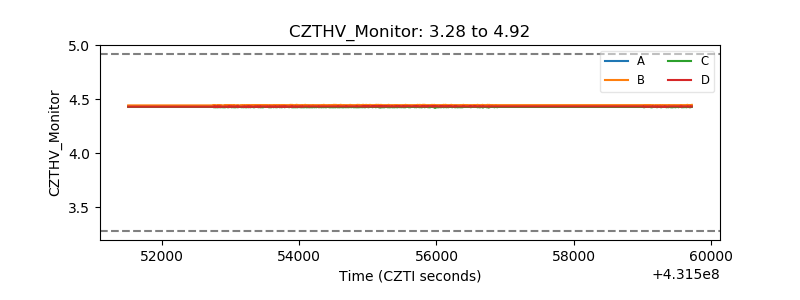 |
| D_VDD | 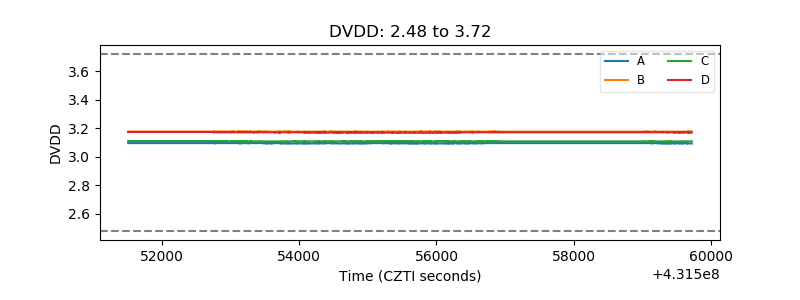 |
| Temperature 1 |  |
| Veto HV Monitor | 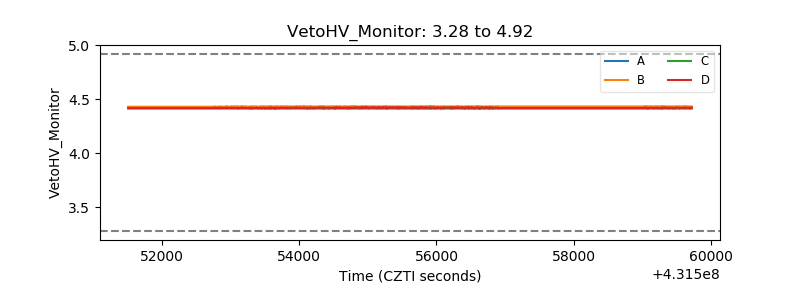 |
| Veto LLD | 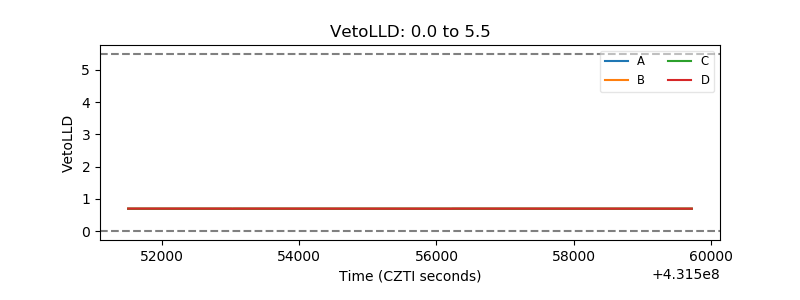 |
| Alpha Counter | 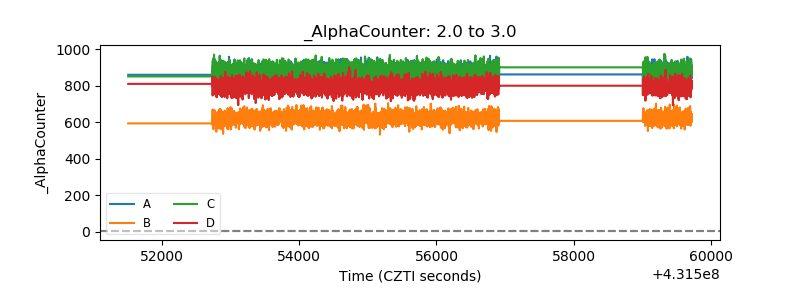 |
| _CPM_Rate | 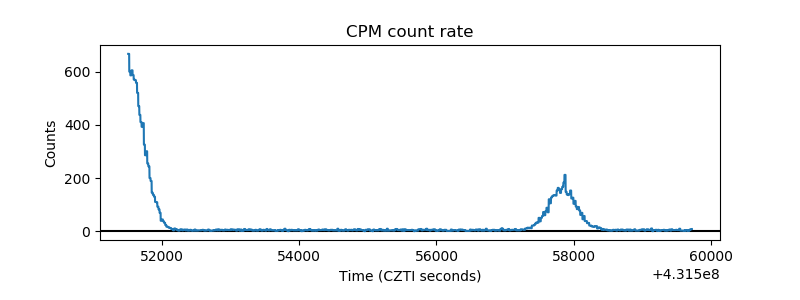 |
| CZT Counter | 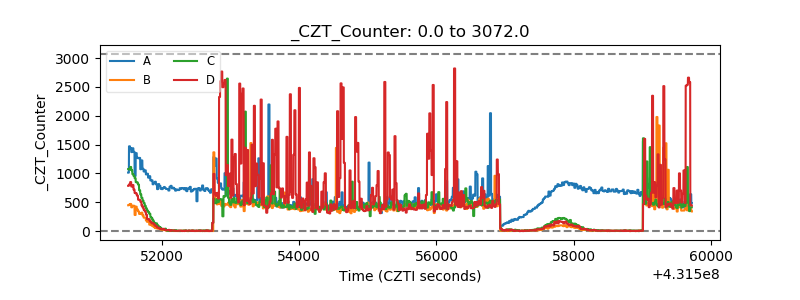 |
| +2.5 Volts monitor | 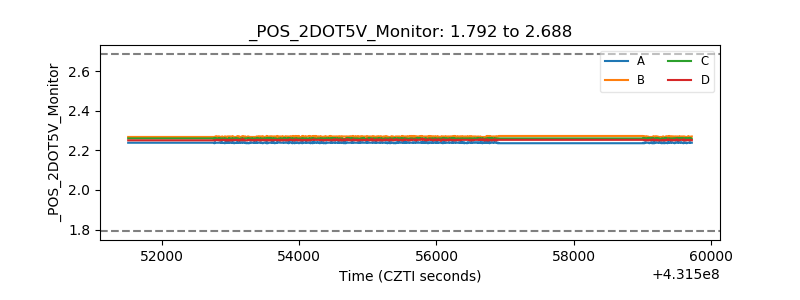 |
| +5 Volts monitor | 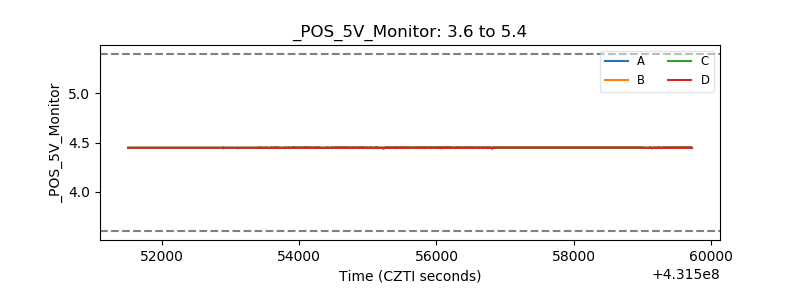 |
| _ROLL_ROT | 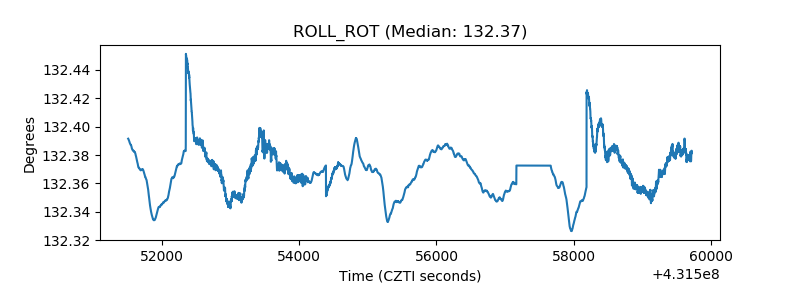 |
| _Roll_DEC | 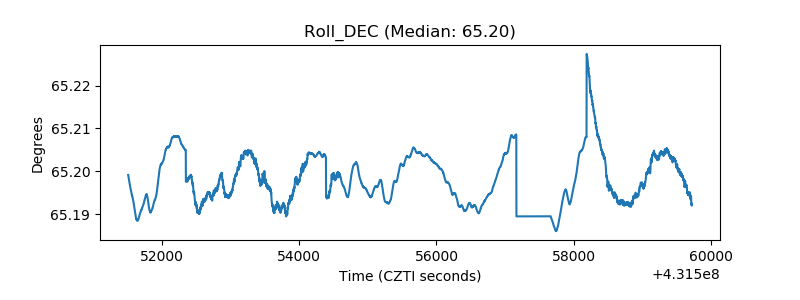 |
| _Roll_RA | 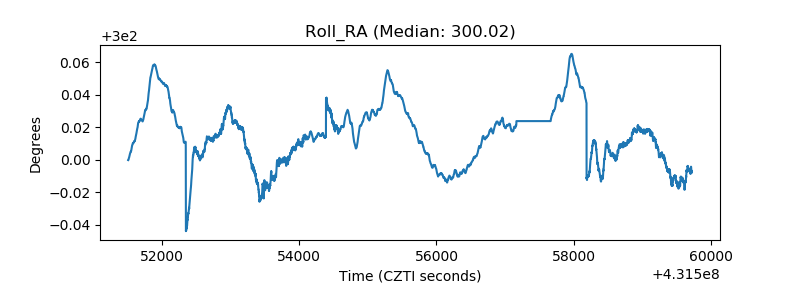 |
| Veto Counter | 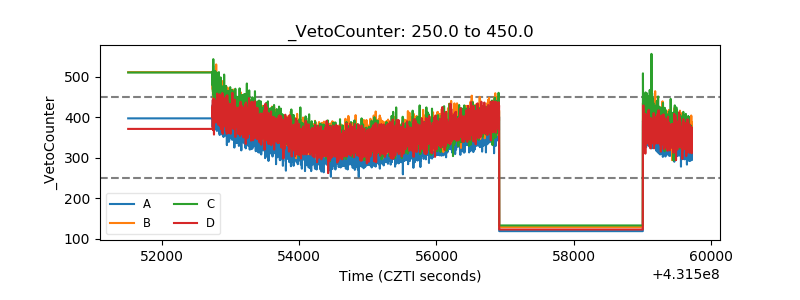 |