| Param | Original file | Final file |
|---|---|---|
| Filename | modeM0/AS1T05_143T01_9000005830_42912cztM0_level2.fits | modeM0/AS1T05_143T01_9000005830_42912cztM0_level2_quad_clean.evt |
| Size (bytes) | 380,436,480 | 80,372,160 |
| Size | 362.8 MB | 76.6 MB |
| Events in quadrant A | 3,079,074 | 545,215 |
| Events in quadrant B | 5,117,670 | 500,258 |
| Events in quadrant C | 2,348,632 | 542,594 |
| Events in quadrant D | 3,140,732 | 488,091 |
| Mode M0 | |||
|---|---|---|---|
| Quadrant | BADHDUFLAG | Total packets | Discarded packets |
| A | 0 | 12426 | 2 |
| B | 0 | 18904 | 2 |
| C | 0 | 10466 | 2 |
| D | 0 | 13226 | 2 |
| Mode M9 | |||
|---|---|---|---|
| Quadrant | BADHDUFLAG | Total packets | Discarded packets |
| A | 0 | 30 | 0 |
| B | 0 | 31 | 0 |
| C | 0 | 31 | 0 |
| D | 0 | 31 | 0 |
| Mode SS | |||
|---|---|---|---|
| Quadrant | BADHDUFLAG | Total packets | Discarded packets |
| A | 0 | 106 | 0 |
| B | 0 | 106 | 0 |
| C | 0 | 106 | 0 |
| D | 0 | 106 | 0 |
| Quadrant | Total seconds | Saturated seconds | Saturation percentage |
|---|---|---|---|
| A | 5090 | 106 | 2.082515% |
| B | 5090 | 832 | 16.345776% |
| C | 5090 | 19 | 0.373281% |
| D | 5090 | 214 | 4.204322% |
Noise dominated data is calculated using 1-second bins in cleaned event files. If a bin has >2000 counts, and if more than 50% of those come from <1% of pixels, then it is considered to be noise-dominated and hence unusable.
| Quadrant | # 1 sec bins | Bins with >0 counts | Bins with >2000 counts | High rate bins dominated by noise | Noise dominated (total time) | Noise dominated (detector-on time) | Marked lightcurve |
|---|---|---|---|---|---|---|---|
| A | 6913 | 5091 | 88 | 88 | 1.27% | 1.73% | 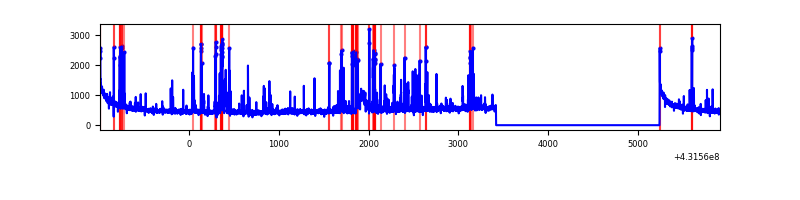 |
| B | 6913 | 5091 | 733 | 733 | 10.60% | 14.40% | 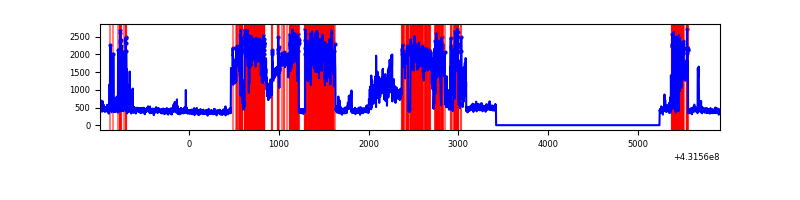 |
| C | 6913 | 5091 | 14 | 14 | 0.20% | 0.27% | 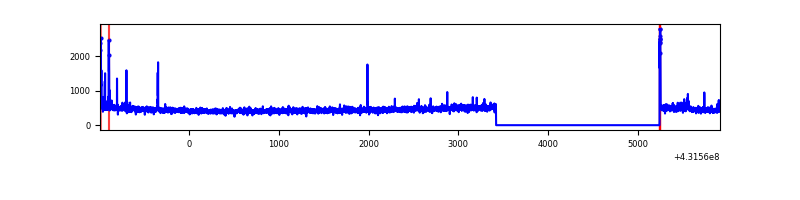 |
| D | 6913 | 5091 | 209 | 209 | 3.02% | 4.11% | 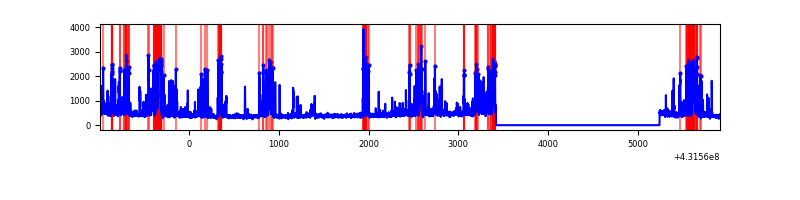 |
Top three noisy pixels from each quadrant. If the there are fewer than three noisy pixels in the level2.evt file, extra rows are filled as -1
| Pixel properties | Quadrant properties | ||||||
|---|---|---|---|---|---|---|---|
| Quadrant | DetID | PixID | Counts | Sigma | Mean | Median | Sigma |
| A | 10 | 83 | 543197 | 4940.62 | 528 | 517 | 109.8 |
| A | 15 | 237 | 425812 | 3871.94 | 528 | 517 | 109.8 |
| A | 2 | 79 | 61699 | 557.01 | 528 | 517 | 109.8 |
| B | 0 | 229 | 2963812 | 29345.31 | 517 | 500 | 101.0 |
| B | 5 | 172 | 95917 | 944.9 | 517 | 500 | 101.0 |
| B | 12 | 111 | 12552 | 119.35 | 517 | 500 | 101.0 |
| C | 15 | 214 | 208033 | 1713.48 | 522 | 525 | 121.1 |
| C | 12 | 2 | 64466 | 527.99 | 522 | 525 | 121.1 |
| C | 8 | 79 | 14033 | 111.54 | 522 | 525 | 121.1 |
| D | 12 | 6 | 244852 | 1948.22 | 512 | 498 | 125.4 |
| D | 1 | 47 | 214168 | 1703.58 | 512 | 498 | 125.4 |
| D | 2 | 249 | 154384 | 1226.93 | 512 | 498 | 125.4 |
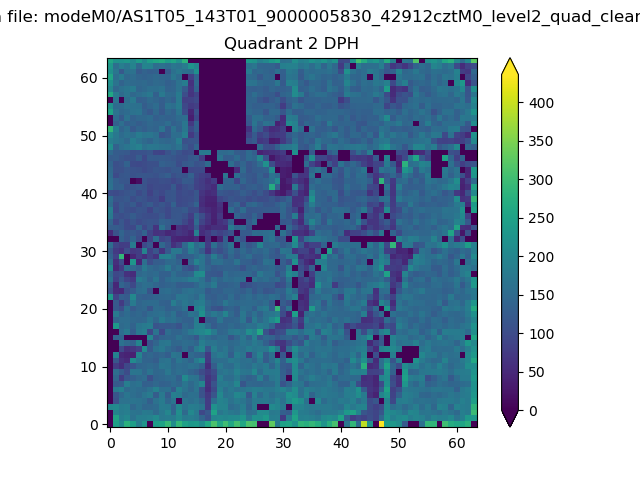
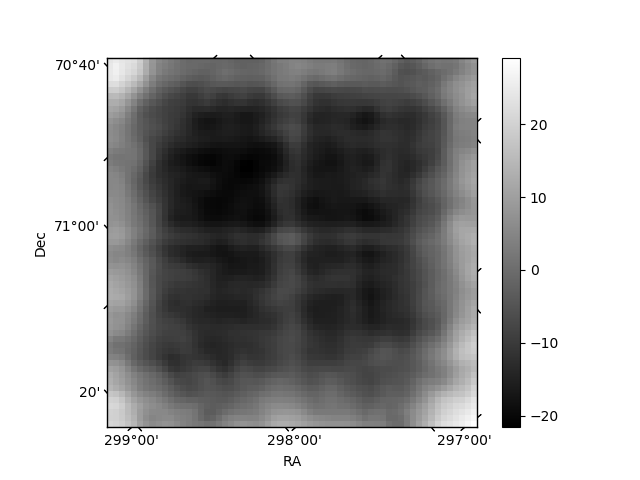
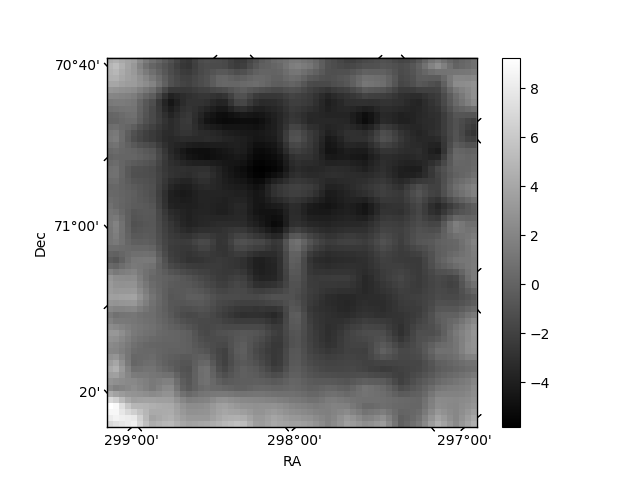
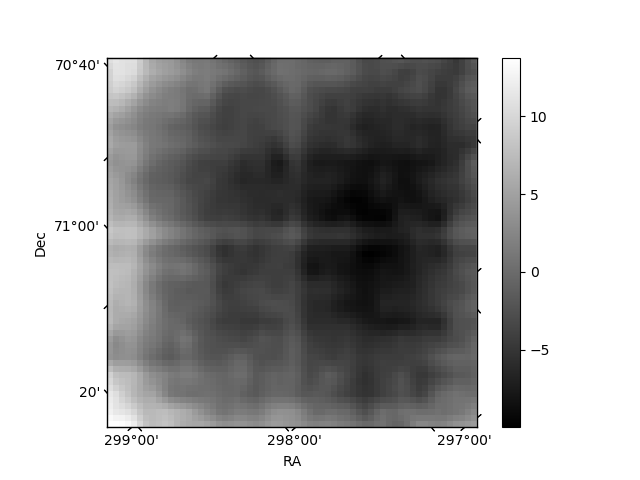
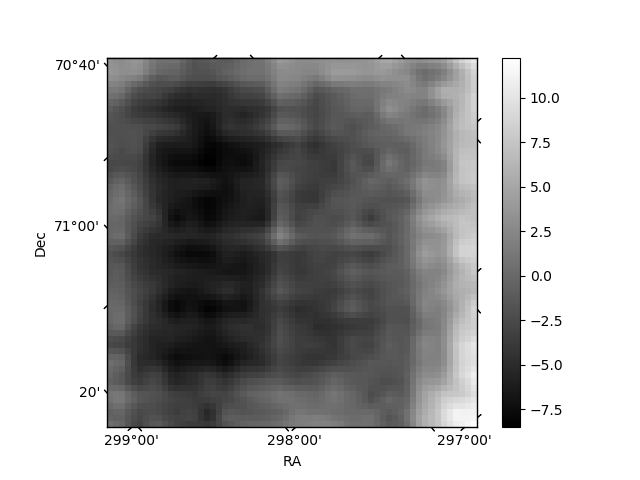
Histogram calculated using DETX and DETY for each event in the final _common_clean file
| Quadrant A | 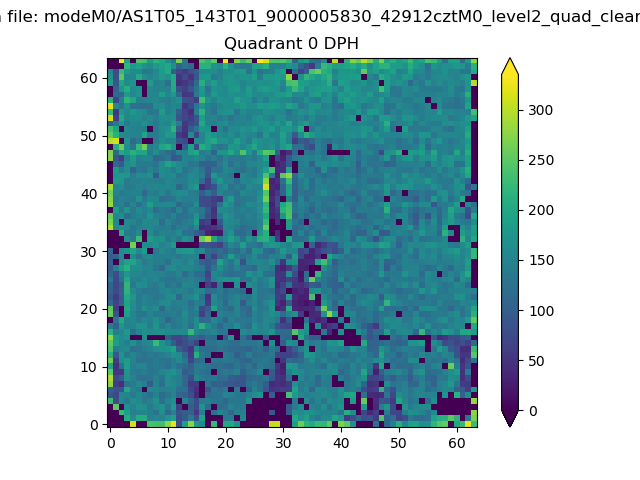 |
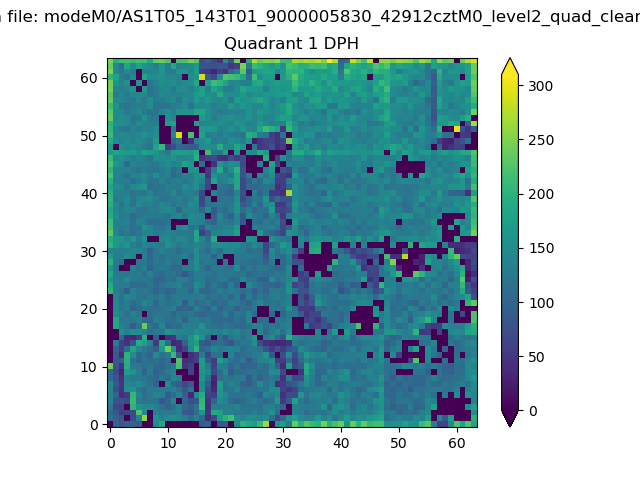 |
Quadrant B |
|---|---|---|---|
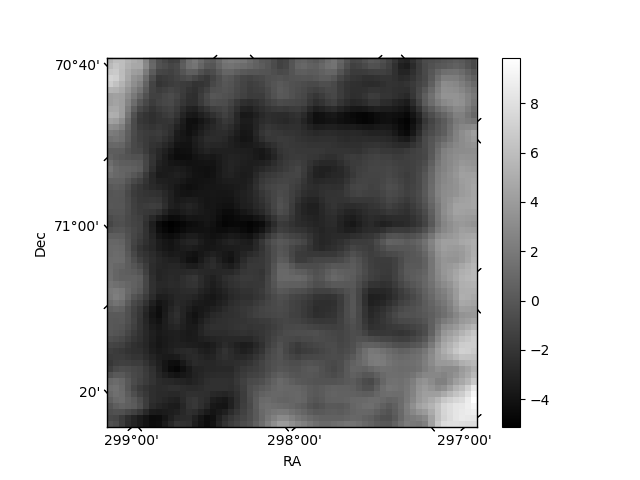
| Quadrant D | 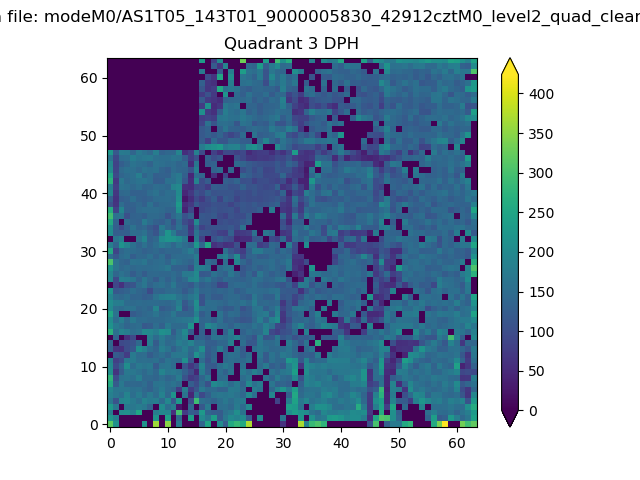 |
 |
Quadrant C |
| Plot type | Count rate plots | Images |
|---|---|---|
| Comparison with Poisson distribution Blue bars denote a histogram of data divided into 1 sec bins. Red curve is a Poisson curve with rate = median count rate of data. |
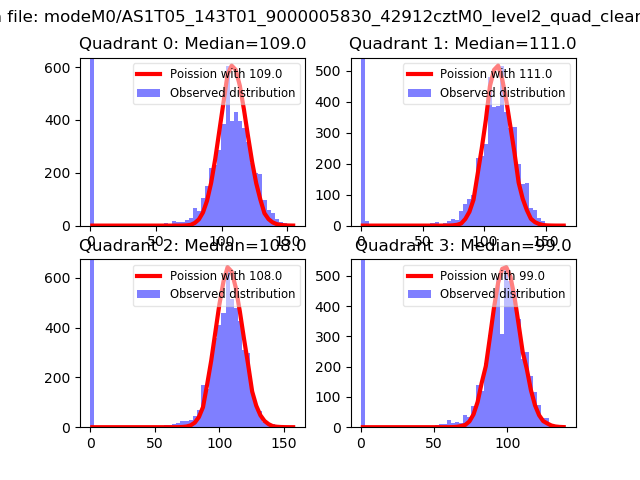 |
 |
| Quadrant-wise count rates Data is divided into 100 sec bins |
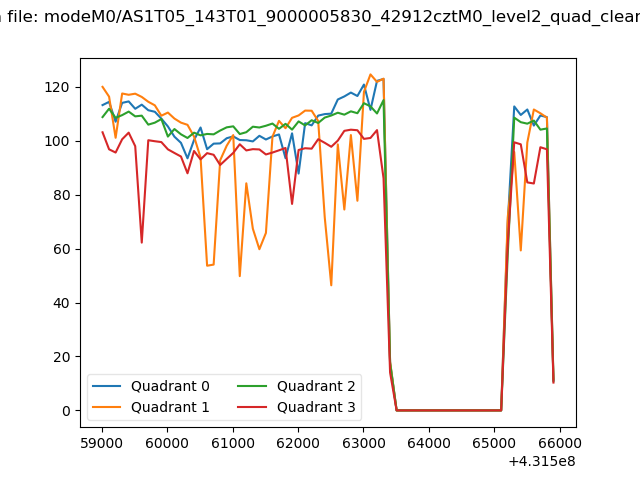 |
|
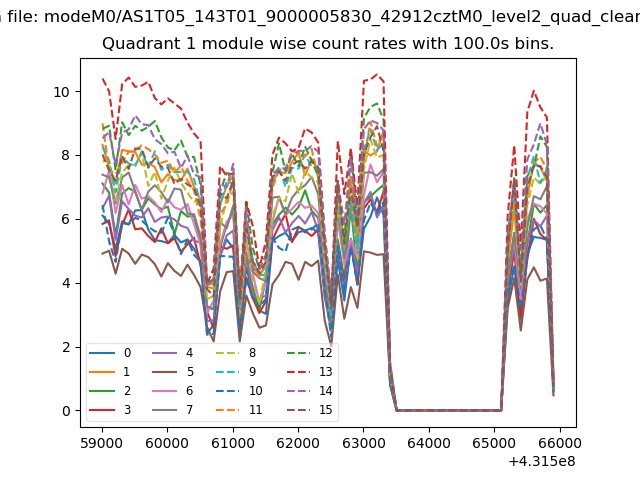
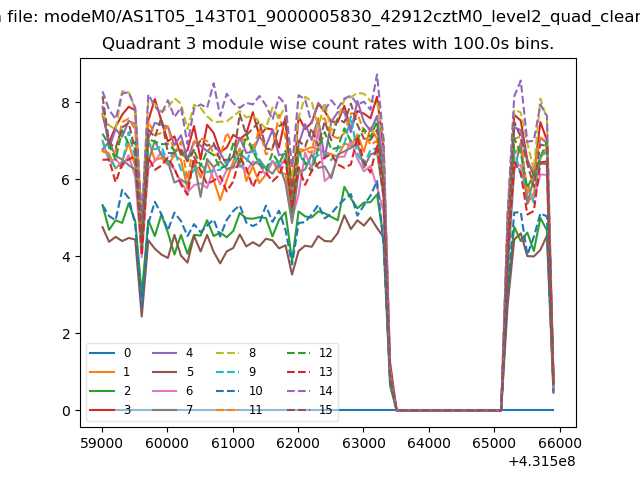
| Module-wise count rates for Quadrant A Data is divided into 100 sec bins |
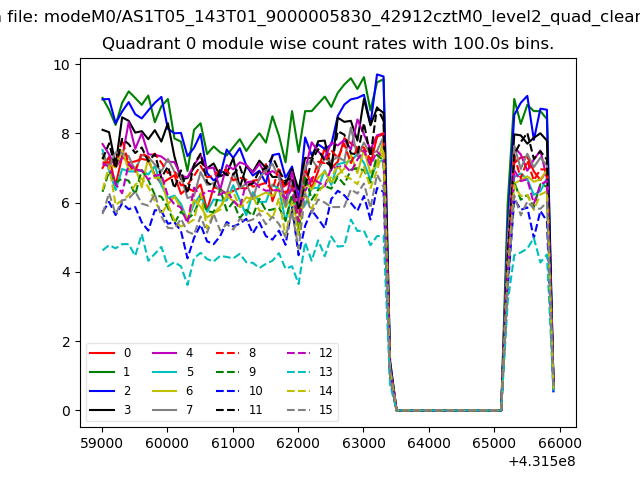 |
 |
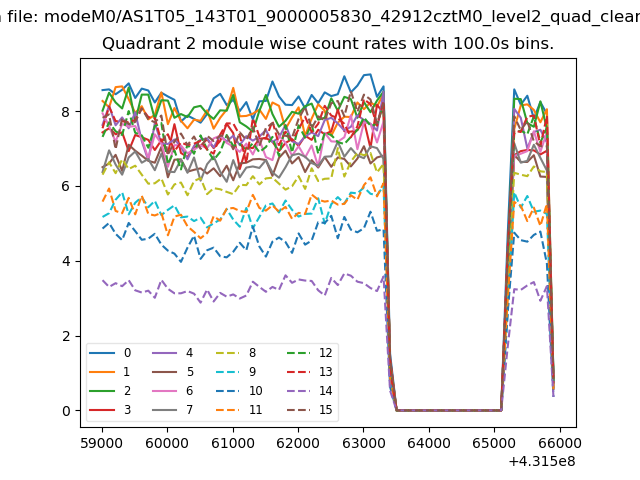
| Module-wise count rates for Quadrant B Data is divided into 100 sec bins |
 |
 |
| Module-wise count rates for Quadrant C Data is divided into 100 sec bins |
 |
 |
| Module-wise count rates for Quadrant D Data is divided into 100 sec bins |
 |
 |
| Parameter | Plot |
|---|---|
| CZT HV Monitor | 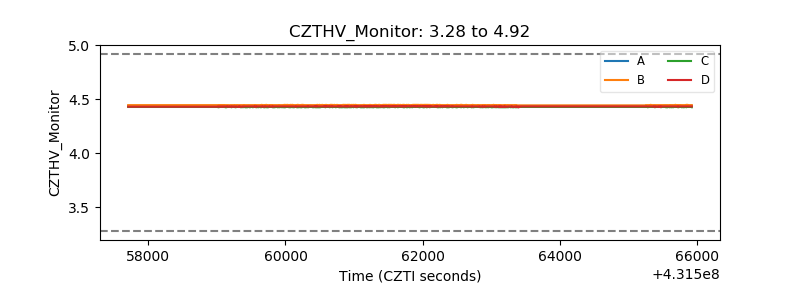 |
| D_VDD | 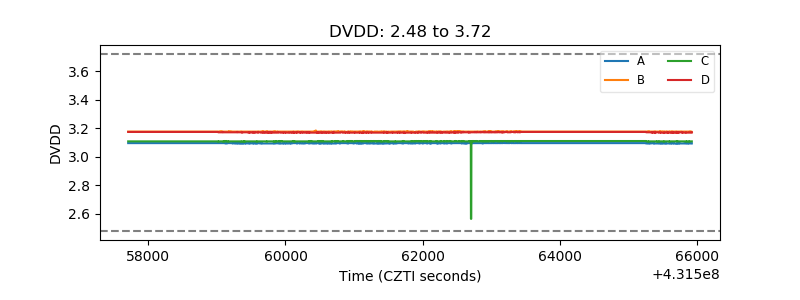 |
| Temperature 1 | 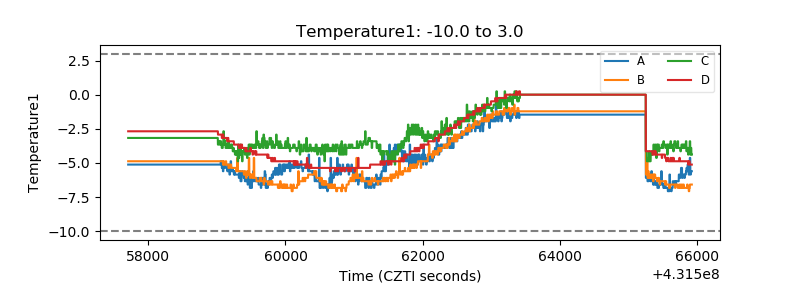 |
| Veto HV Monitor | 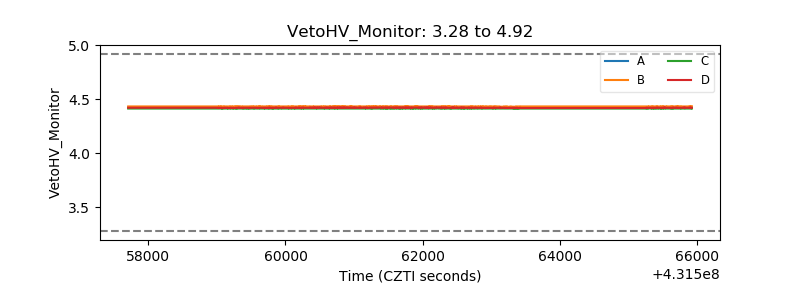 |
| Veto LLD | 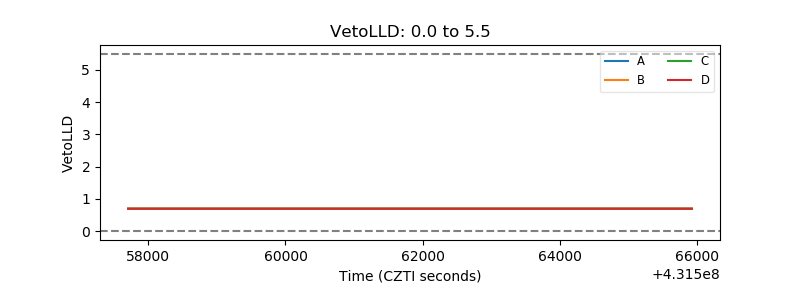 |
| Alpha Counter | 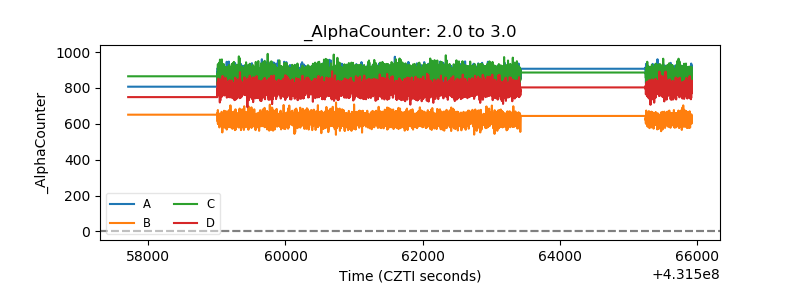 |
| _CPM_Rate | 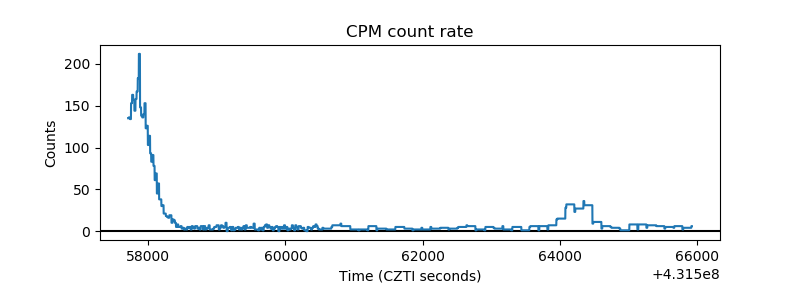 |
| CZT Counter | 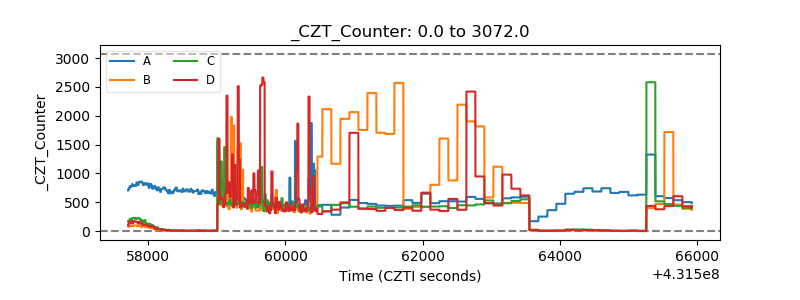 |
| +2.5 Volts monitor | 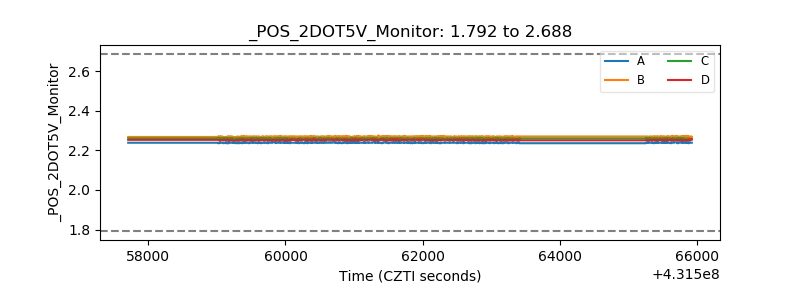 |
| +5 Volts monitor | 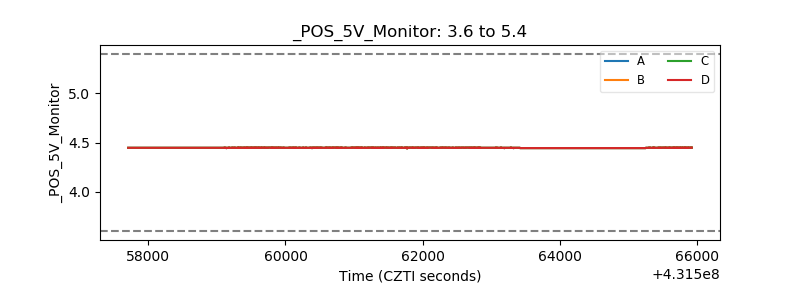 |
| _ROLL_ROT | 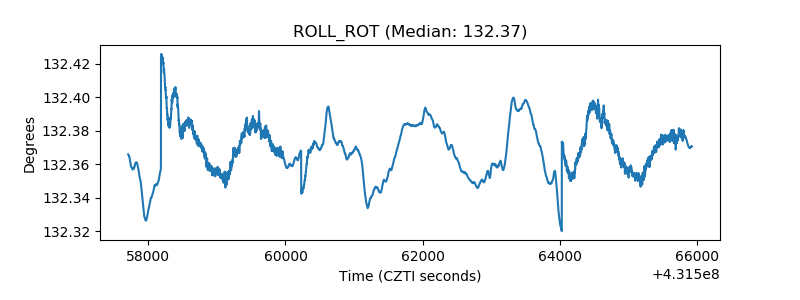 |
| _Roll_DEC | 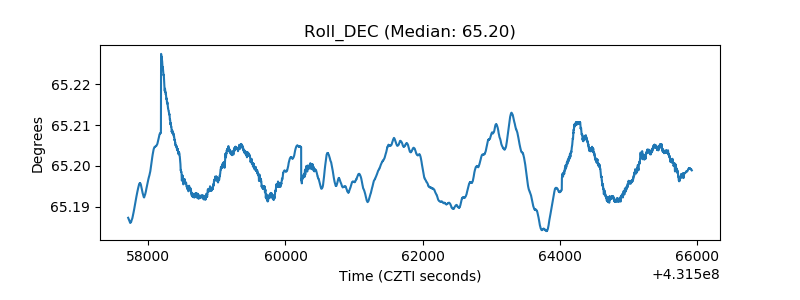 |
| _Roll_RA | 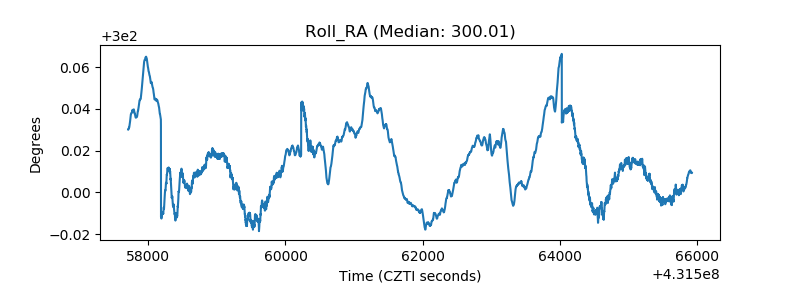 |
| Veto Counter | 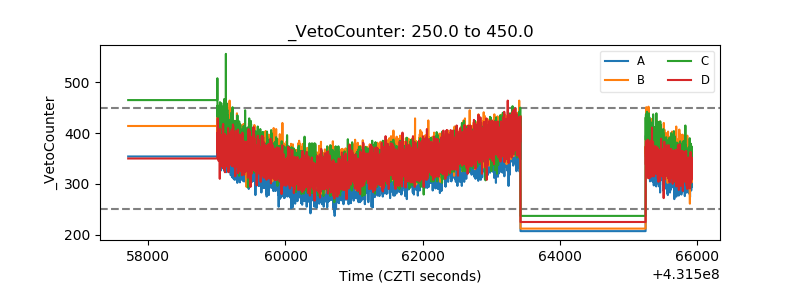 |