| Param | Original file | Final file |
|---|---|---|
| Filename | modeM0/AS1T05_143T01_9000005830_42913cztM0_level2.fits | modeM0/AS1T05_143T01_9000005830_42913cztM0_level2_quad_clean.evt |
| Size (bytes) | 369,077,760 | 89,789,760 |
| Size | 352.0 MB | 85.6 MB |
| Events in quadrant A | 3,585,349 | 594,262 |
| Events in quadrant B | 2,840,372 | 612,275 |
| Events in quadrant C | 2,711,186 | 592,744 |
| Events in quadrant D | 4,084,616 | 524,240 |
| Mode M0 | |||
|---|---|---|---|
| Quadrant | BADHDUFLAG | Total packets | Discarded packets |
| A | 0 | 14311 | 2 |
| B | 0 | 12622 | 2 |
| C | 0 | 11864 | 2 |
| D | 0 | 16497 | 2 |
| Mode M9 | |||
|---|---|---|---|
| Quadrant | BADHDUFLAG | Total packets | Discarded packets |
| A | 0 | 30 | 0 |
| B | 0 | 31 | 0 |
| C | 0 | 31 | 0 |
| D | 0 | 31 | 0 |
| Mode SS | |||
|---|---|---|---|
| Quadrant | BADHDUFLAG | Total packets | Discarded packets |
| A | 0 | 114 | 0 |
| B | 0 | 114 | 0 |
| C | 0 | 114 | 0 |
| D | 0 | 114 | 0 |
| Quadrant | Total seconds | Saturated seconds | Saturation percentage |
|---|---|---|---|
| A | 5655 | 176 | 3.112290% |
| B | 5655 | 132 | 2.334218% |
| C | 5655 | 15 | 0.265252% |
| D | 5655 | 397 | 7.020336% |
Noise dominated data is calculated using 1-second bins in cleaned event files. If a bin has >2000 counts, and if more than 50% of those come from <1% of pixels, then it is considered to be noise-dominated and hence unusable.
| Quadrant | # 1 sec bins | Bins with >0 counts | Bins with >2000 counts | High rate bins dominated by noise | Noise dominated (total time) | Noise dominated (detector-on time) | Marked lightcurve |
|---|---|---|---|---|---|---|---|
| A | 7148 | 5656 | 150 | 150 | 2.10% | 2.65% | 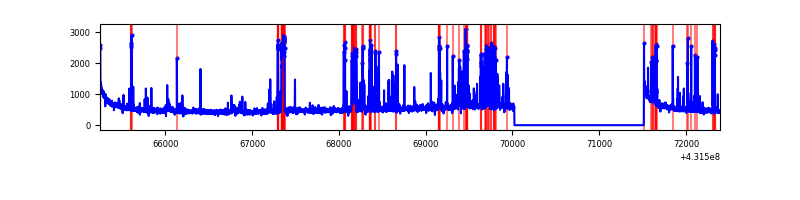 |
| B | 7148 | 5656 | 110 | 110 | 1.54% | 1.94% | 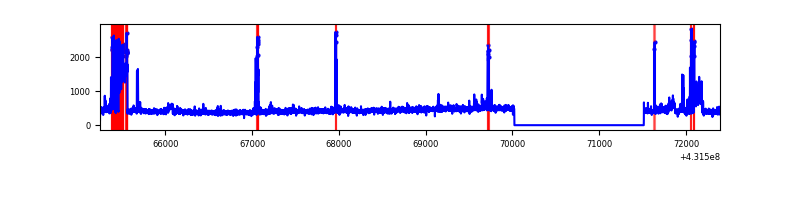 |
| C | 7148 | 5656 | 9 | 9 | 0.13% | 0.16% | 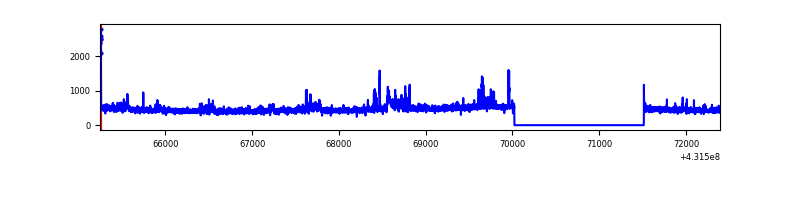 |
| D | 7148 | 5656 | 421 | 421 | 5.89% | 7.44% | 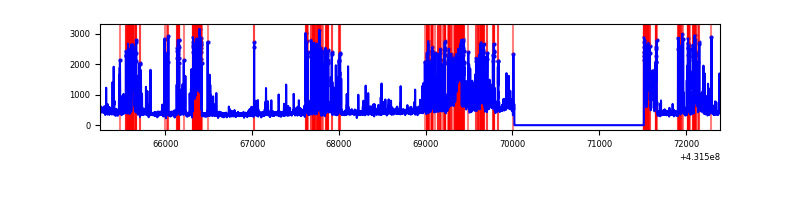 |
Top three noisy pixels from each quadrant. If the there are fewer than three noisy pixels in the level2.evt file, extra rows are filled as -1
| Pixel properties | Quadrant properties | ||||||
|---|---|---|---|---|---|---|---|
| Quadrant | DetID | PixID | Counts | Sigma | Mean | Median | Sigma |
| A | 15 | 237 | 649012 | 5289.34 | 589 | 575 | 122.6 |
| A | 10 | 83 | 583863 | 4757.91 | 589 | 575 | 122.6 |
| A | 2 | 79 | 57225 | 462.1 | 589 | 575 | 122.6 |
| B | 0 | 229 | 318645 | 2727.43 | 594 | 576 | 116.6 |
| B | 4 | 81 | 75903 | 645.93 | 594 | 576 | 116.6 |
| B | 5 | 172 | 64186 | 545.45 | 594 | 576 | 116.6 |
| C | 15 | 214 | 230942 | 1686.96 | 583 | 587 | 136.6 |
| C | 8 | 79 | 148639 | 1084.23 | 583 | 587 | 136.6 |
| C | 12 | 2 | 42078 | 303.85 | 583 | 587 | 136.6 |
| D | 12 | 6 | 688195 | 4963.92 | 567 | 550 | 138.5 |
| D | 1 | 47 | 551392 | 3976.38 | 567 | 550 | 138.5 |
| D | 2 | 249 | 230040 | 1656.63 | 567 | 550 | 138.5 |
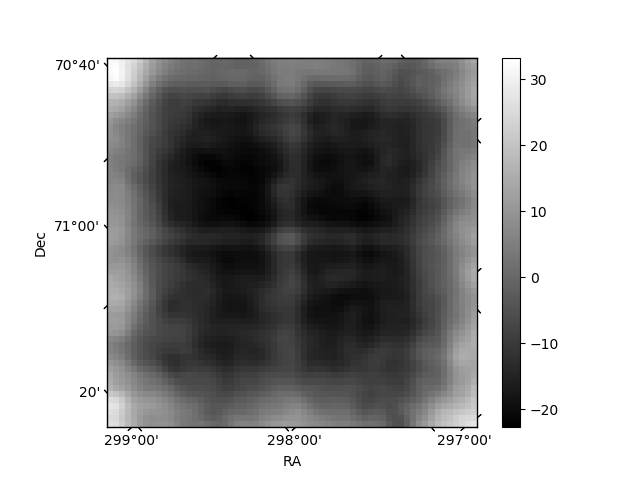
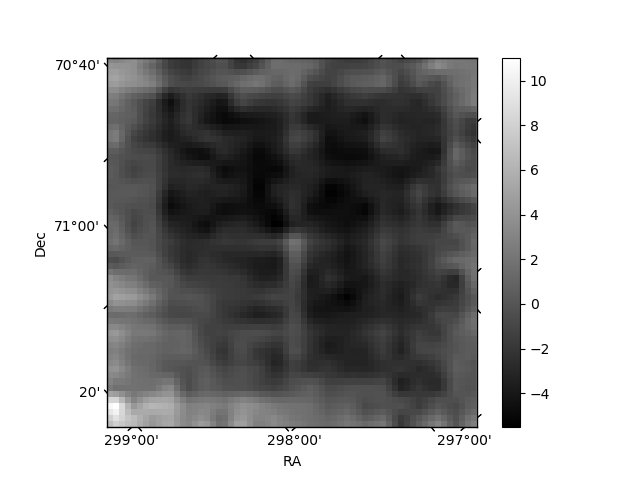
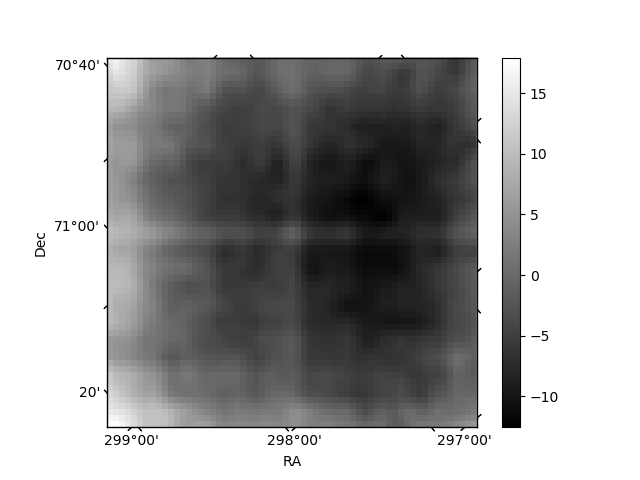
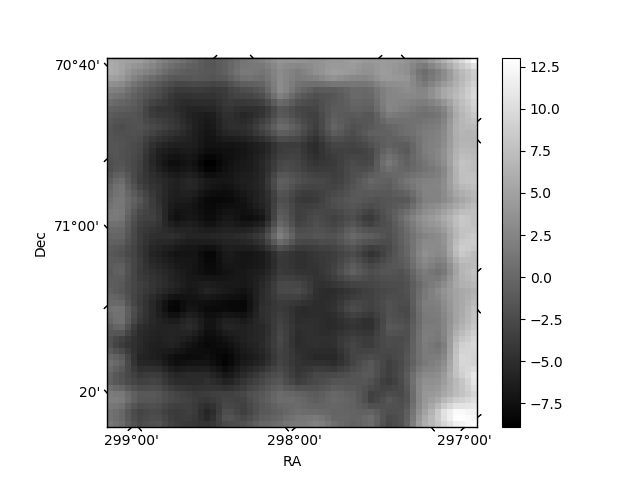
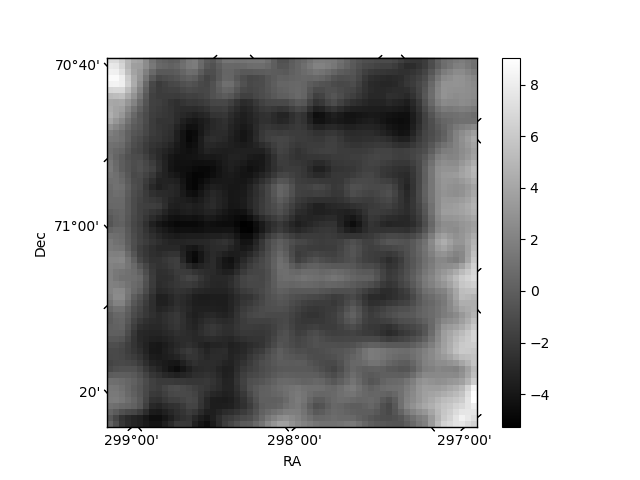
Histogram calculated using DETX and DETY for each event in the final _common_clean file
| Quadrant A | 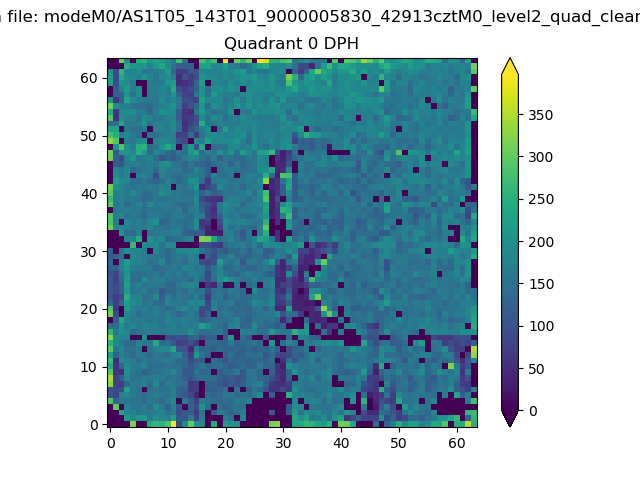 |
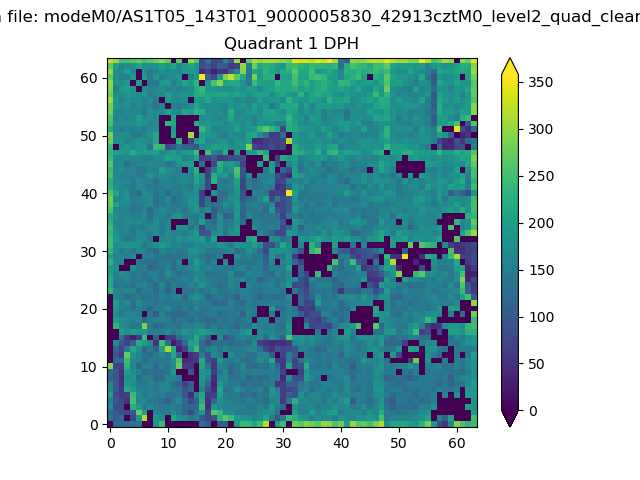 |
Quadrant B |
|---|---|---|---|
| Quadrant D | 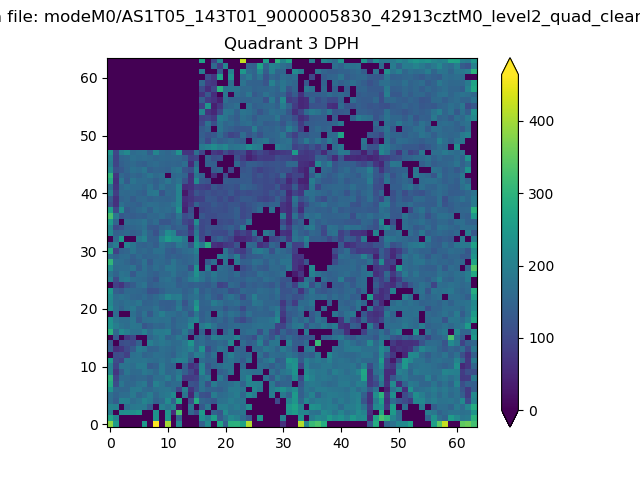 |
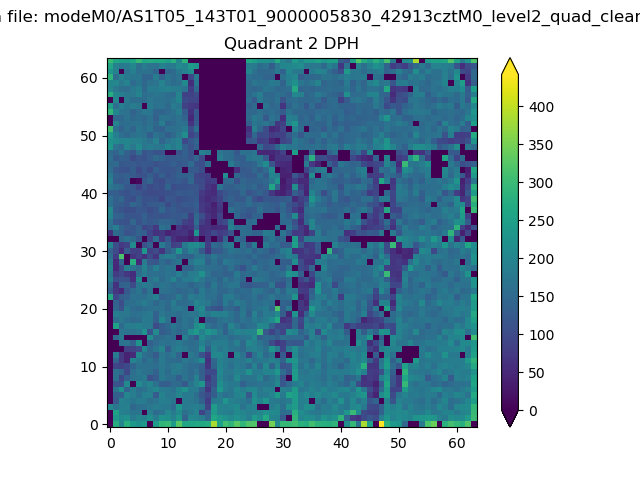 |
Quadrant C |
| Plot type | Count rate plots | Images |
|---|---|---|
| Comparison with Poisson distribution Blue bars denote a histogram of data divided into 1 sec bins. Red curve is a Poisson curve with rate = median count rate of data. |
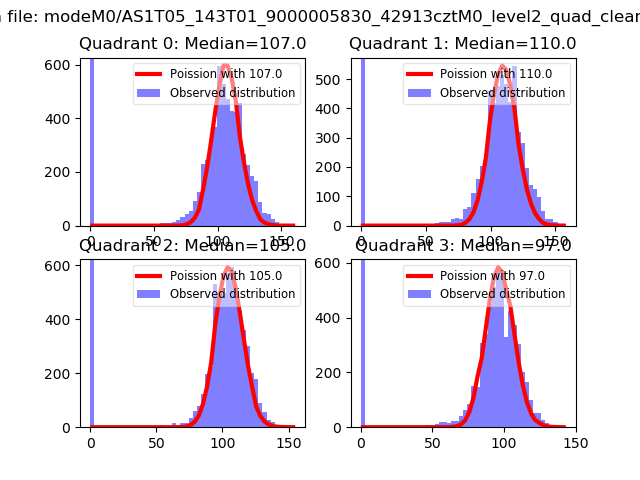 |
 |
| Quadrant-wise count rates Data is divided into 100 sec bins |
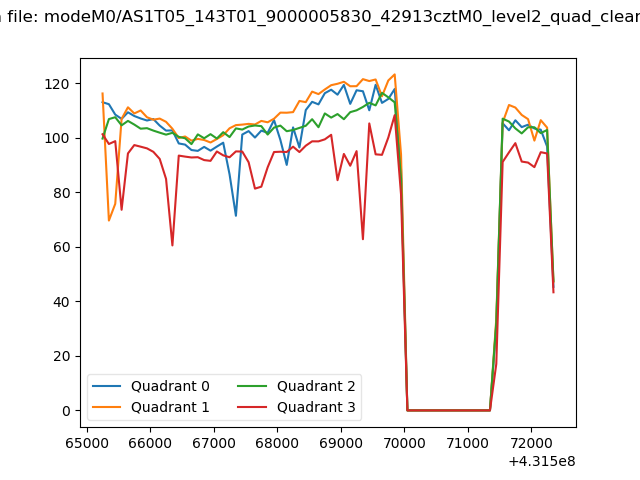 |
|
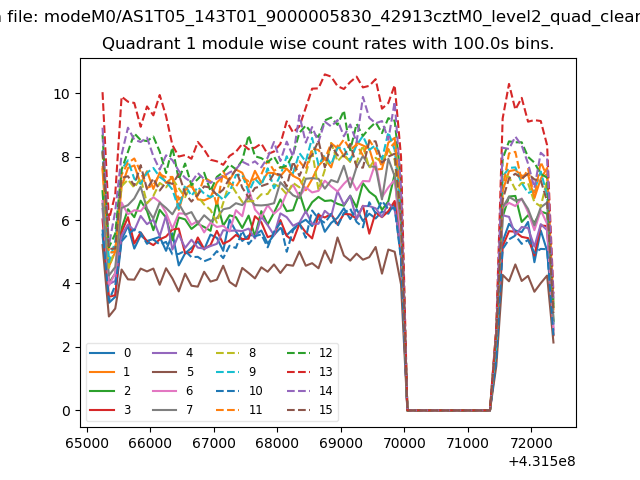
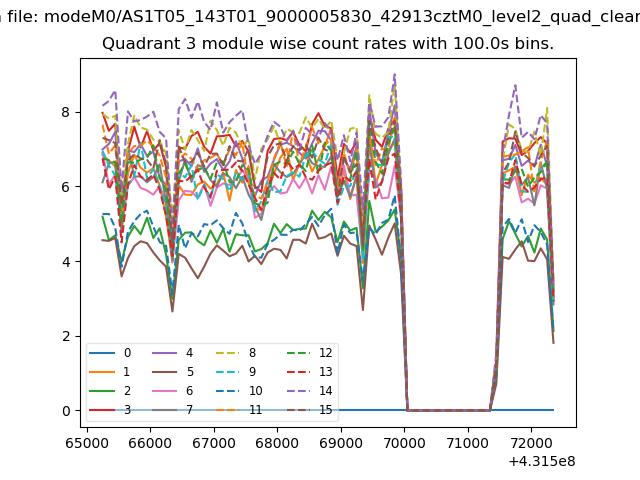
| Module-wise count rates for Quadrant A Data is divided into 100 sec bins |
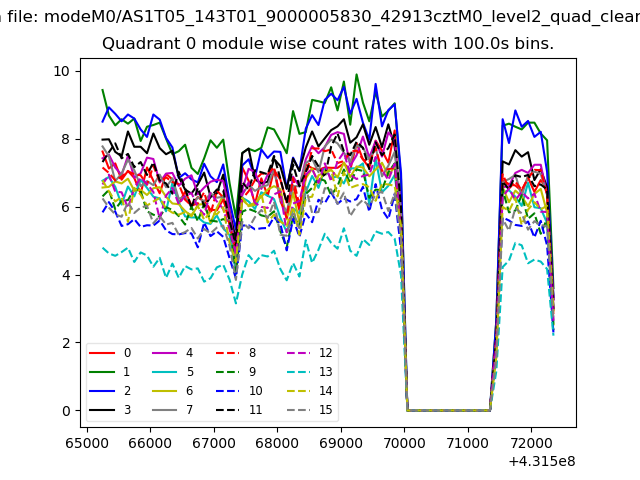 |
 |
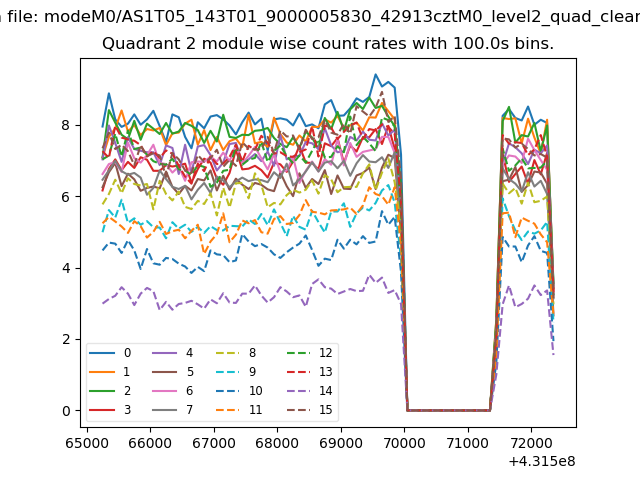
| Module-wise count rates for Quadrant B Data is divided into 100 sec bins |
 |
 |
| Module-wise count rates for Quadrant C Data is divided into 100 sec bins |
 |
 |
| Module-wise count rates for Quadrant D Data is divided into 100 sec bins |
 |
 |
| Parameter | Plot |
|---|---|
| CZT HV Monitor | 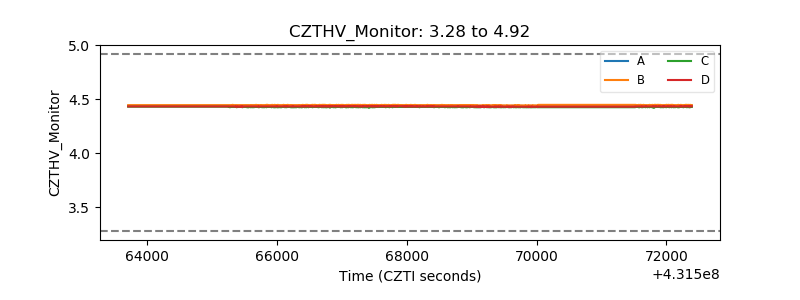 |
| D_VDD | 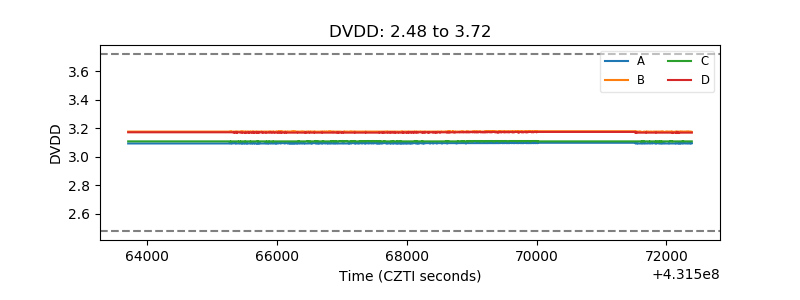 |
| Temperature 1 | 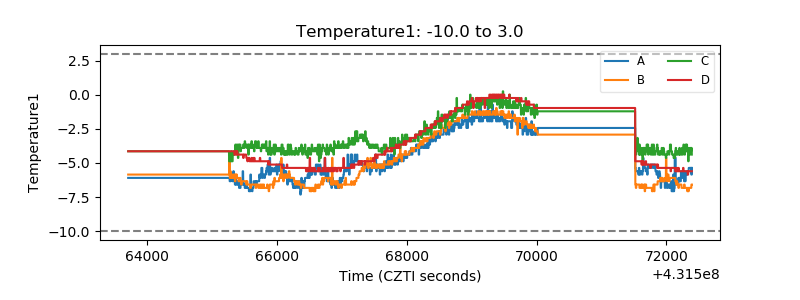 |
| Veto HV Monitor | 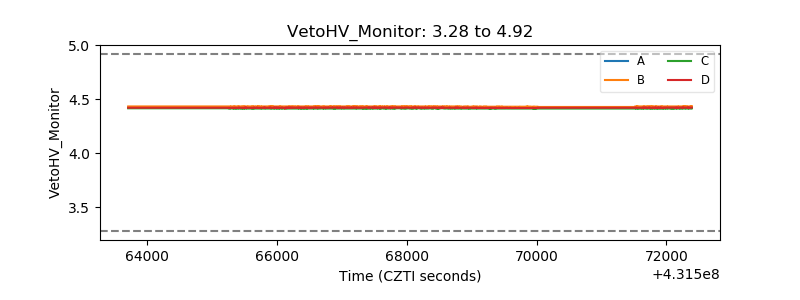 |
| Veto LLD | 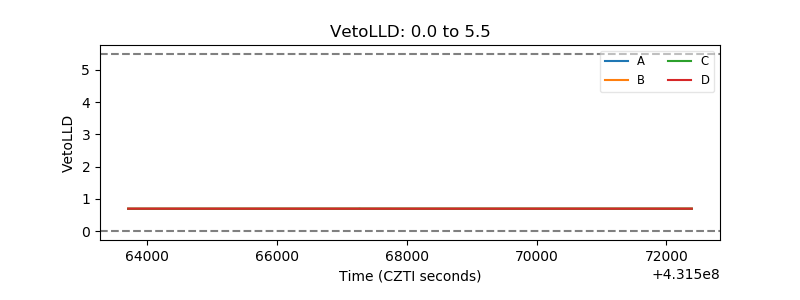 |
| Alpha Counter | 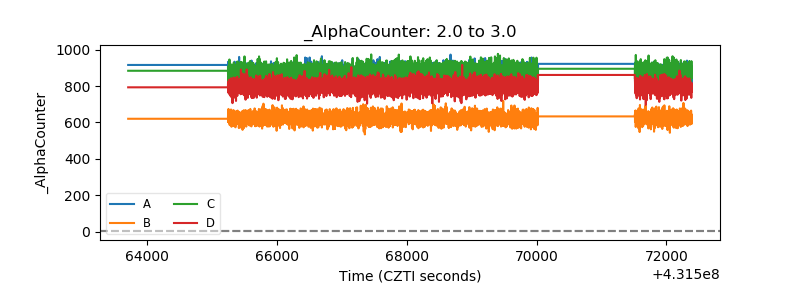 |
| _CPM_Rate | 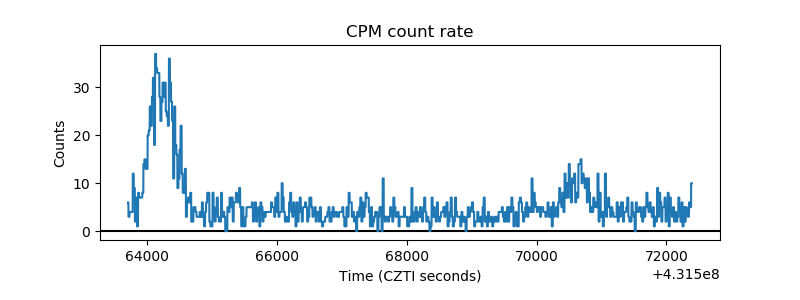 |
| CZT Counter | 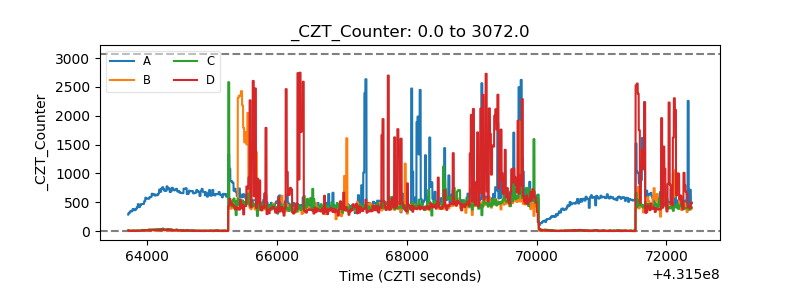 |
| +2.5 Volts monitor | 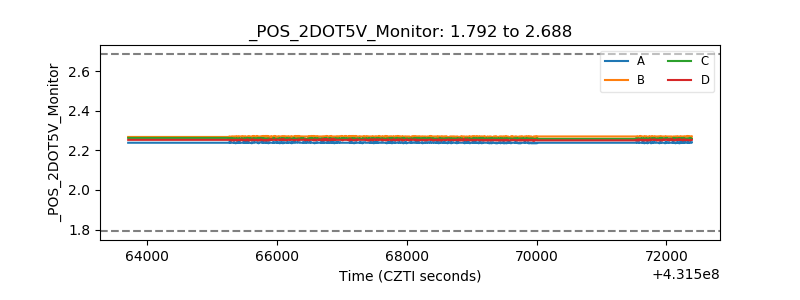 |
| +5 Volts monitor | 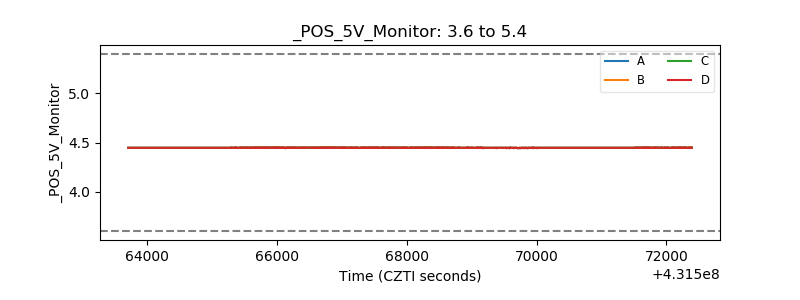 |
| _ROLL_ROT | 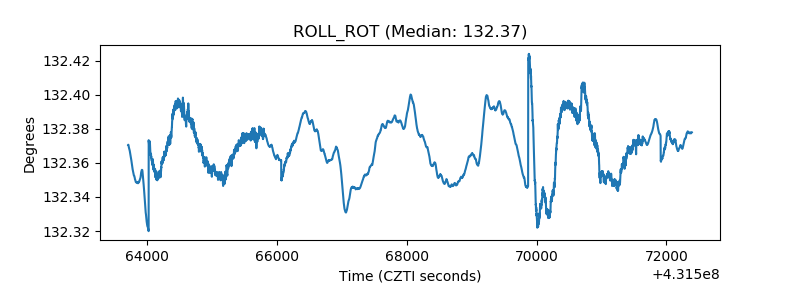 |
| _Roll_DEC | 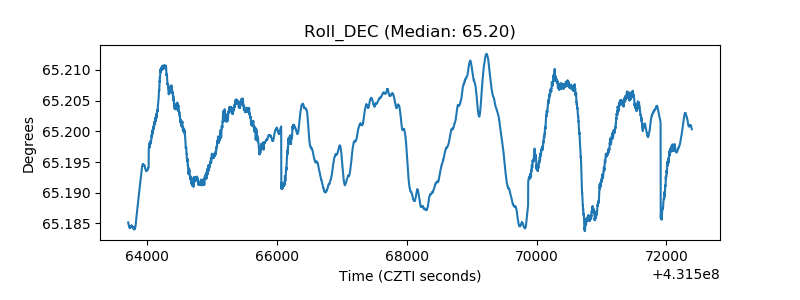 |
| _Roll_RA | 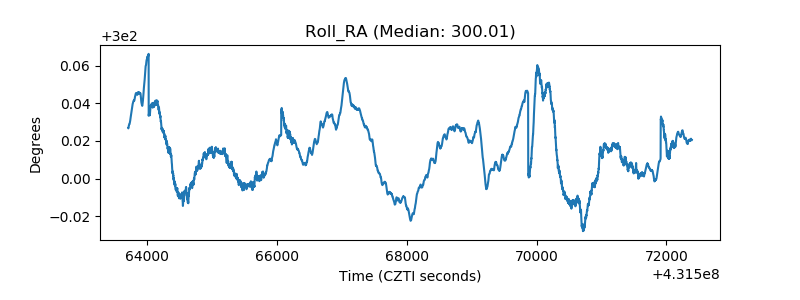 |
| Veto Counter | 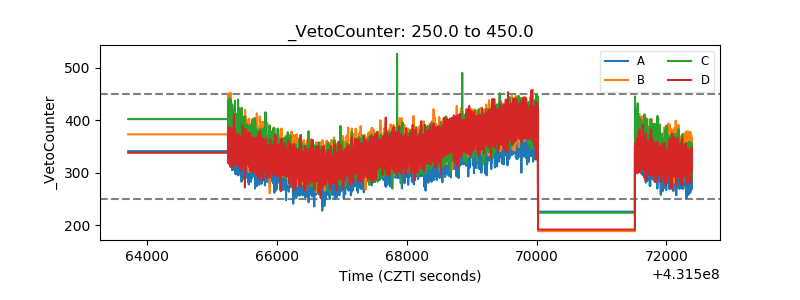 |