| Param | Original file | Final file |
|---|---|---|
| Filename | modeM0/AS1T05_143T01_9000005830_42914cztM0_level2.fits | modeM0/AS1T05_143T01_9000005830_42914cztM0_level2_quad_clean.evt |
| Size (bytes) | 420,240,960 | 97,632,000 |
| Size | 400.8 MB | 93.1 MB |
| Events in quadrant A | 4,019,093 | 643,305 |
| Events in quadrant B | 3,277,184 | 670,639 |
| Events in quadrant C | 2,964,820 | 645,754 |
| Events in quadrant D | 4,816,413 | 566,373 |
| Mode M0 | |||
|---|---|---|---|
| Quadrant | BADHDUFLAG | Total packets | Discarded packets |
| A | 0 | 15848 | 2 |
| B | 0 | 14086 | 2 |
| C | 0 | 12896 | 2 |
| D | 0 | 18820 | 5 |
| Mode M9 | |||
|---|---|---|---|
| Quadrant | BADHDUFLAG | Total packets | Discarded packets |
| A | 0 | 28 | 0 |
| B | 0 | 28 | 0 |
| C | 0 | 28 | 0 |
| D | 0 | 28 | 0 |
| Mode SS | |||
|---|---|---|---|
| Quadrant | BADHDUFLAG | Total packets | Discarded packets |
| A | 0 | 128 | 0 |
| B | 0 | 128 | 0 |
| C | 0 | 128 | 0 |
| D | 0 | 128 | 0 |
| Quadrant | Total seconds | Saturated seconds | Saturation percentage |
|---|---|---|---|
| A | 6153 | 216 | 3.510483% |
| B | 6154 | 110 | 1.787455% |
| C | 6154 | 9 | 0.146246% |
| D | 6153 | 474 | 7.703559% |
Noise dominated data is calculated using 1-second bins in cleaned event files. If a bin has >2000 counts, and if more than 50% of those come from <1% of pixels, then it is considered to be noise-dominated and hence unusable.
| Quadrant | # 1 sec bins | Bins with >0 counts | Bins with >2000 counts | High rate bins dominated by noise | Noise dominated (total time) | Noise dominated (detector-on time) | Marked lightcurve |
|---|---|---|---|---|---|---|---|
| A | 8957 | 6155 | 171 | 171 | 1.91% | 2.78% | 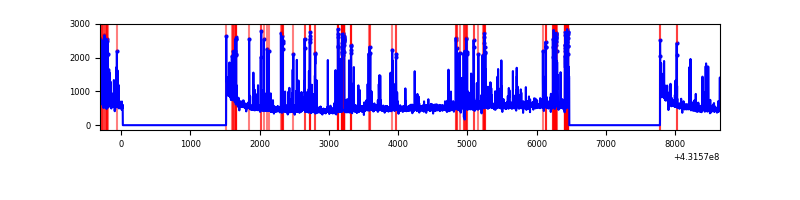 |
| B | 8958 | 6156 | 78 | 78 | 0.87% | 1.27% | 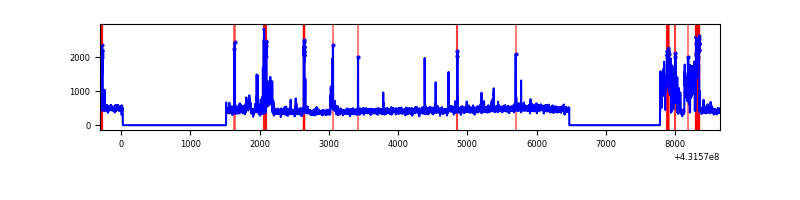 |
| C | 8958 | 6156 | 4 | 4 | 0.04% | 0.06% | 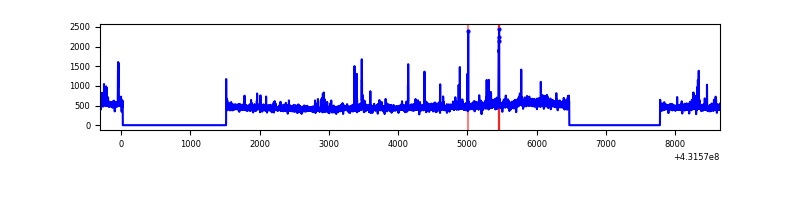 |
| D | 8957 | 6155 | 433 | 433 | 4.83% | 7.03% | 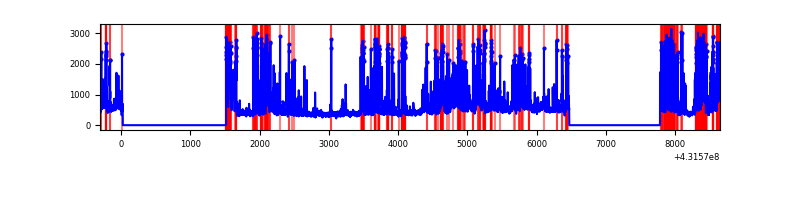 |
Top three noisy pixels from each quadrant. If the there are fewer than three noisy pixels in the level2.evt file, extra rows are filled as -1
| Pixel properties | Quadrant properties | ||||||
|---|---|---|---|---|---|---|---|
| Quadrant | DetID | PixID | Counts | Sigma | Mean | Median | Sigma |
| A | 15 | 237 | 734516 | 5414.05 | 652 | 636 | 135.6 |
| A | 10 | 83 | 642678 | 4736.53 | 652 | 636 | 135.6 |
| A | 2 | 79 | 114661 | 841.2 | 652 | 636 | 135.6 |
| B | 0 | 229 | 453683 | 3486.31 | 658 | 640 | 129.9 |
| B | 4 | 81 | 157583 | 1207.73 | 658 | 640 | 129.9 |
| B | 5 | 172 | 35573 | 268.82 | 658 | 640 | 129.9 |
| C | 15 | 214 | 251647 | 1660.94 | 647 | 651 | 151.1 |
| C | 8 | 79 | 73571 | 482.54 | 647 | 651 | 151.1 |
| C | 14 | 254 | 38089 | 247.74 | 647 | 651 | 151.1 |
| D | 12 | 6 | 724003 | 4743.09 | 625 | 607 | 152.5 |
| D | 1 | 47 | 716032 | 4690.83 | 625 | 607 | 152.5 |
| D | 2 | 249 | 317598 | 2078.42 | 625 | 607 | 152.5 |
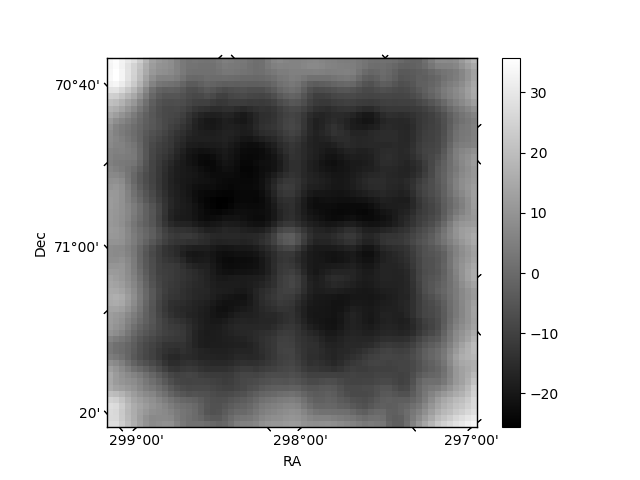
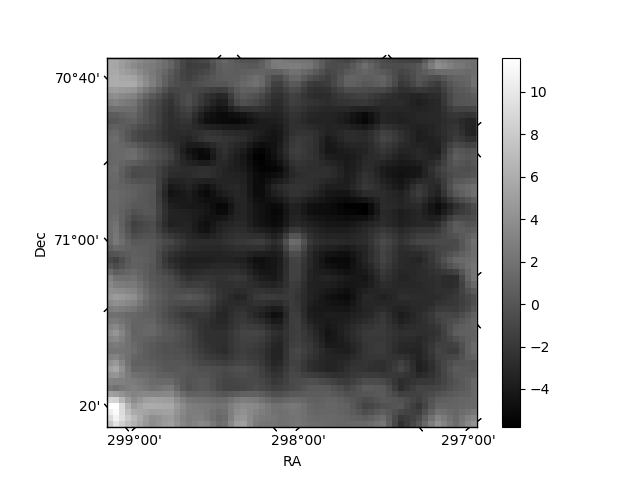
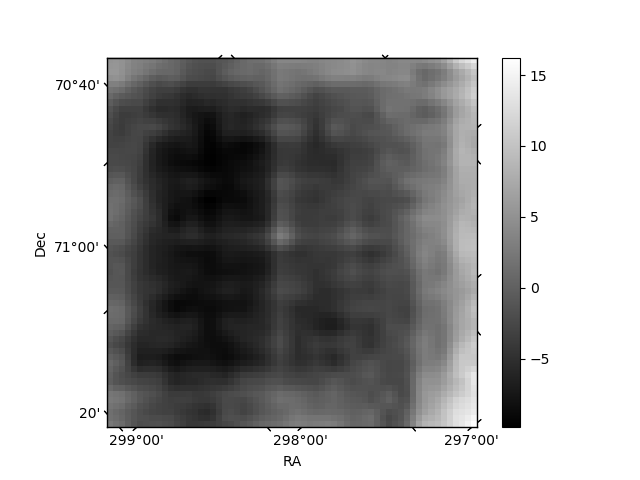
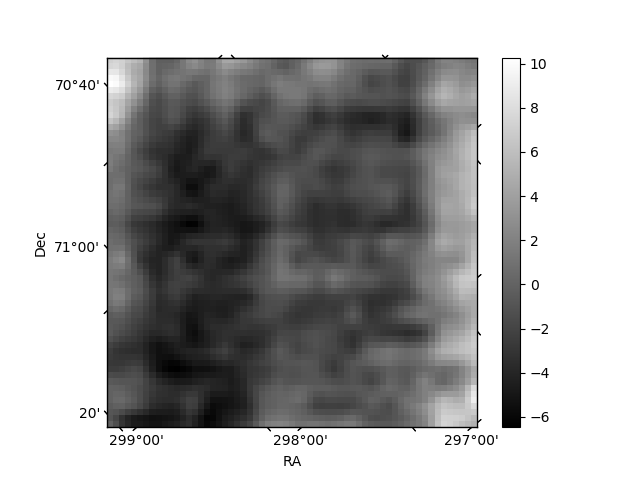
Histogram calculated using DETX and DETY for each event in the final _common_clean file
| Quadrant A | 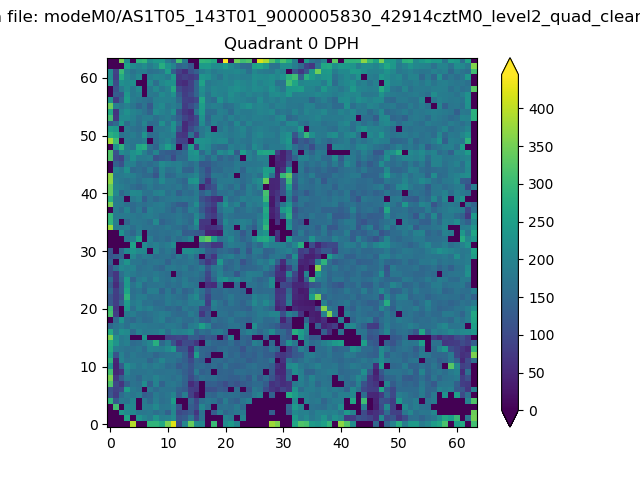 |
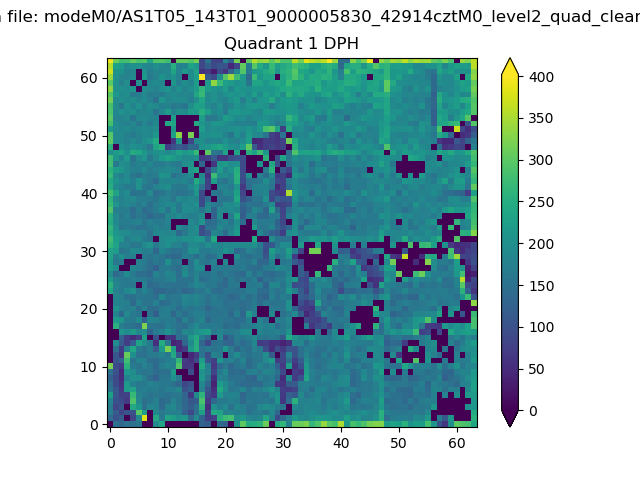 |
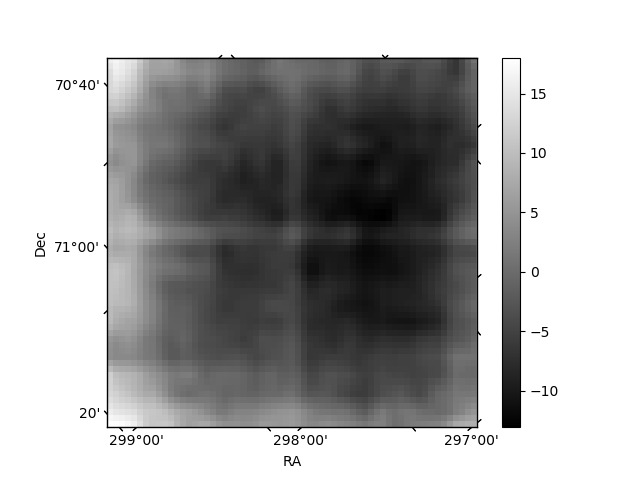
Quadrant B |
|---|---|---|---|
| Quadrant D | 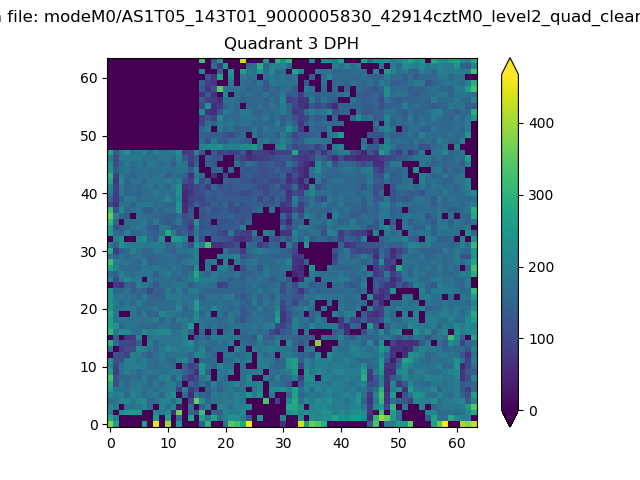 |
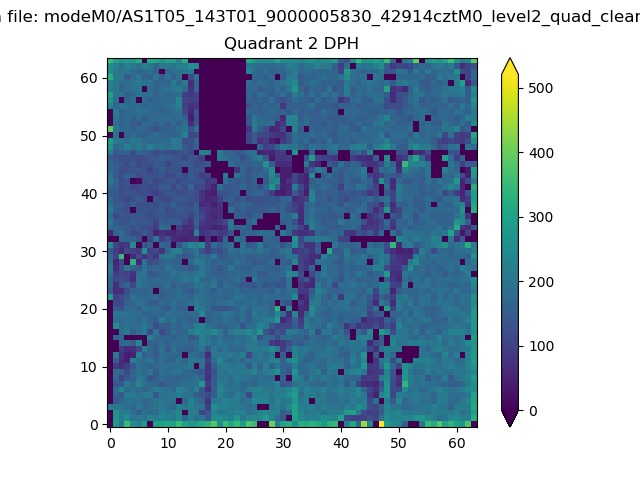 |
Quadrant C |
| Plot type | Count rate plots | Images |
|---|---|---|
| Comparison with Poisson distribution Blue bars denote a histogram of data divided into 1 sec bins. Red curve is a Poisson curve with rate = median count rate of data. |
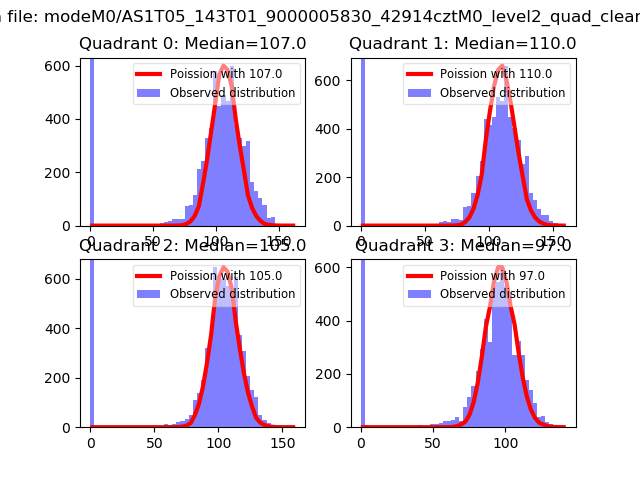 |
 |
| Quadrant-wise count rates Data is divided into 100 sec bins |
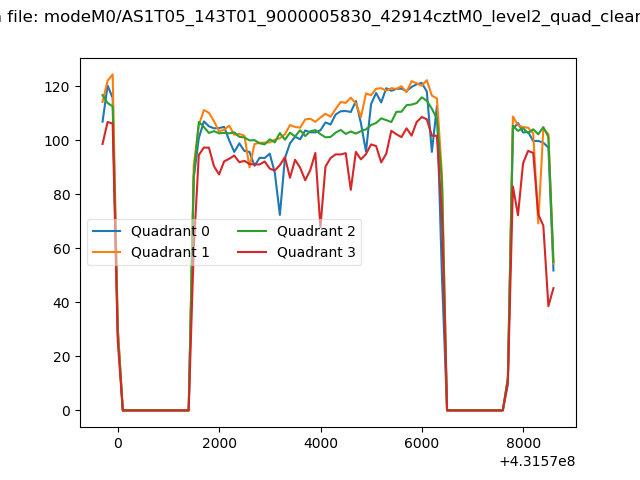 |
|
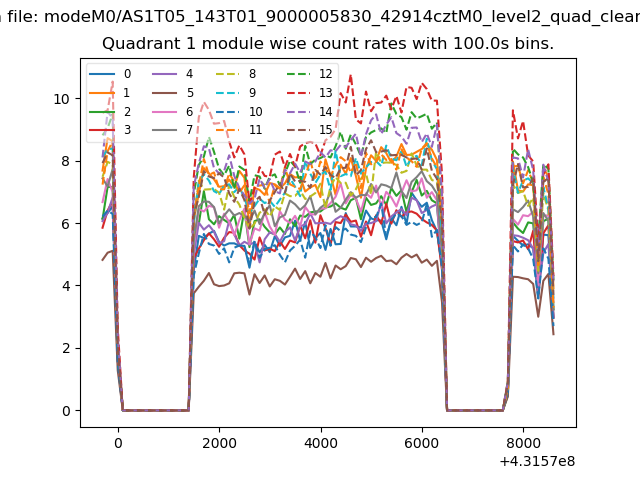
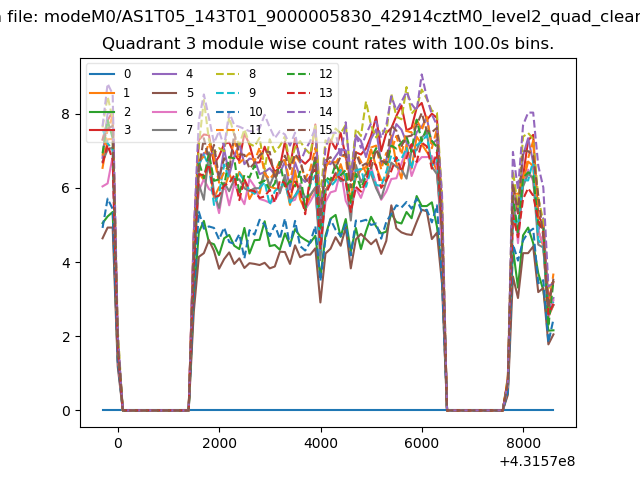
| Module-wise count rates for Quadrant A Data is divided into 100 sec bins |
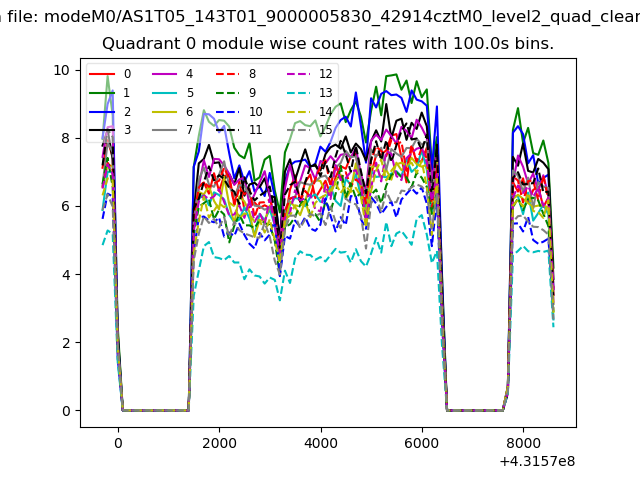 |
 |
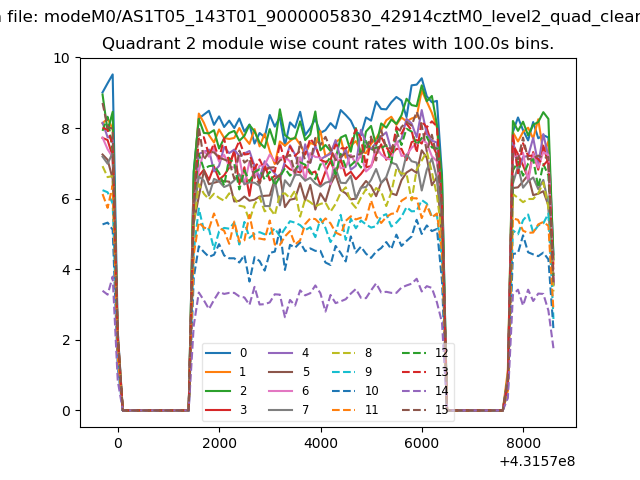
| Module-wise count rates for Quadrant B Data is divided into 100 sec bins |
 |
 |
| Module-wise count rates for Quadrant C Data is divided into 100 sec bins |
 |
 |
| Module-wise count rates for Quadrant D Data is divided into 100 sec bins |
 |
 |
| Parameter | Plot |
|---|---|
| CZT HV Monitor | 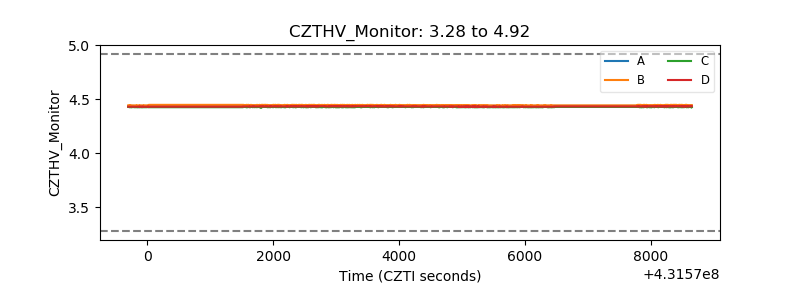 |
| D_VDD | 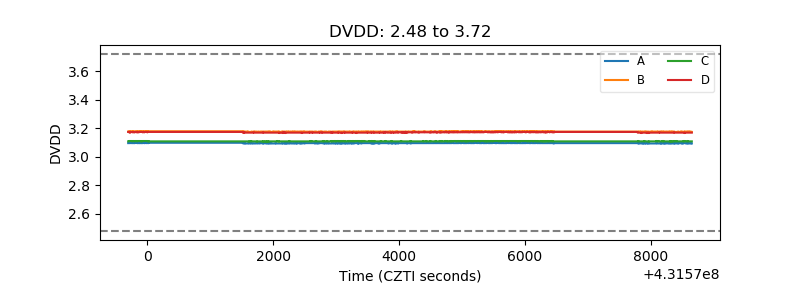 |
| Temperature 1 | 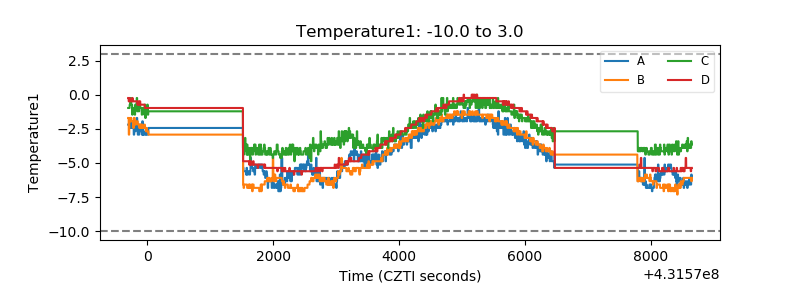 |
| Veto HV Monitor | 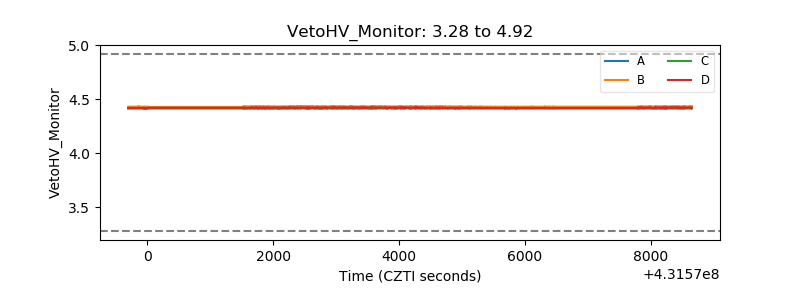 |
| Veto LLD | 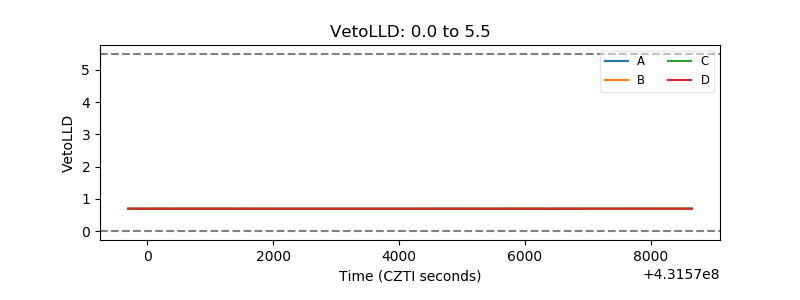 |
| Alpha Counter | 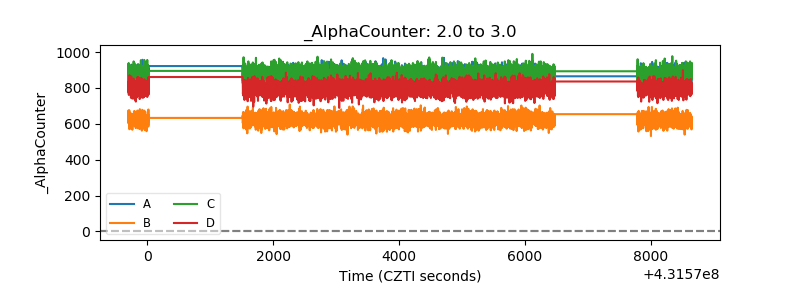 |
| _CPM_Rate | 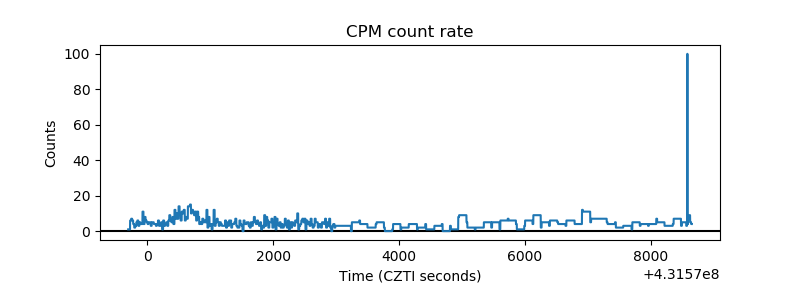 |
| CZT Counter | 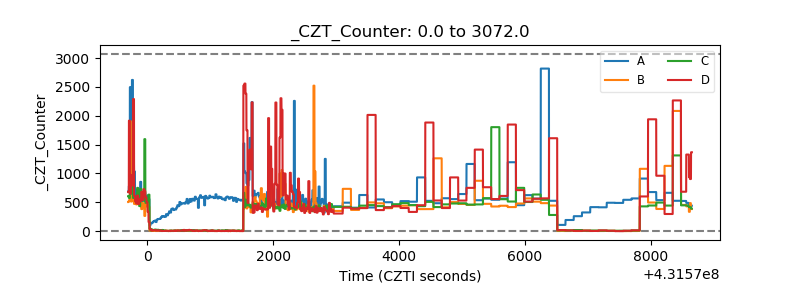 |
| +2.5 Volts monitor | 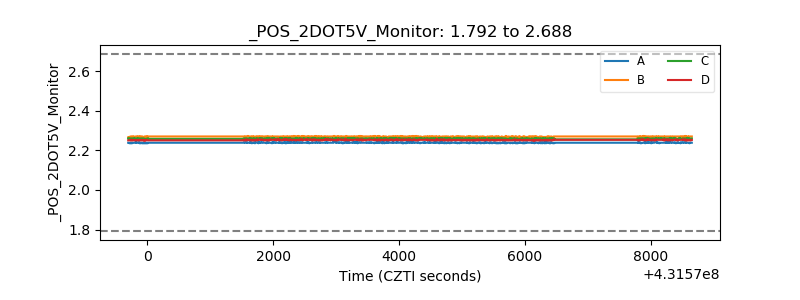 |
| +5 Volts monitor | 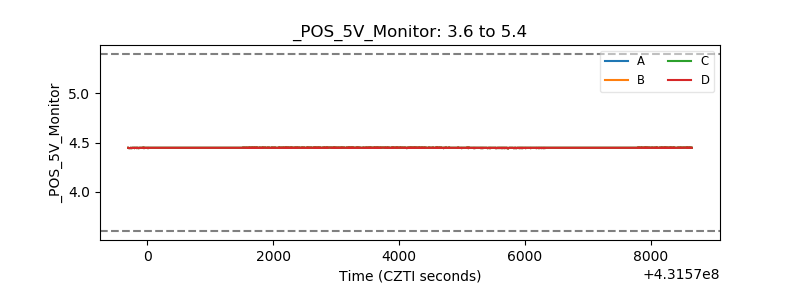 |
| _ROLL_ROT | 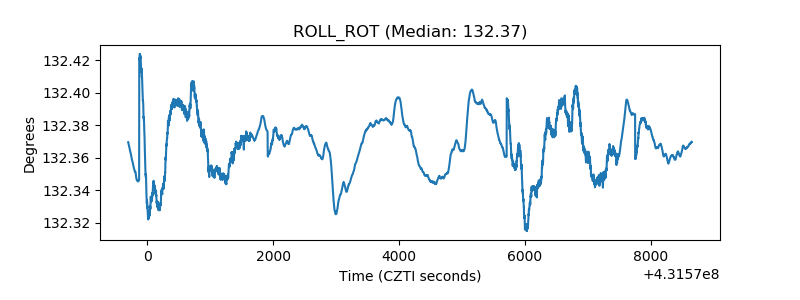 |
| _Roll_DEC | 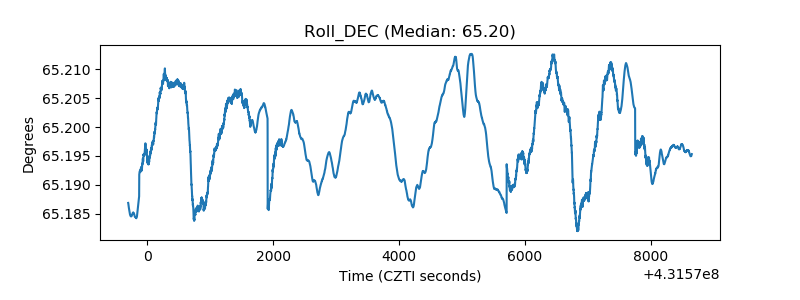 |
| _Roll_RA | 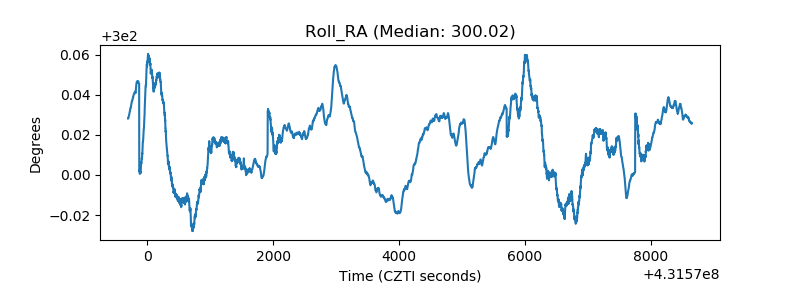 |
| Veto Counter | 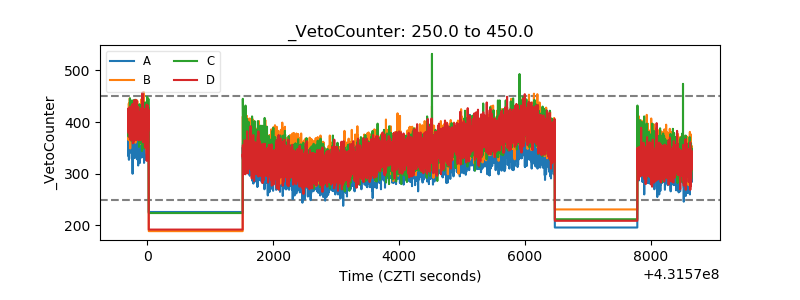 |