| Param | Original file | Final file |
|---|---|---|
| Filename | modeM0/AS1T05_143T01_9000005830_42917cztM0_level2.fits | modeM0/AS1T05_143T01_9000005830_42917cztM0_level2_quad_clean.evt |
| Size (bytes) | 999,239,040 | 228,983,040 |
| Size | 952.9 MB | 218.4 MB |
| Events in quadrant A | 9,088,573 | 1,524,904 |
| Events in quadrant B | 7,907,472 | 1,571,610 |
| Events in quadrant C | 7,749,281 | 1,510,199 |
| Events in quadrant D | 11,118,046 | 1,322,355 |
| Mode M0 | |||
|---|---|---|---|
| Quadrant | BADHDUFLAG | Total packets | Discarded packets |
| A | 0 | 35755 | 3 |
| B | 0 | 33716 | 3 |
| C | 0 | 32673 | 3 |
| D | 0 | 43306 | 3 |
| Mode M9 | |||
|---|---|---|---|
| Quadrant | BADHDUFLAG | Total packets | Discarded packets |
| A | 0 | 40 | 0 |
| B | 0 | 40 | 0 |
| C | 0 | 40 | 0 |
| D | 0 | 40 | 0 |
| Mode SS | |||
|---|---|---|---|
| Quadrant | BADHDUFLAG | Total packets | Discarded packets |
| A | 0 | 296 | 0 |
| B | 0 | 296 | 0 |
| C | 0 | 296 | 0 |
| D | 0 | 296 | 0 |
| Quadrant | Total seconds | Saturated seconds | Saturation percentage |
|---|---|---|---|
| A | 14538 | 365 | 2.510662% |
| B | 14538 | 320 | 2.201128% |
| C | 14539 | 72 | 0.495220% |
| D | 14539 | 964 | 6.630442% |
Noise dominated data is calculated using 1-second bins in cleaned event files. If a bin has >2000 counts, and if more than 50% of those come from <1% of pixels, then it is considered to be noise-dominated and hence unusable.
| Quadrant | # 1 sec bins | Bins with >0 counts | Bins with >2000 counts | High rate bins dominated by noise | Noise dominated (total time) | Noise dominated (detector-on time) | Marked lightcurve |
|---|---|---|---|---|---|---|---|
| A | 18535 | 14541 | 273 | 273 | 1.47% | 1.88% | 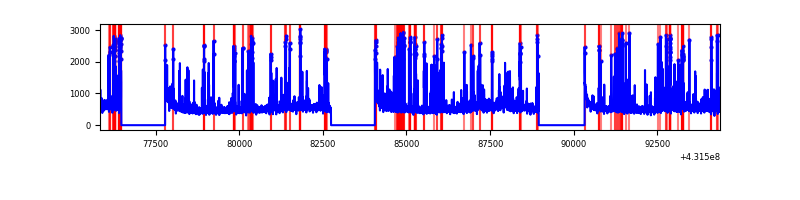 |
| B | 18535 | 14541 | 181 | 181 | 0.98% | 1.24% | 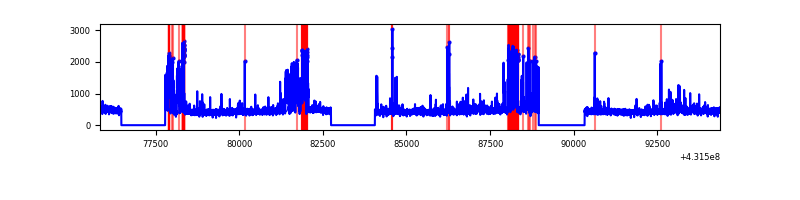 |
| C | 18536 | 14542 | 52 | 52 | 0.28% | 0.36% | 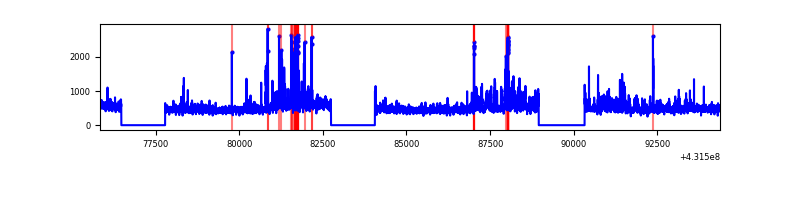 |
| D | 18536 | 14541 | 917 | 917 | 4.95% | 6.31% | 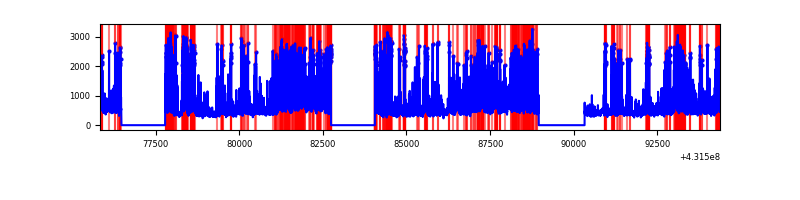 |
Top three noisy pixels from each quadrant. If the there are fewer than three noisy pixels in the level2.evt file, extra rows are filled as -1
| Pixel properties | Quadrant properties | ||||||
|---|---|---|---|---|---|---|---|
| Quadrant | DetID | PixID | Counts | Sigma | Mean | Median | Sigma |
| A | 15 | 237 | 1493473 | 4644.33 | 1570 | 1538 | 321.2 |
| A | 10 | 83 | 1382757 | 4299.68 | 1570 | 1538 | 321.2 |
| A | 2 | 79 | 106674 | 327.28 | 1570 | 1538 | 321.2 |
| B | 4 | 81 | 1118424 | 3667.54 | 1567 | 1520 | 304.5 |
| B | 0 | 229 | 439673 | 1438.75 | 1567 | 1520 | 304.5 |
| B | 3 | 112 | 129583 | 420.52 | 1567 | 1520 | 304.5 |
| C | 8 | 79 | 831257 | 2307.96 | 1540 | 1546 | 359.5 |
| C | 15 | 214 | 579095 | 1606.54 | 1540 | 1546 | 359.5 |
| C | 14 | 254 | 270977 | 749.46 | 1540 | 1546 | 359.5 |
| D | 1 | 47 | 1216710 | 3314.0 | 1504 | 1458 | 366.7 |
| D | 1 | 52 | 1022636 | 2784.76 | 1504 | 1458 | 366.7 |
| D | 2 | 249 | 786035 | 2139.54 | 1504 | 1458 | 366.7 |
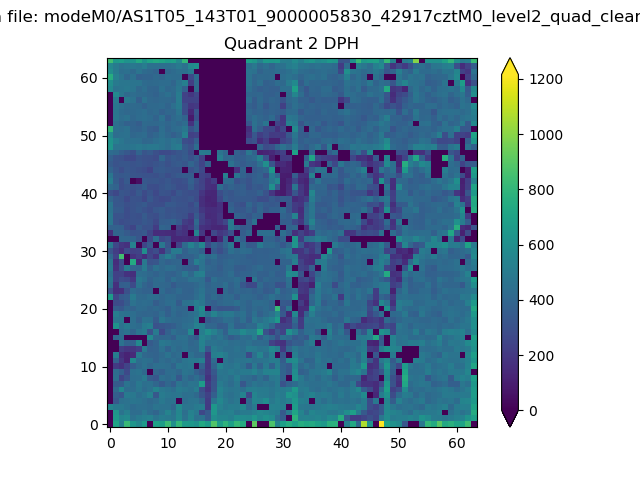
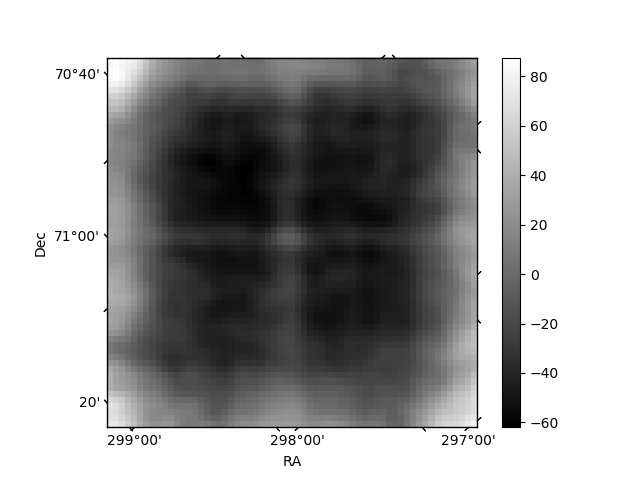
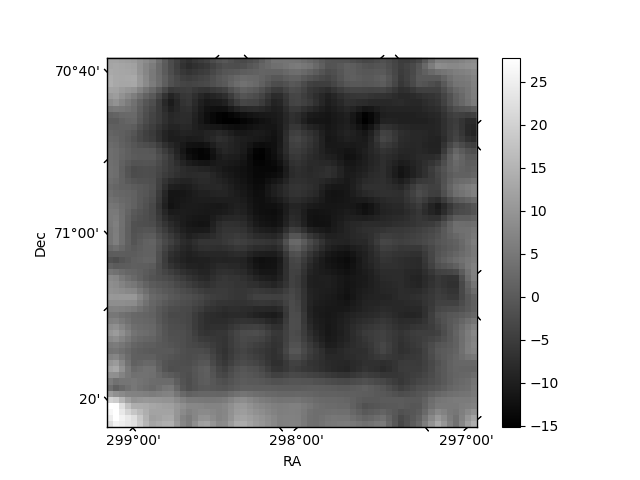
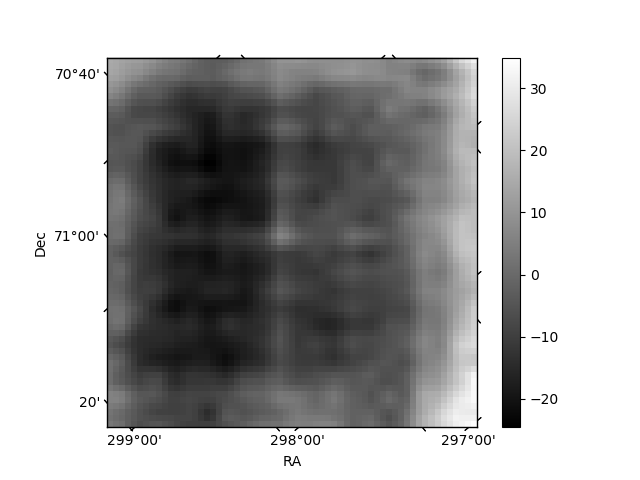
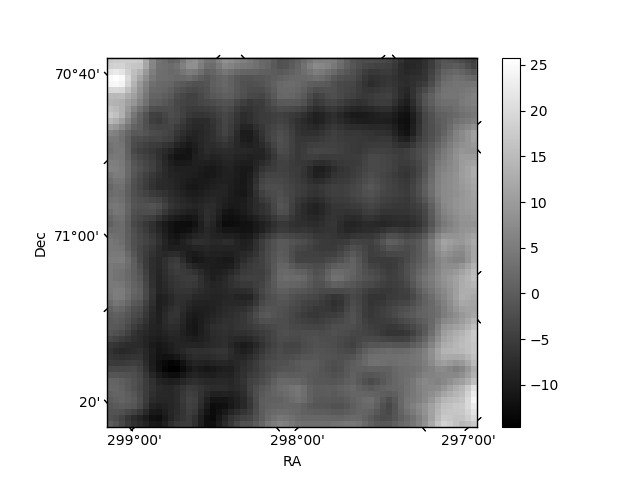
Histogram calculated using DETX and DETY for each event in the final _common_clean file
| Quadrant A | 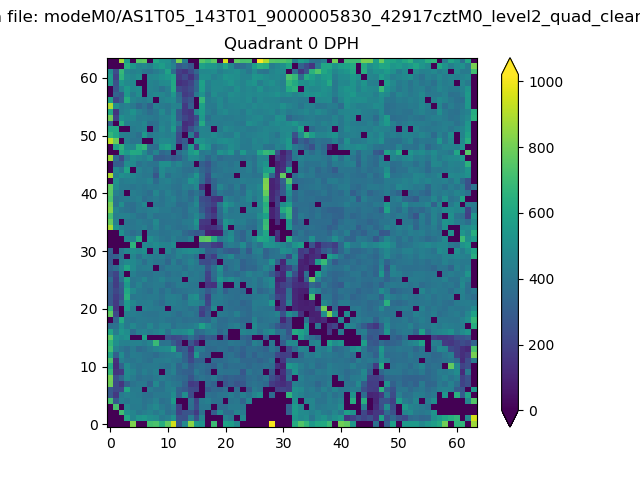 |
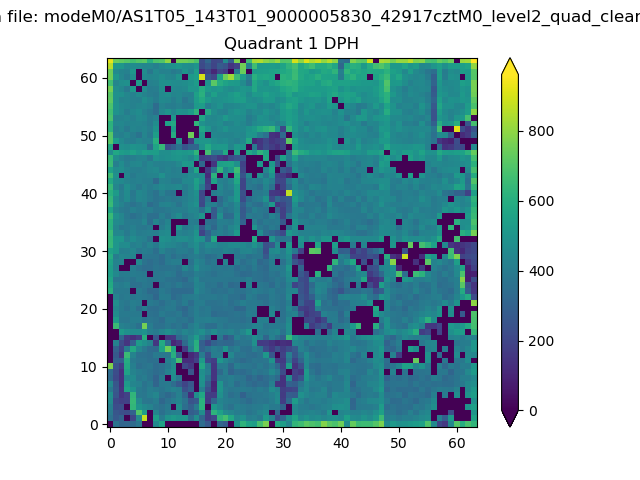 |
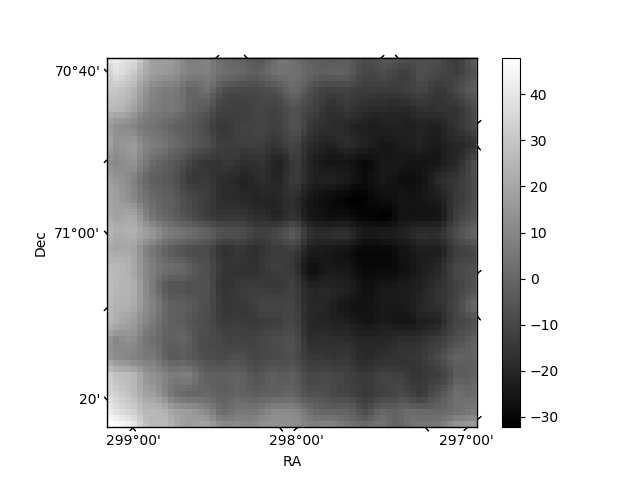
Quadrant B |
|---|---|---|---|
| Quadrant D | 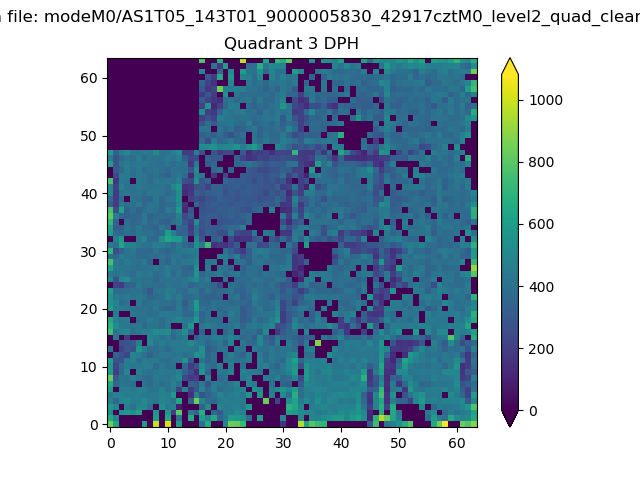 |
 |
Quadrant C |
| Plot type | Count rate plots | Images |
|---|---|---|
| Comparison with Poisson distribution Blue bars denote a histogram of data divided into 1 sec bins. Red curve is a Poisson curve with rate = median count rate of data. |
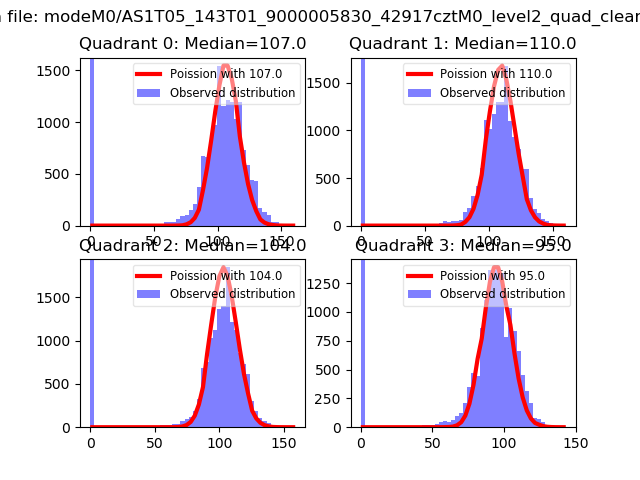 |
 |
| Quadrant-wise count rates Data is divided into 100 sec bins |
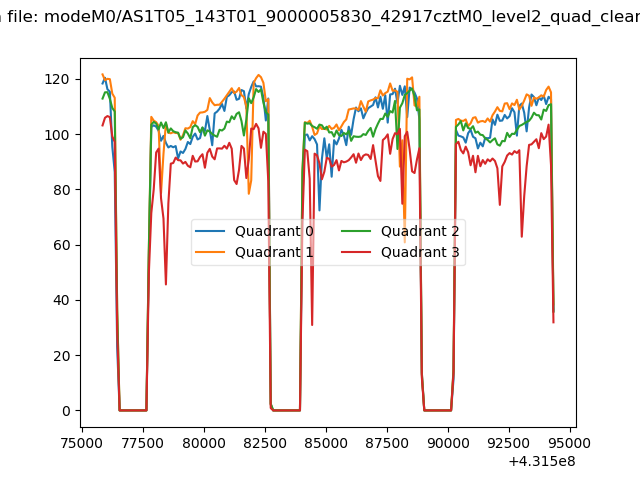 |
|
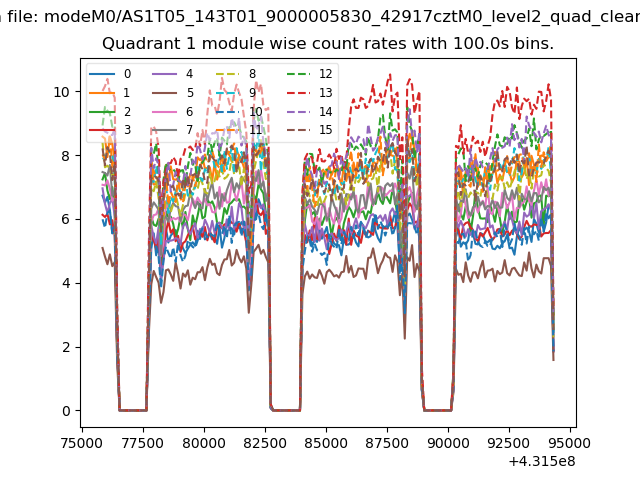
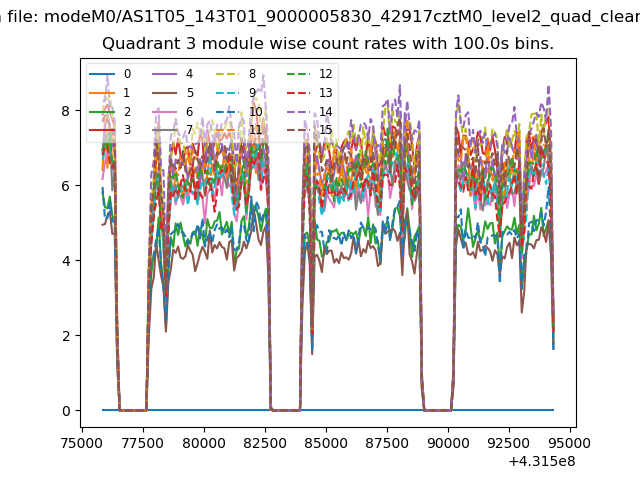
| Module-wise count rates for Quadrant A Data is divided into 100 sec bins |
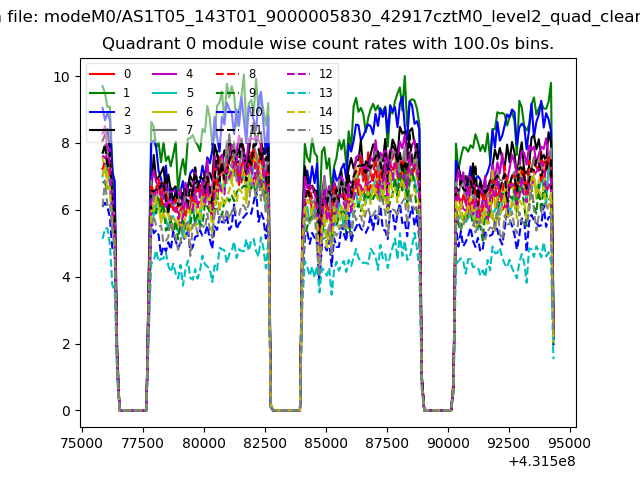 |
 |
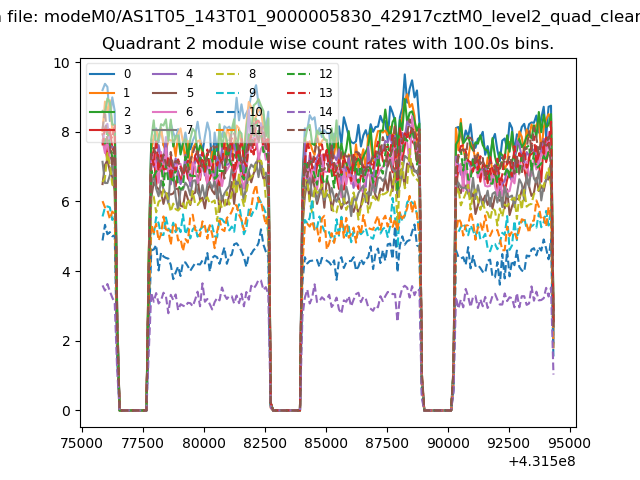
| Module-wise count rates for Quadrant B Data is divided into 100 sec bins |
 |
 |
| Module-wise count rates for Quadrant C Data is divided into 100 sec bins |
 |
 |
| Module-wise count rates for Quadrant D Data is divided into 100 sec bins |
 |
 |
| Parameter | Plot |
|---|---|
| CZT HV Monitor | 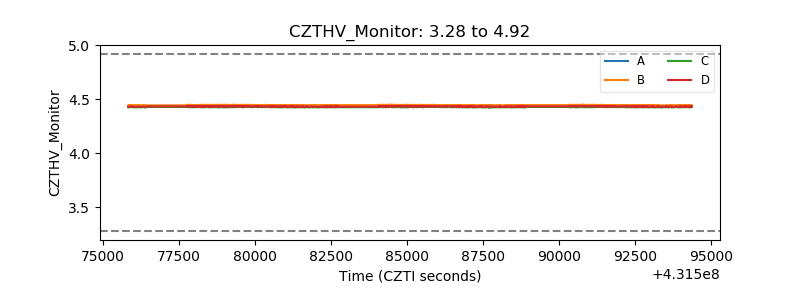 |
| D_VDD | 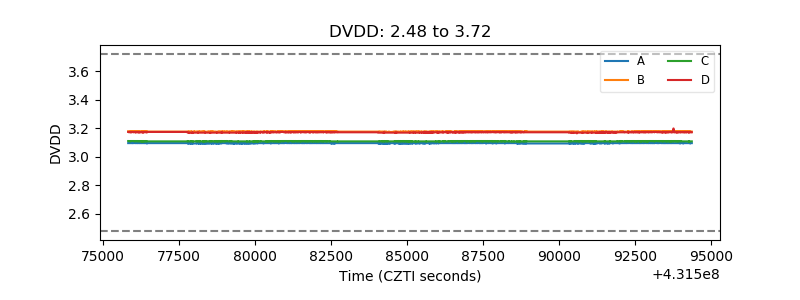 |
| Temperature 1 | 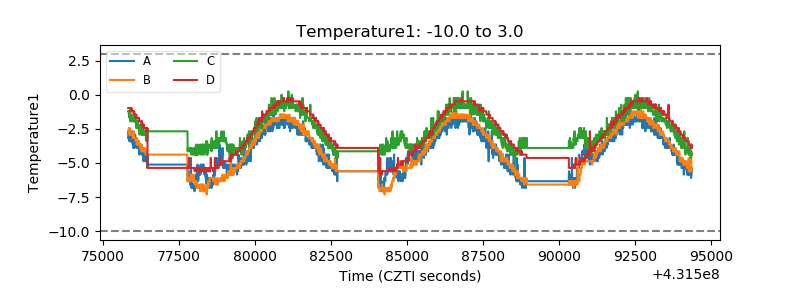 |
| Veto HV Monitor | 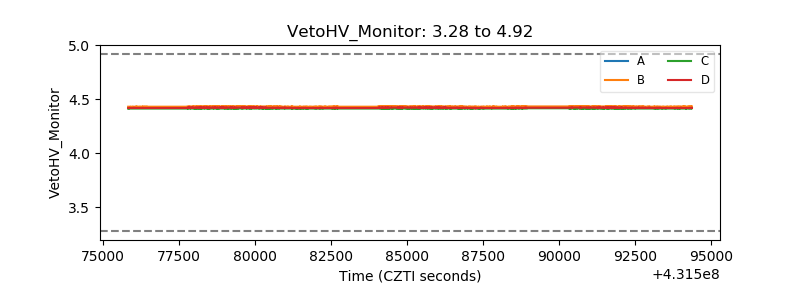 |
| Veto LLD | 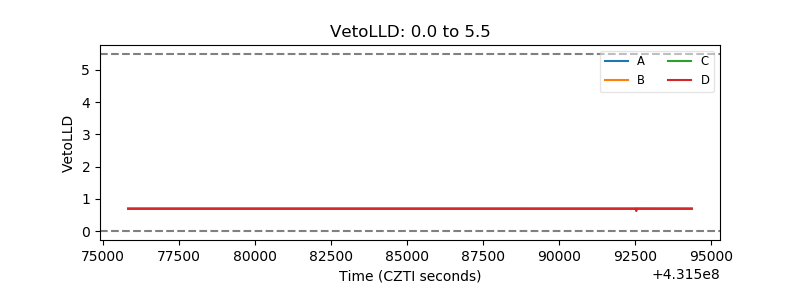 |
| Alpha Counter | 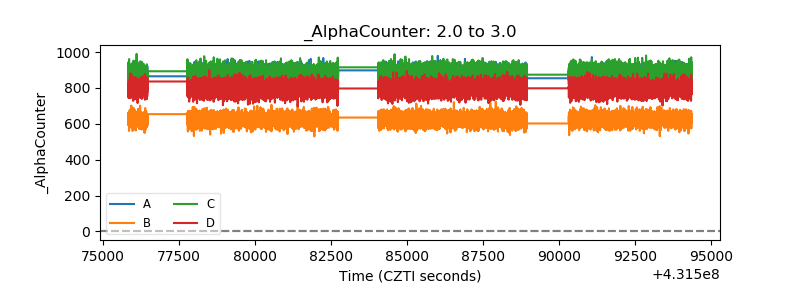 |
| _CPM_Rate | 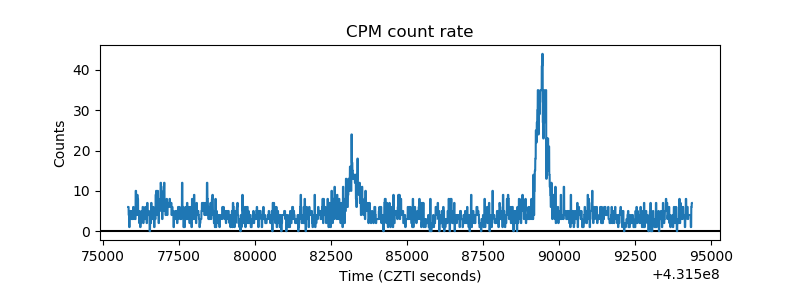 |
| CZT Counter | 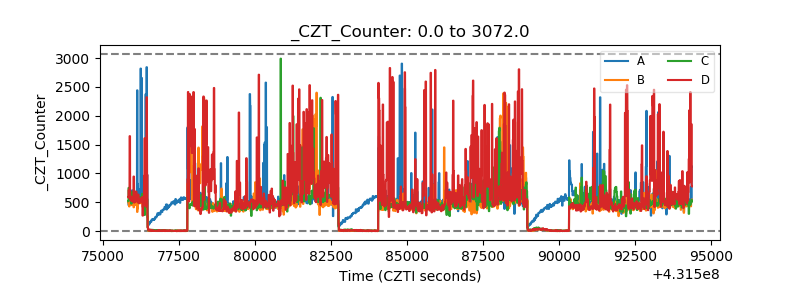 |
| +2.5 Volts monitor | 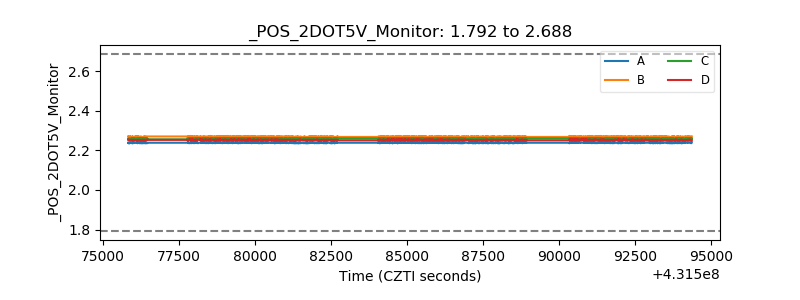 |
| +5 Volts monitor | 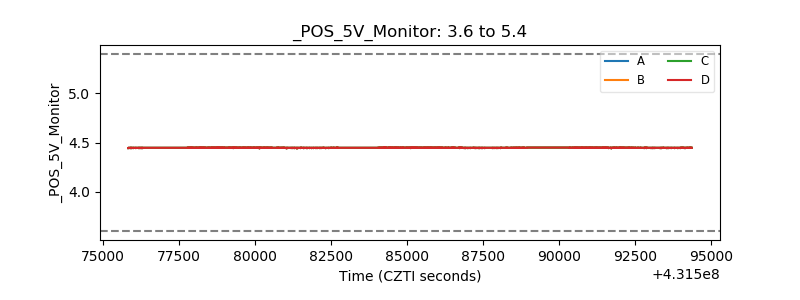 |
| _ROLL_ROT | 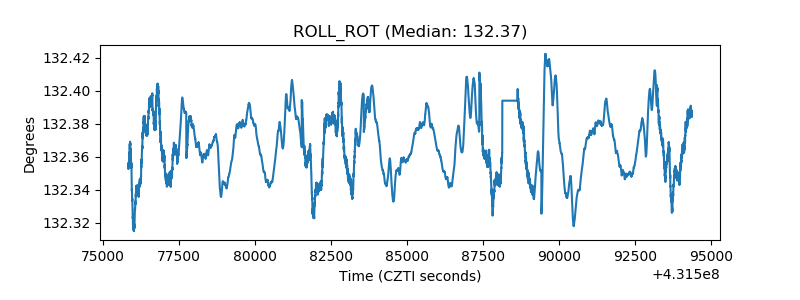 |
| _Roll_DEC | 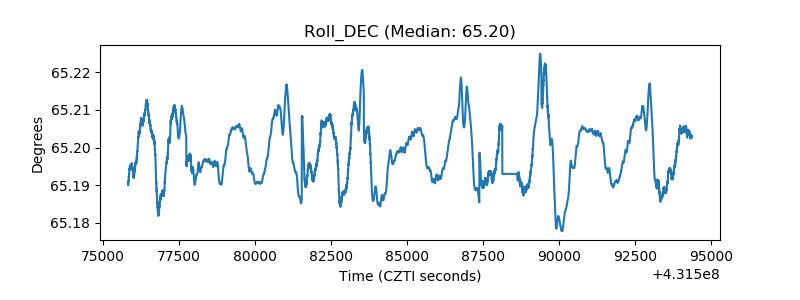 |
| _Roll_RA | 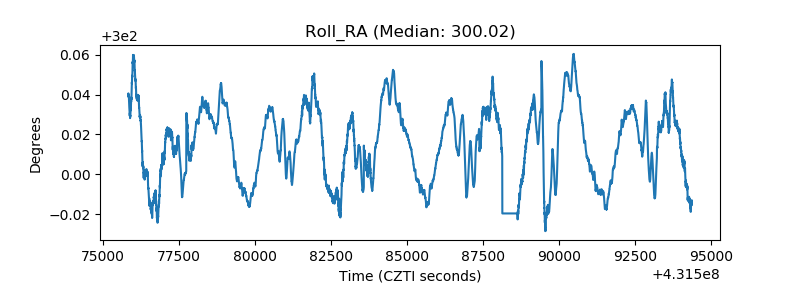 |
| Veto Counter | 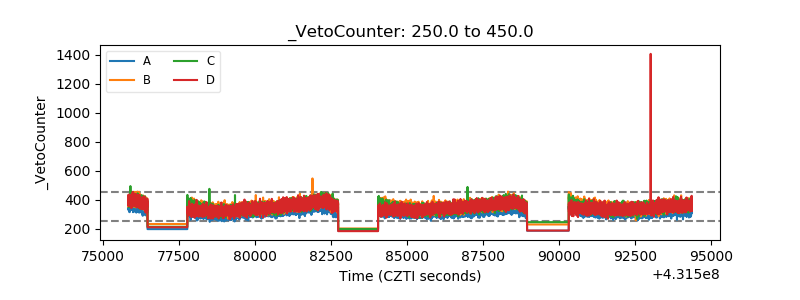 |