| Param | Original file | Final file |
|---|---|---|
| Filename | modeM0/AS1T05_143T01_9000005830_42919cztM0_level2.fits | modeM0/AS1T05_143T01_9000005830_42919cztM0_level2_quad_clean.evt |
| Size (bytes) | 391,573,440 | 91,362,240 |
| Size | 373.4 MB | 87.1 MB |
| Events in quadrant A | 3,594,467 | 620,984 |
| Events in quadrant B | 3,497,423 | 639,499 |
| Events in quadrant C | 2,738,699 | 592,428 |
| Events in quadrant D | 4,233,068 | 525,429 |
| Mode M0 | |||
|---|---|---|---|
| Quadrant | BADHDUFLAG | Total packets | Discarded packets |
| A | 0 | 14041 | 2 |
| B | 0 | 14191 | 2 |
| C | 0 | 11646 | 2 |
| D | 0 | 16366 | 2 |
| Mode M9 | |||
|---|---|---|---|
| Quadrant | BADHDUFLAG | Total packets | Discarded packets |
| A | 0 | 30 | 0 |
| B | 0 | 31 | 0 |
| C | 0 | 31 | 0 |
| D | 0 | 31 | 0 |
| Mode SS | |||
|---|---|---|---|
| Quadrant | BADHDUFLAG | Total packets | Discarded packets |
| A | 0 | 114 | 0 |
| B | 0 | 114 | 0 |
| C | 0 | 114 | 0 |
| D | 0 | 114 | 0 |
| Quadrant | Total seconds | Saturated seconds | Saturation percentage |
|---|---|---|---|
| A | 5542 | 134 | 2.417900% |
| B | 5542 | 56 | 1.010466% |
| C | 5542 | 27 | 0.487189% |
| D | 5542 | 398 | 7.181523% |
Noise dominated data is calculated using 1-second bins in cleaned event files. If a bin has >2000 counts, and if more than 50% of those come from <1% of pixels, then it is considered to be noise-dominated and hence unusable.
| Quadrant | # 1 sec bins | Bins with >0 counts | Bins with >2000 counts | High rate bins dominated by noise | Noise dominated (total time) | Noise dominated (detector-on time) | Marked lightcurve |
|---|---|---|---|---|---|---|---|
| A | 7275 | 5543 | 105 | 105 | 1.44% | 1.89% | 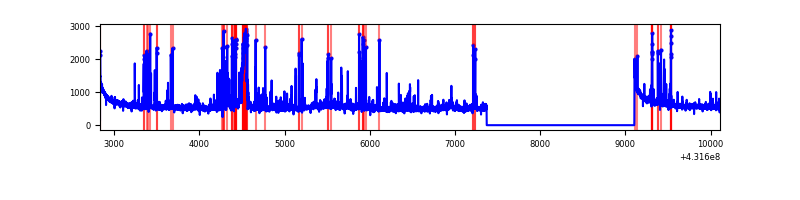 |
| B | 7275 | 5543 | 22 | 22 | 0.30% | 0.40% | 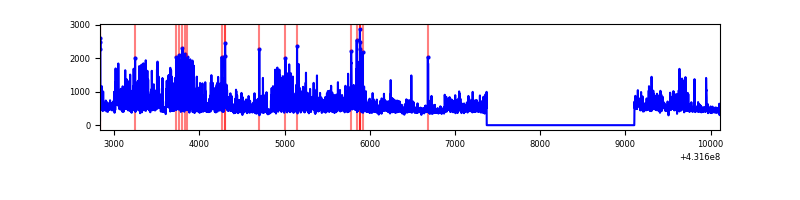 |
| C | 7275 | 5543 | 26 | 26 | 0.36% | 0.47% | 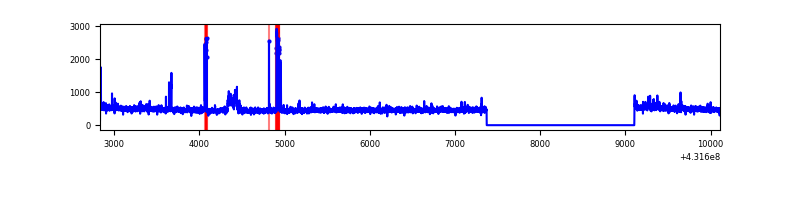 |
| D | 7274 | 5541 | 385 | 385 | 5.29% | 6.95% | 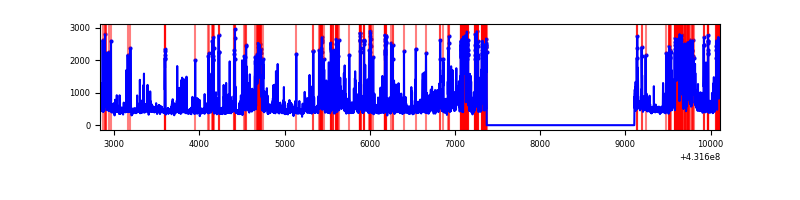 |
Top three noisy pixels from each quadrant. If the there are fewer than three noisy pixels in the level2.evt file, extra rows are filled as -1
| Pixel properties | Quadrant properties | ||||||
|---|---|---|---|---|---|---|---|
| Quadrant | DetID | PixID | Counts | Sigma | Mean | Median | Sigma |
| A | 10 | 83 | 602433 | 4791.2 | 610 | 596 | 125.6 |
| A | 15 | 237 | 473643 | 3765.91 | 610 | 596 | 125.6 |
| A | 15 | 222 | 88129 | 696.85 | 610 | 596 | 125.6 |
| B | 4 | 81 | 990526 | 8427.0 | 607 | 590 | 117.5 |
| B | 5 | 255 | 61421 | 517.83 | 607 | 590 | 117.5 |
| B | 3 | 112 | 17836 | 146.81 | 607 | 590 | 117.5 |
| C | 15 | 214 | 229323 | 1660.35 | 592 | 596 | 137.8 |
| C | 14 | 254 | 151976 | 1098.88 | 592 | 596 | 137.8 |
| C | 12 | 2 | 19882 | 140.0 | 592 | 596 | 137.8 |
| D | 1 | 47 | 494398 | 3474.04 | 582 | 566 | 142.1 |
| D | 13 | 249 | 357088 | 2508.08 | 582 | 566 | 142.1 |
| D | 12 | 233 | 310285 | 2178.83 | 582 | 566 | 142.1 |
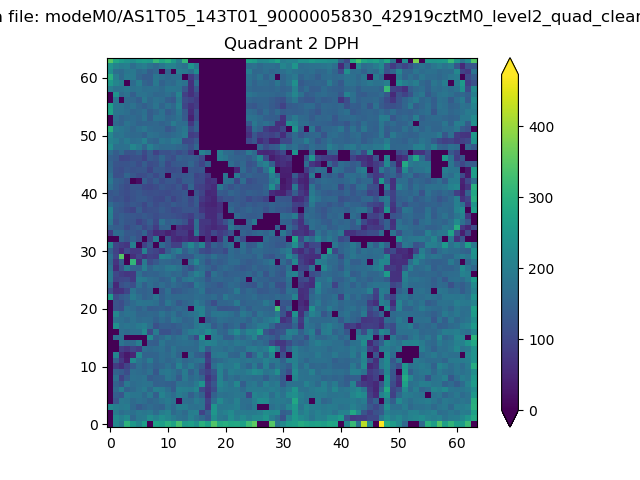
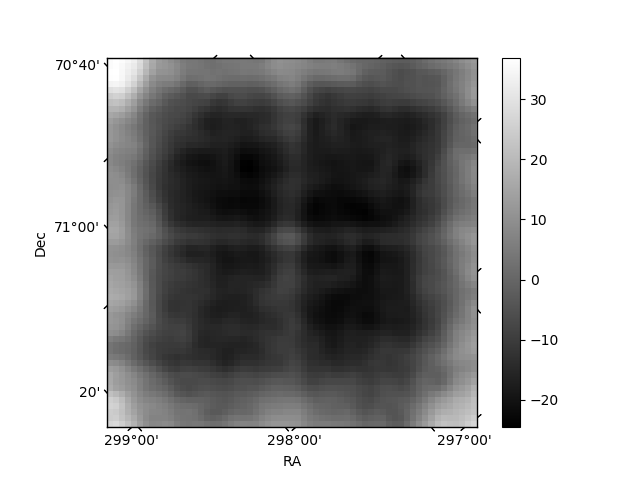
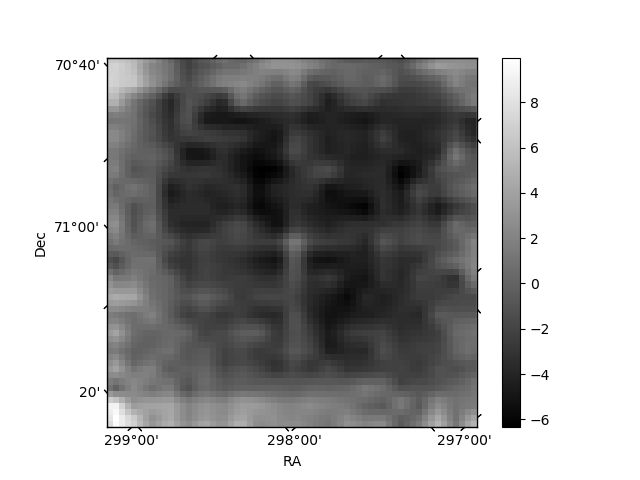
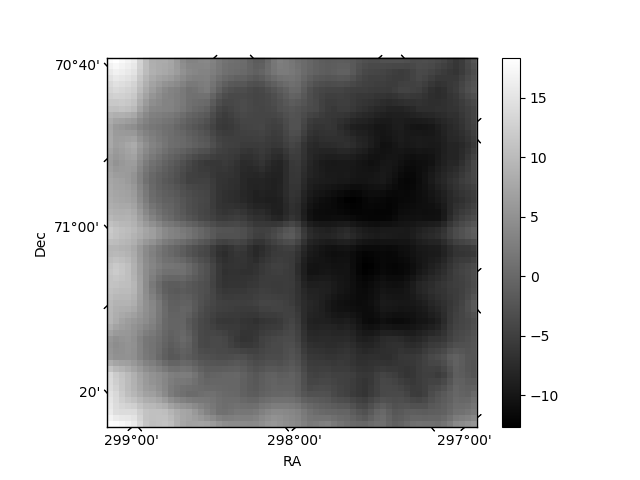
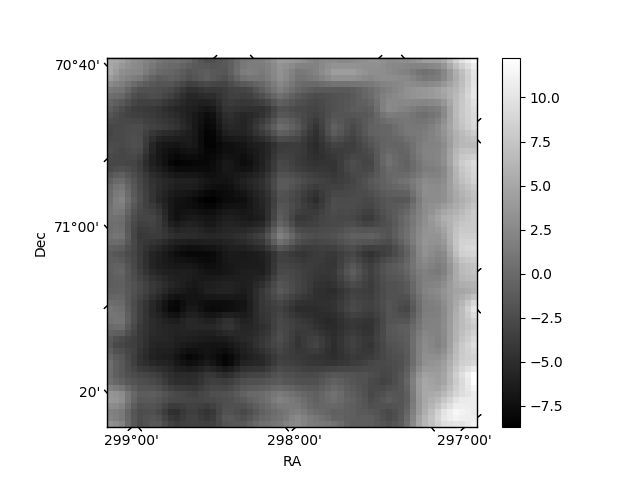
Histogram calculated using DETX and DETY for each event in the final _common_clean file
| Quadrant A | 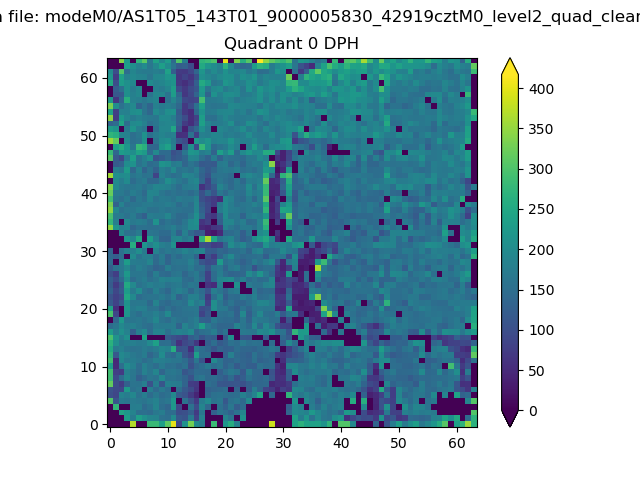 |
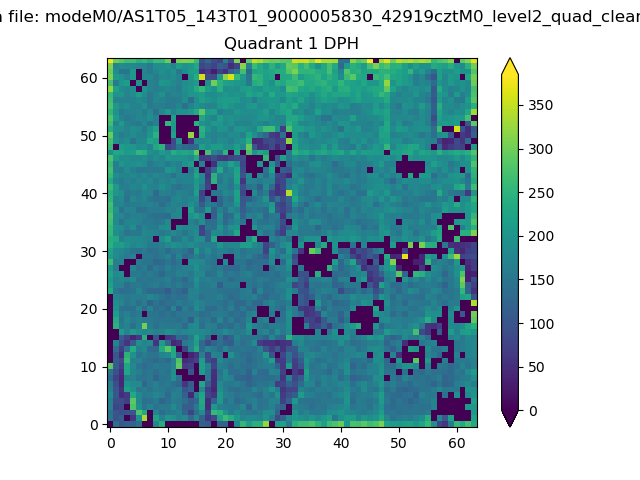 |
Quadrant B |
|---|---|---|---|
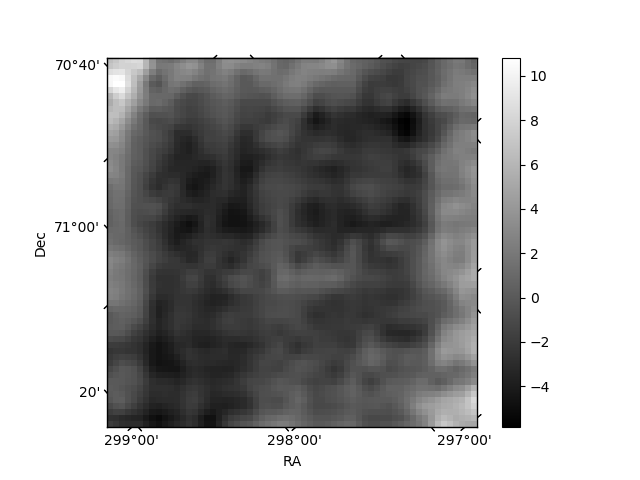
| Quadrant D | 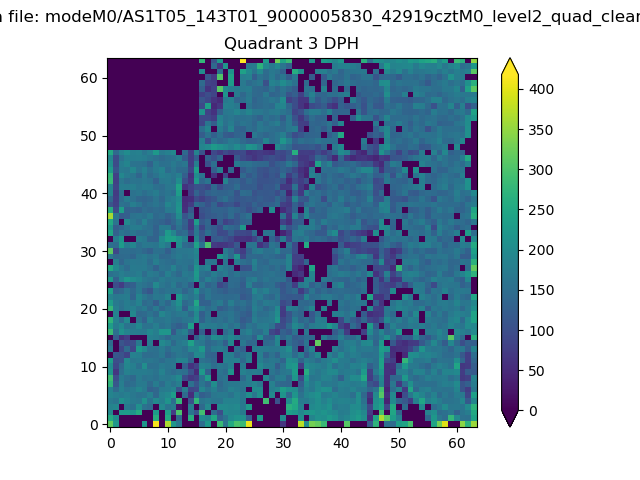 |
 |
Quadrant C |
| Plot type | Count rate plots | Images |
|---|---|---|
| Comparison with Poisson distribution Blue bars denote a histogram of data divided into 1 sec bins. Red curve is a Poisson curve with rate = median count rate of data. |
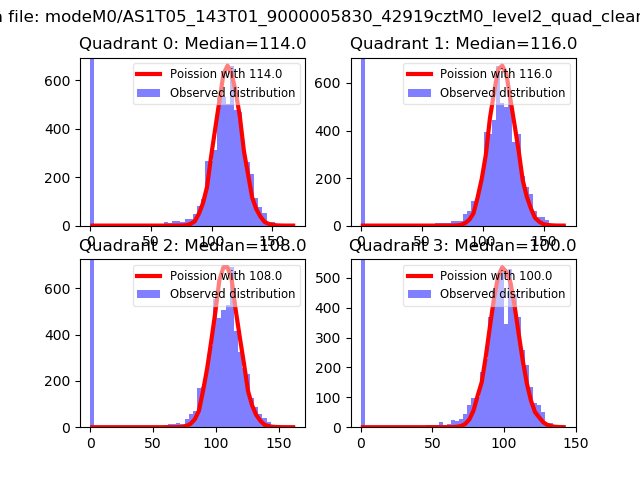 |
 |
| Quadrant-wise count rates Data is divided into 100 sec bins |
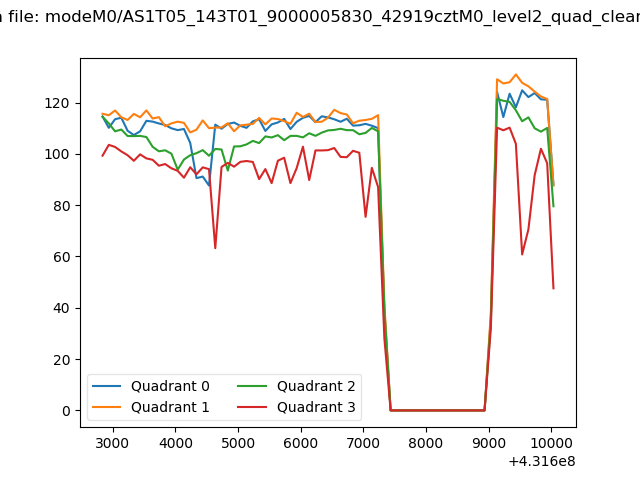 |
|
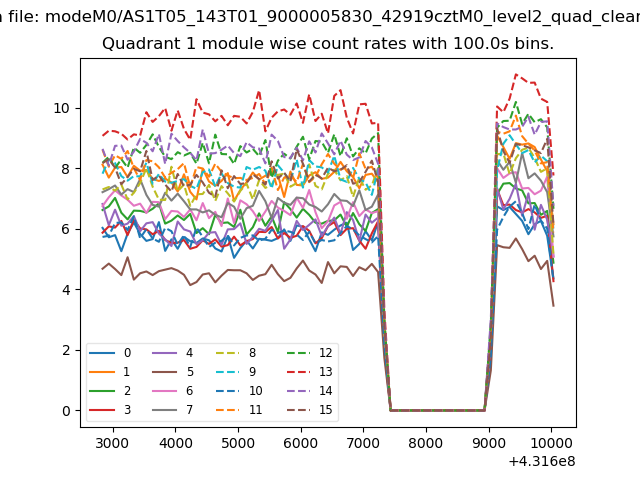
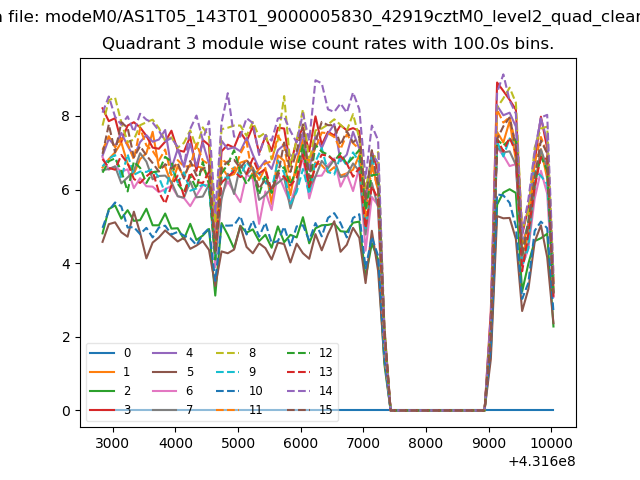
| Module-wise count rates for Quadrant A Data is divided into 100 sec bins |
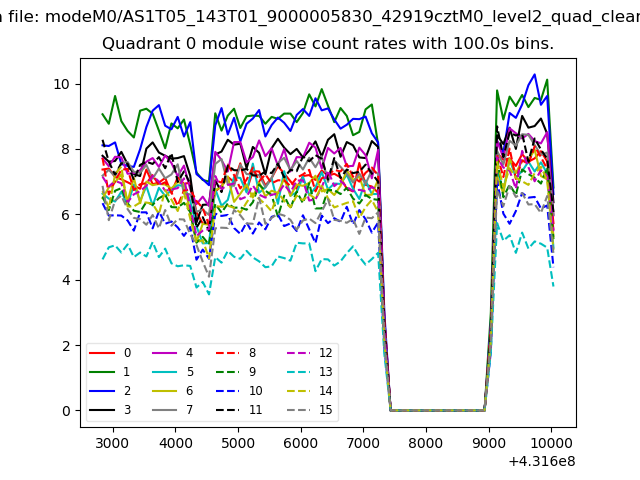 |
 |
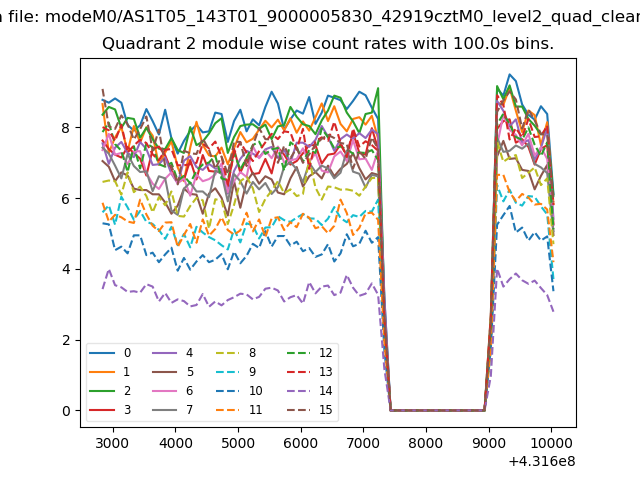
| Module-wise count rates for Quadrant B Data is divided into 100 sec bins |
 |
 |
| Module-wise count rates for Quadrant C Data is divided into 100 sec bins |
 |
 |
| Module-wise count rates for Quadrant D Data is divided into 100 sec bins |
 |
 |
| Parameter | Plot |
|---|---|
| CZT HV Monitor | 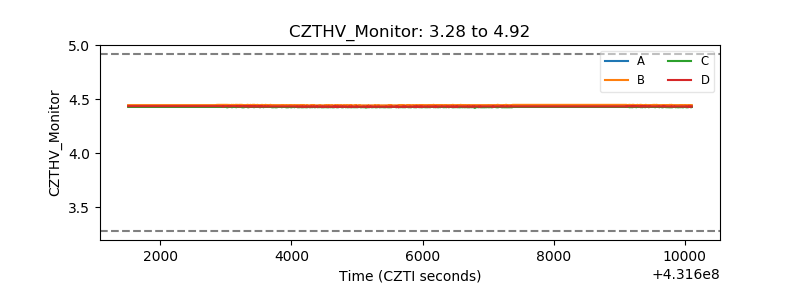 |
| D_VDD | 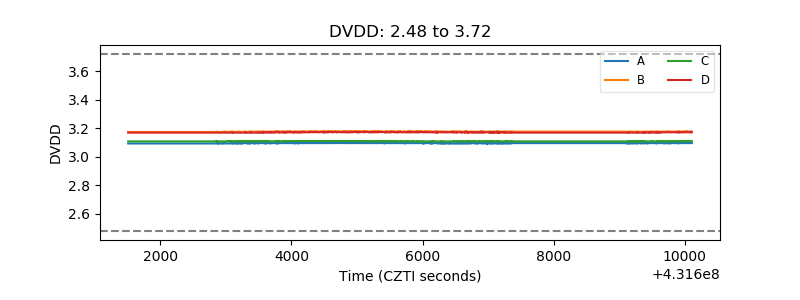 |
| Temperature 1 | 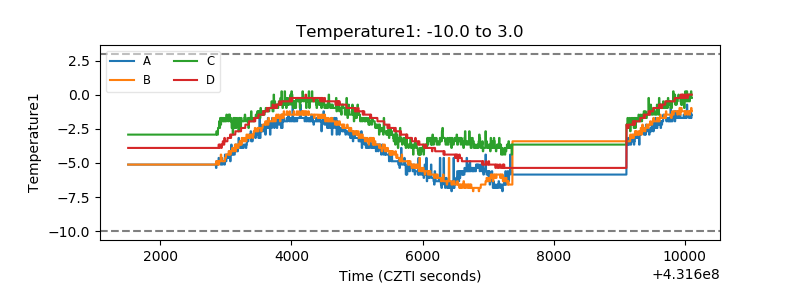 |
| Veto HV Monitor | 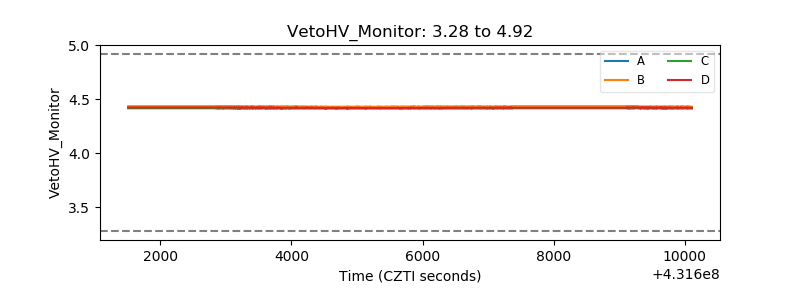 |
| Veto LLD | 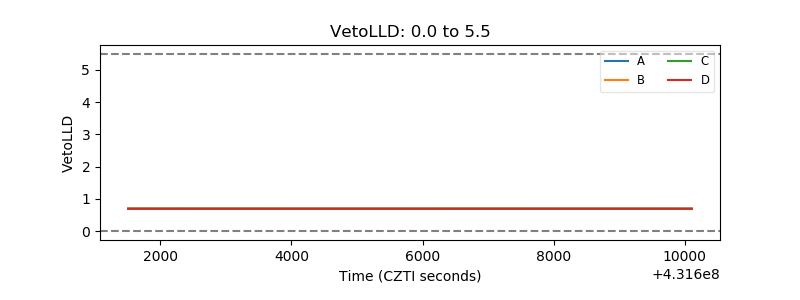 |
| Alpha Counter | 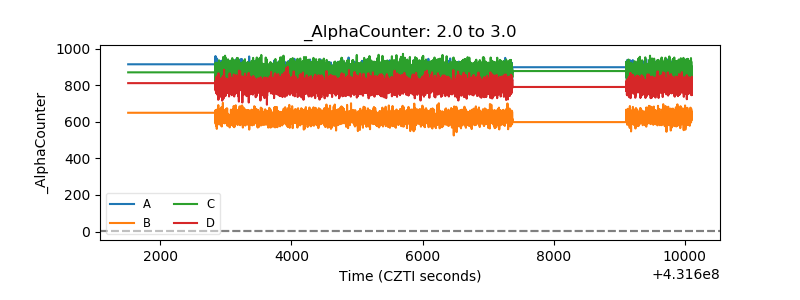 |
| _CPM_Rate | 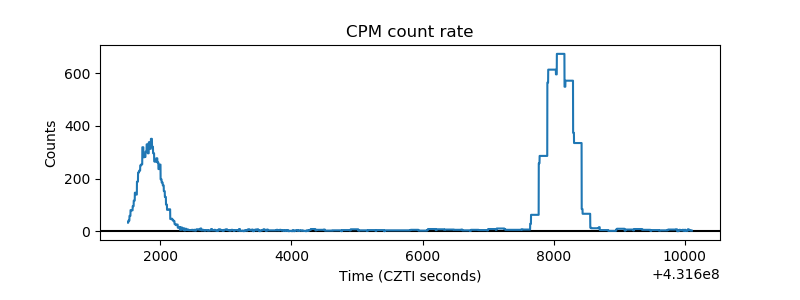 |
| CZT Counter | 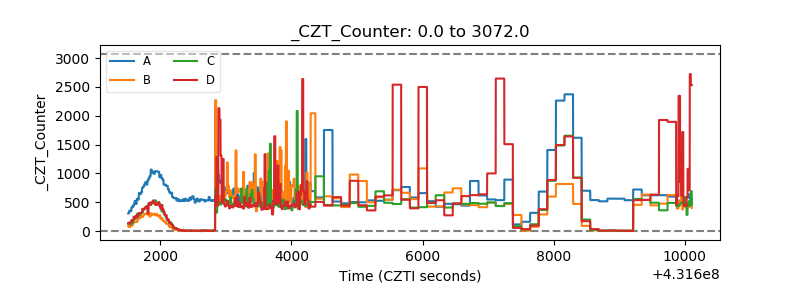 |
| +2.5 Volts monitor | 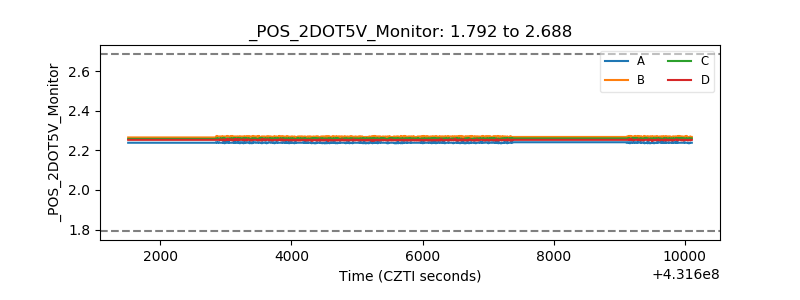 |
| +5 Volts monitor | 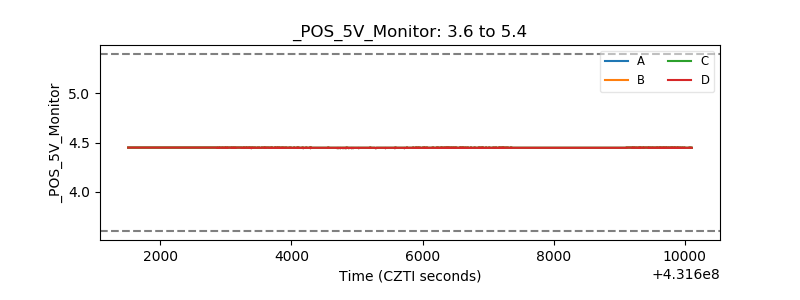 |
| _ROLL_ROT | 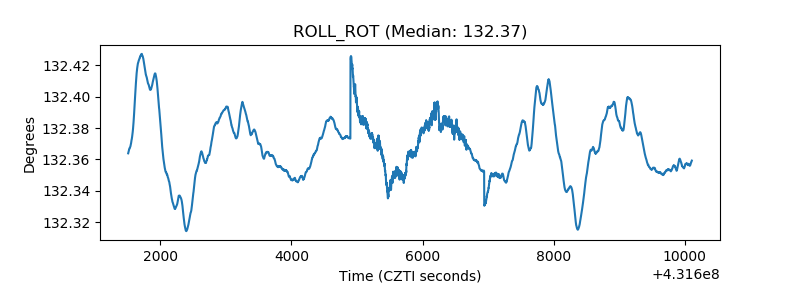 |
| _Roll_DEC | 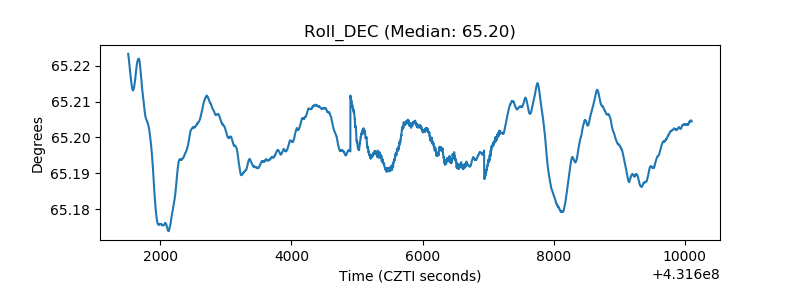 |
| _Roll_RA | 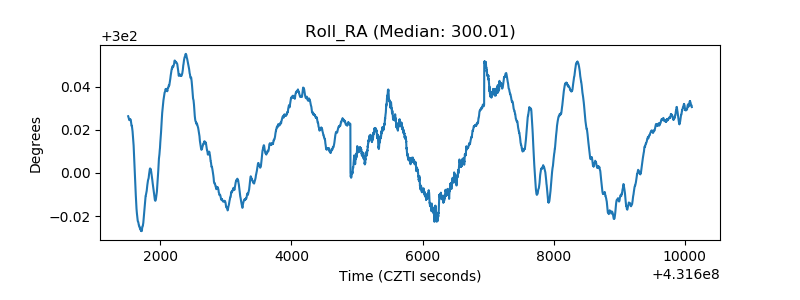 |
| Veto Counter | 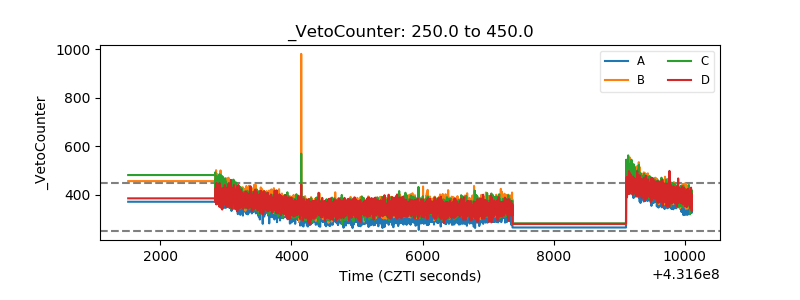 |