| Param | Original file | Final file |
|---|---|---|
| Filename | modeM0/AS1T05_143T01_9000005830_42921cztM0_level2.fits | modeM0/AS1T05_143T01_9000005830_42921cztM0_level2_quad_clean.evt |
| Size (bytes) | 382,700,160 | 85,449,600 |
| Size | 365.0 MB | 81.5 MB |
| Events in quadrant A | 3,269,992 | 602,481 |
| Events in quadrant B | 3,264,121 | 568,556 |
| Events in quadrant C | 2,546,204 | 573,157 |
| Events in quadrant D | 4,686,337 | 483,242 |
| Mode M0 | |||
|---|---|---|---|
| Quadrant | BADHDUFLAG | Total packets | Discarded packets |
| A | 0 | 12867 | 1 |
| B | 0 | 13247 | 1 |
| C | 0 | 10785 | 1 |
| D | 0 | 17412 | 1 |
| Mode M9 | |||
|---|---|---|---|
| Quadrant | BADHDUFLAG | Total packets | Discarded packets |
| A | 0 | 18 | 0 |
| B | 0 | 18 | 0 |
| C | 0 | 18 | 0 |
| D | 0 | 18 | 0 |
| Mode SS | |||
|---|---|---|---|
| Quadrant | BADHDUFLAG | Total packets | Discarded packets |
| A | 0 | 106 | 0 |
| B | 0 | 106 | 0 |
| C | 0 | 106 | 0 |
| D | 0 | 106 | 0 |
| Quadrant | Total seconds | Saturated seconds | Saturation percentage |
|---|---|---|---|
| A | 5131 | 119 | 2.319236% |
| B | 5132 | 408 | 7.950117% |
| C | 5132 | 18 | 0.350740% |
| D | 5132 | 616 | 12.003118% |
Noise dominated data is calculated using 1-second bins in cleaned event files. If a bin has >2000 counts, and if more than 50% of those come from <1% of pixels, then it is considered to be noise-dominated and hence unusable.
| Quadrant | # 1 sec bins | Bins with >0 counts | Bins with >2000 counts | High rate bins dominated by noise | Noise dominated (total time) | Noise dominated (detector-on time) | Marked lightcurve |
|---|---|---|---|---|---|---|---|
| A | 6984 | 5132 | 88 | 88 | 1.26% | 1.71% | 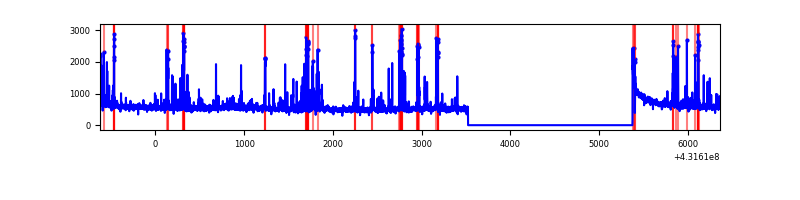 |
| B | 6985 | 5133 | 323 | 323 | 4.62% | 6.29% | 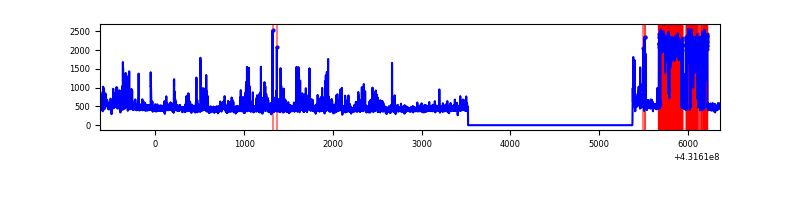 |
| C | 6985 | 5133 | 17 | 17 | 0.24% | 0.33% | 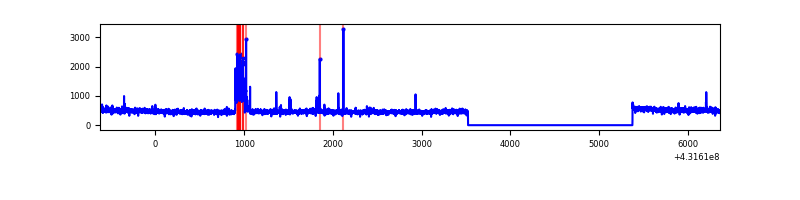 |
| D | 6985 | 5133 | 605 | 605 | 8.66% | 11.79% | 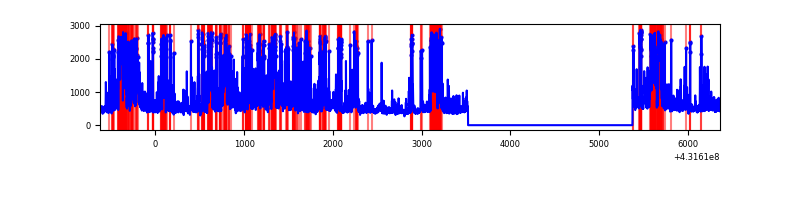 |
Top three noisy pixels from each quadrant. If the there are fewer than three noisy pixels in the level2.evt file, extra rows are filled as -1
| Pixel properties | Quadrant properties | ||||||
|---|---|---|---|---|---|---|---|
| Quadrant | DetID | PixID | Counts | Sigma | Mean | Median | Sigma |
| A | 10 | 83 | 510348 | 4338.57 | 570 | 558 | 117.5 |
| A | 15 | 237 | 415358 | 3530.16 | 570 | 558 | 117.5 |
| A | 15 | 222 | 68496 | 578.19 | 570 | 558 | 117.5 |
| B | 4 | 81 | 1073020 | 10314.66 | 543 | 530 | 104.0 |
| B | 4 | 36 | 26000 | 244.96 | 543 | 530 | 104.0 |
| B | 12 | 111 | 12665 | 116.71 | 543 | 530 | 104.0 |
| C | 15 | 214 | 205225 | 1598.63 | 555 | 559 | 128.0 |
| C | 14 | 254 | 149733 | 1165.19 | 555 | 559 | 128.0 |
| C | 3 | 233 | 12700 | 94.83 | 555 | 559 | 128.0 |
| D | 1 | 47 | 669792 | 5157.84 | 534 | 519 | 129.8 |
| D | 1 | 52 | 375121 | 2886.92 | 534 | 519 | 129.8 |
| D | 12 | 233 | 361881 | 2784.88 | 534 | 519 | 129.8 |
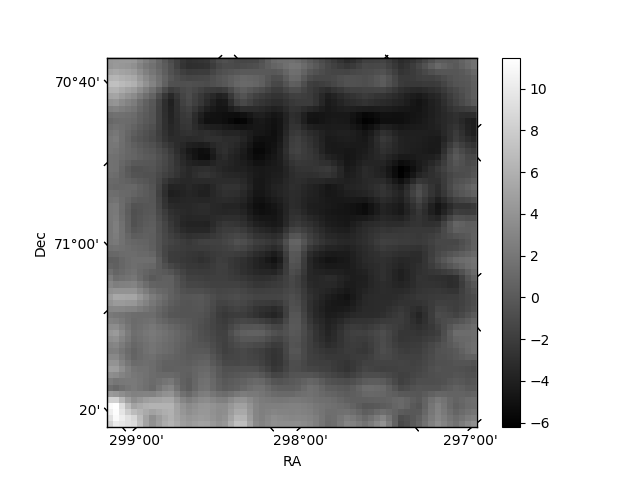
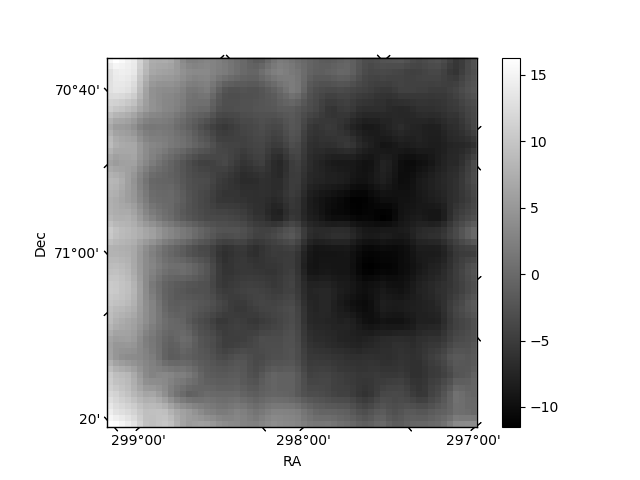
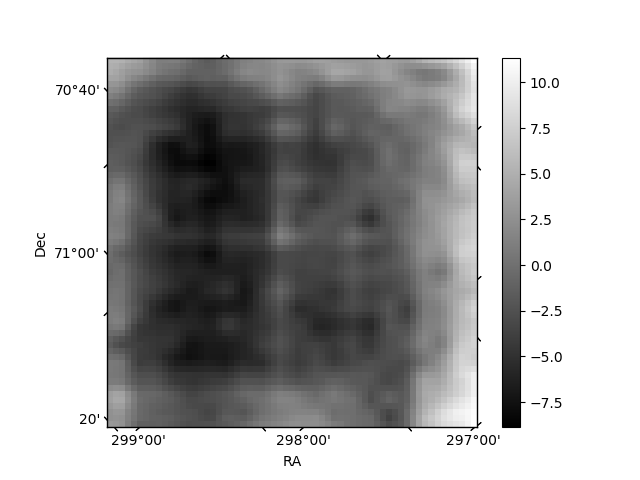
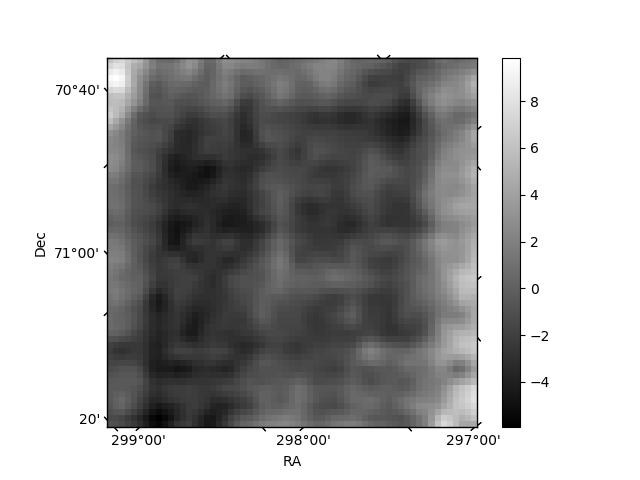
Histogram calculated using DETX and DETY for each event in the final _common_clean file
| Quadrant A | 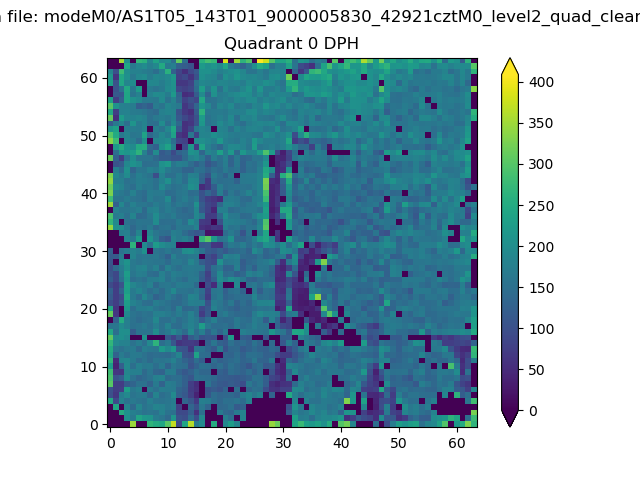 |
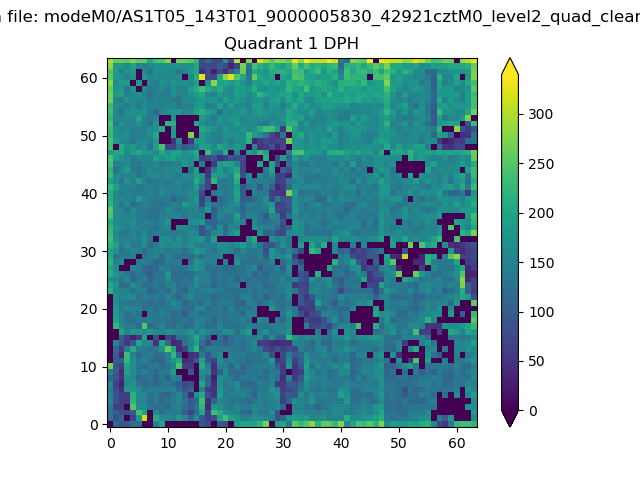 |
Quadrant B |
|---|---|---|---|
| Quadrant D | 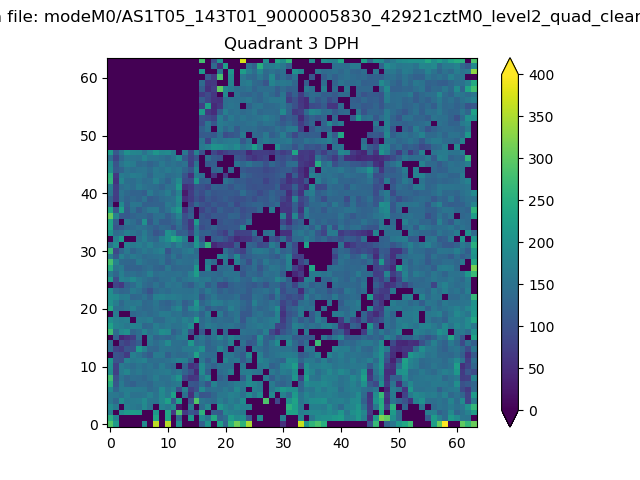 |
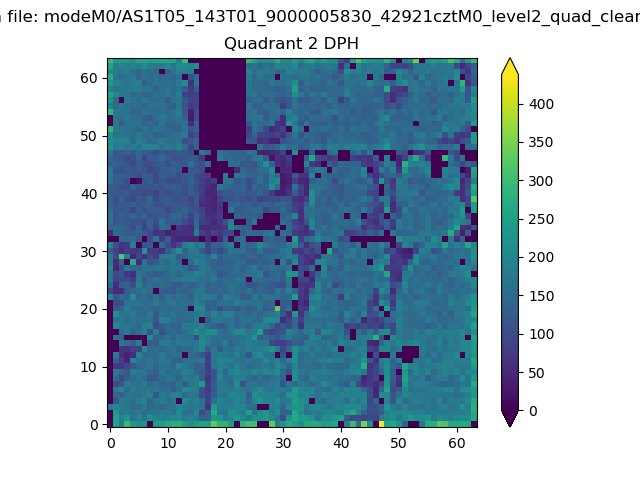 |
Quadrant C |
| Plot type | Count rate plots | Images |
|---|---|---|
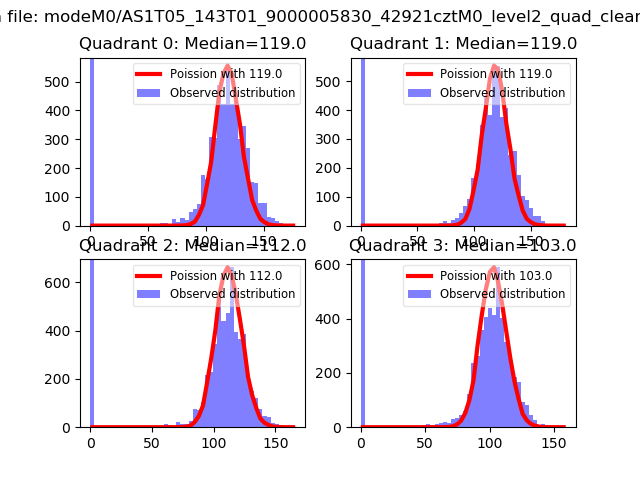
| Comparison with Poisson distribution Blue bars denote a histogram of data divided into 1 sec bins. Red curve is a Poisson curve with rate = median count rate of data. |
 |
 |
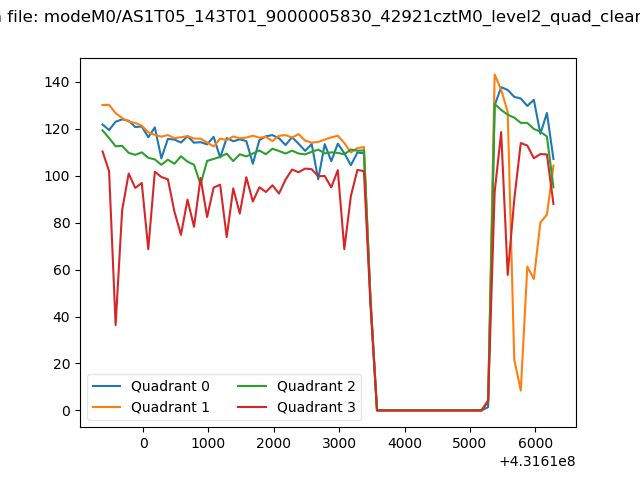
| Quadrant-wise count rates Data is divided into 100 sec bins |
 |
|
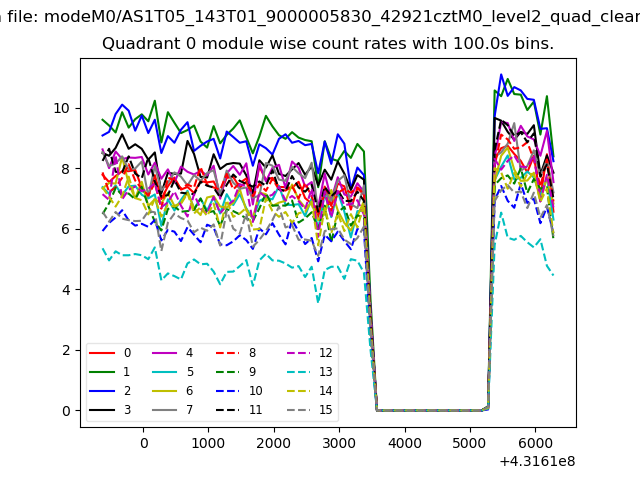
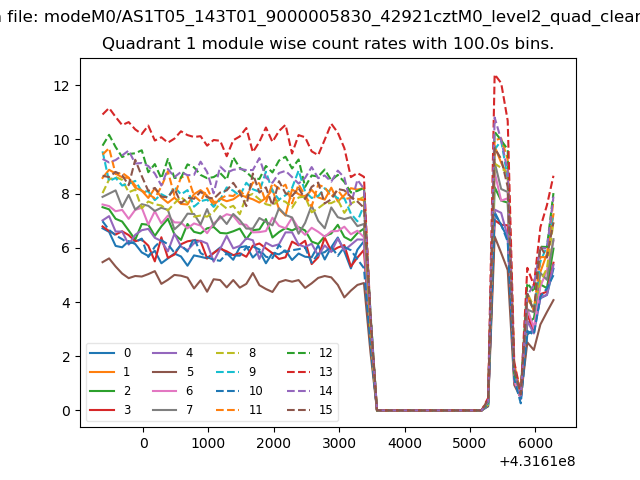
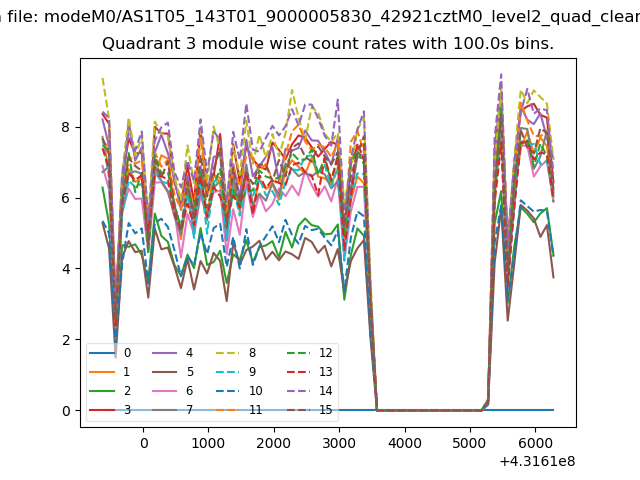
| Module-wise count rates for Quadrant A Data is divided into 100 sec bins |
 |
 |
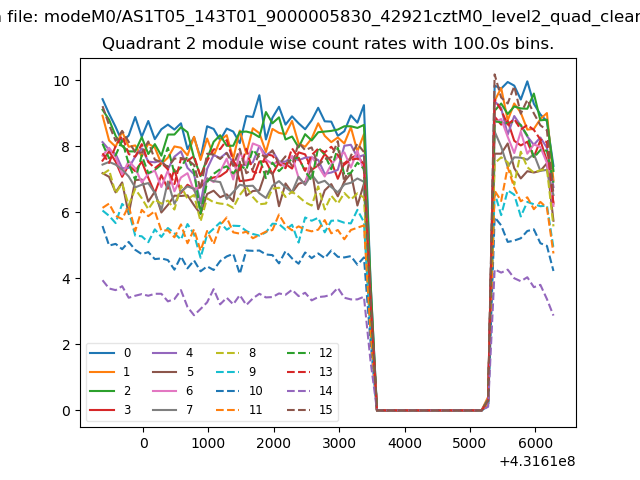
| Module-wise count rates for Quadrant B Data is divided into 100 sec bins |
 |
 |
| Module-wise count rates for Quadrant C Data is divided into 100 sec bins |
 |
 |
| Module-wise count rates for Quadrant D Data is divided into 100 sec bins |
 |
 |
| Parameter | Plot |
|---|---|
| CZT HV Monitor | 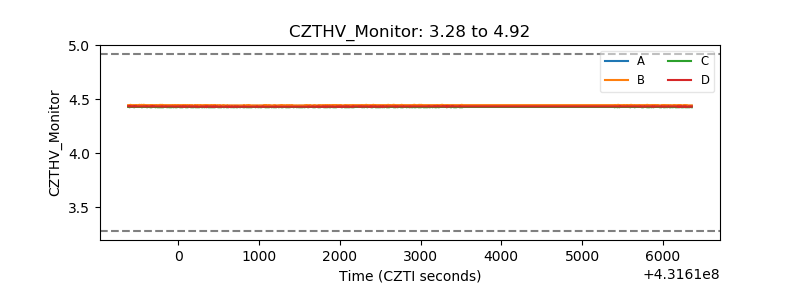 |
| D_VDD | 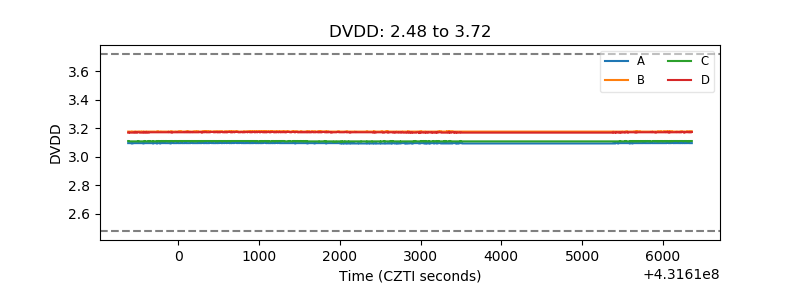 |
| Temperature 1 | 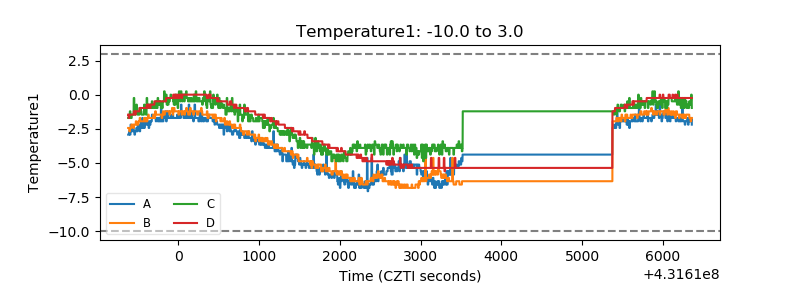 |
| Veto HV Monitor | 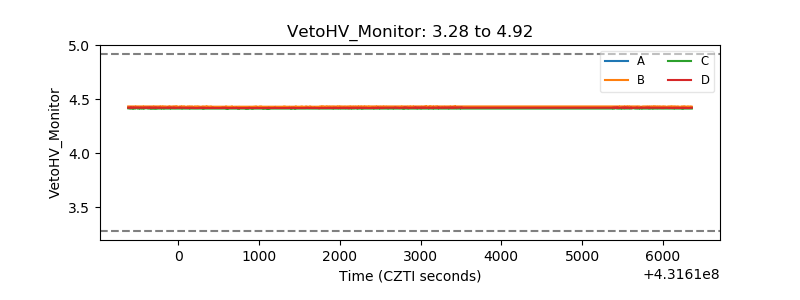 |
| Veto LLD | 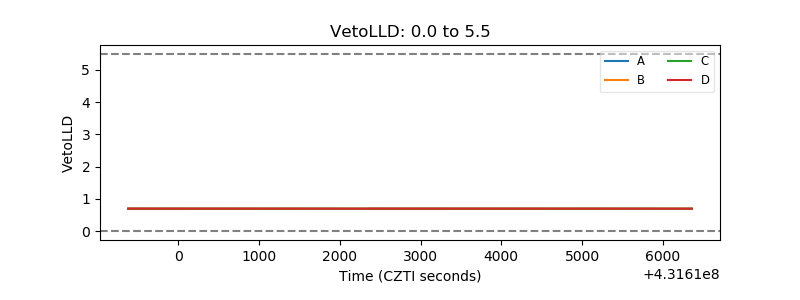 |
| Alpha Counter | 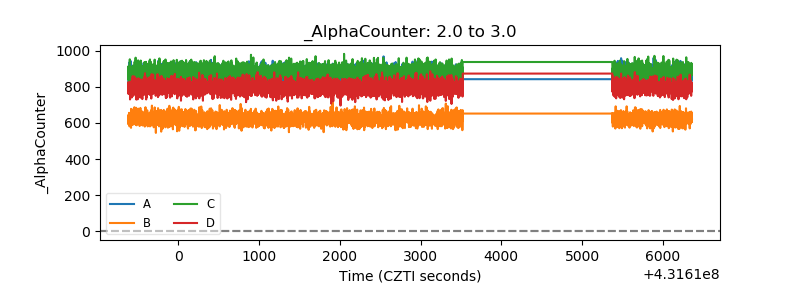 |
| _CPM_Rate | 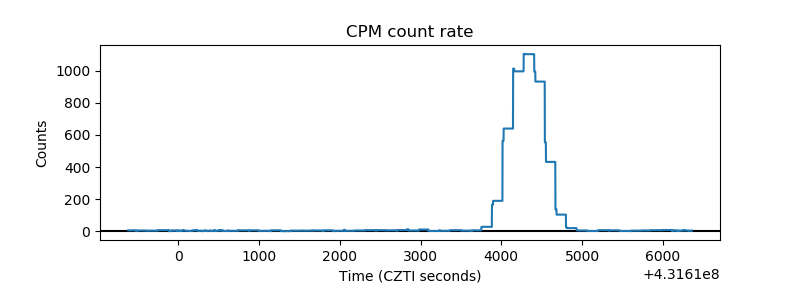 |
| CZT Counter | 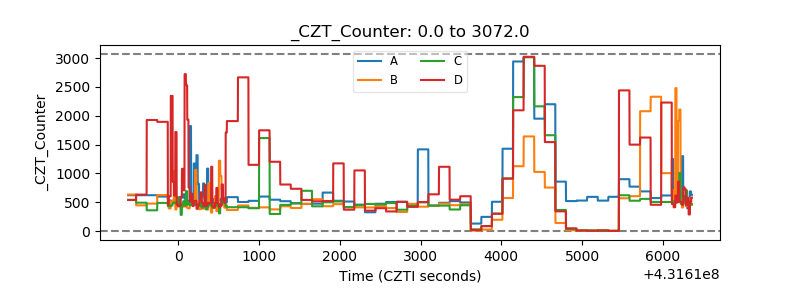 |
| +2.5 Volts monitor | 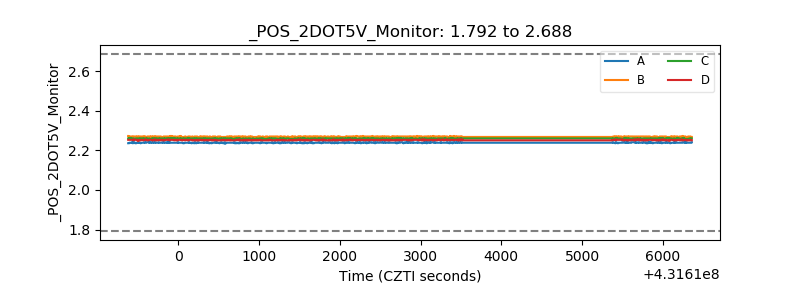 |
| +5 Volts monitor | 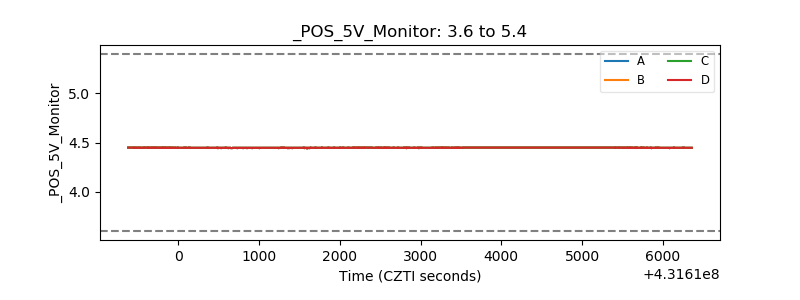 |
| _ROLL_ROT | 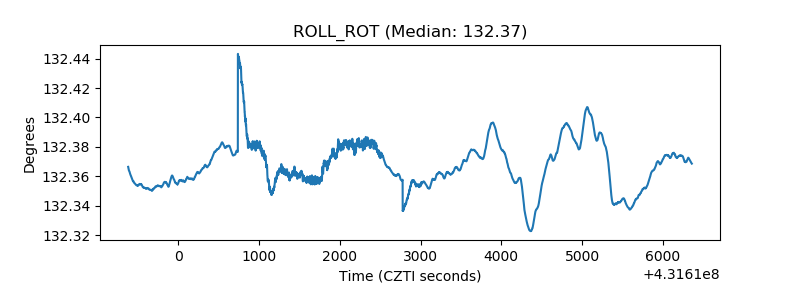 |
| _Roll_DEC | 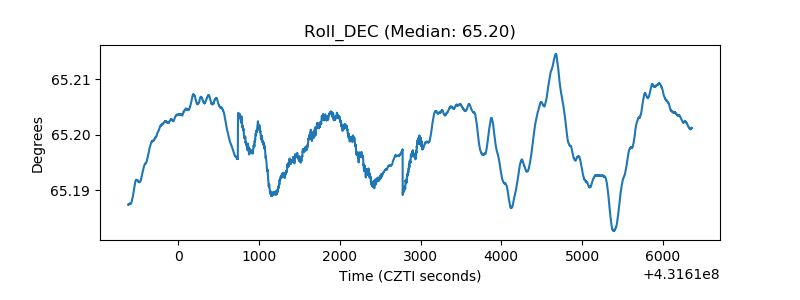 |
| _Roll_RA | 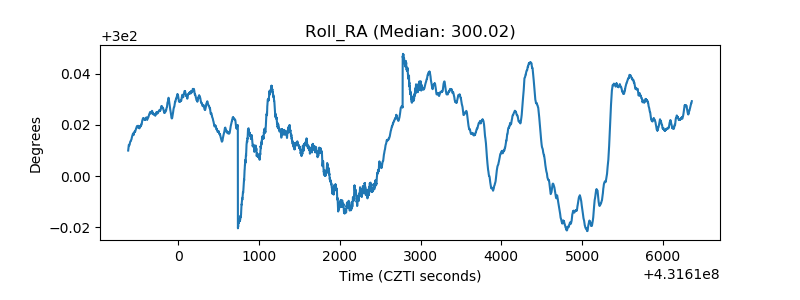 |
| Veto Counter | 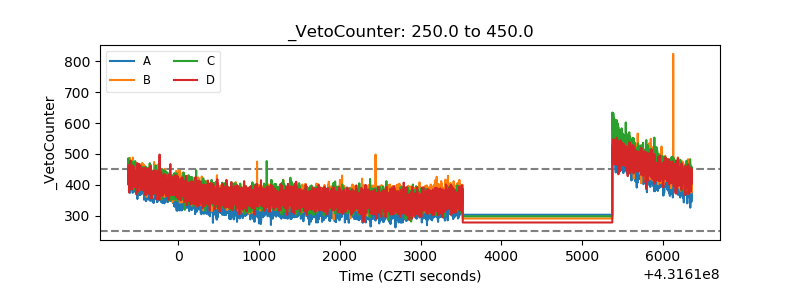 |