| Param | Original file | Final file |
|---|---|---|
| Filename | modeM0/AS1T05_143T01_9000005830_42922cztM0_level2.fits | modeM0/AS1T05_143T01_9000005830_42922cztM0_level2_quad_clean.evt |
| Size (bytes) | 415,183,680 | 87,903,360 |
| Size | 396.0 MB | 83.8 MB |
| Events in quadrant A | 3,323,866 | 629,222 |
| Events in quadrant B | 4,879,230 | 510,491 |
| Events in quadrant C | 2,561,243 | 610,976 |
| Events in quadrant D | 4,199,347 | 546,526 |
| Mode M0 | |||
|---|---|---|---|
| Quadrant | BADHDUFLAG | Total packets | Discarded packets |
| A | 0 | 13135 | 2 |
| B | 0 | 18069 | 1 |
| C | 0 | 10756 | 1 |
| D | 0 | 15981 | 1 |
| Mode M9 | |||
|---|---|---|---|
| Quadrant | BADHDUFLAG | Total packets | Discarded packets |
| A | 0 | 20 | 0 |
| B | 0 | 20 | 0 |
| C | 0 | 20 | 0 |
| D | 0 | 20 | 0 |
| Mode SS | |||
|---|---|---|---|
| Quadrant | BADHDUFLAG | Total packets | Discarded packets |
| A | 0 | 106 | 0 |
| B | 0 | 106 | 0 |
| C | 0 | 106 | 0 |
| D | 0 | 106 | 0 |
| Quadrant | Total seconds | Saturated seconds | Saturation percentage |
|---|---|---|---|
| A | 5203 | 146 | 2.806073% |
| B | 5204 | 1206 | 23.174481% |
| C | 5204 | 24 | 0.461184% |
| D | 5204 | 305 | 5.860876% |
Noise dominated data is calculated using 1-second bins in cleaned event files. If a bin has >2000 counts, and if more than 50% of those come from <1% of pixels, then it is considered to be noise-dominated and hence unusable.
| Quadrant | # 1 sec bins | Bins with >0 counts | Bins with >2000 counts | High rate bins dominated by noise | Noise dominated (total time) | Noise dominated (detector-on time) | Marked lightcurve |
|---|---|---|---|---|---|---|---|
| A | 7146 | 5204 | 130 | 130 | 1.82% | 2.50% | 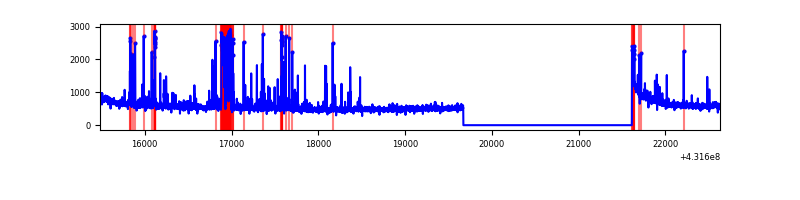 |
| B | 7147 | 5205 | 1053 | 1053 | 14.73% | 20.23% | 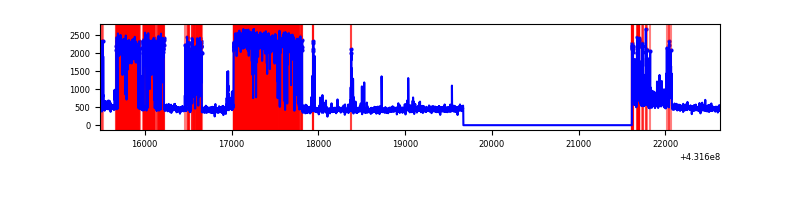 |
| C | 7147 | 5205 | 21 | 21 | 0.29% | 0.40% | 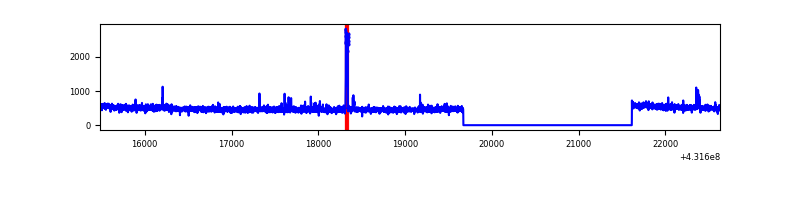 |
| D | 7147 | 5205 | 303 | 303 | 4.24% | 5.82% | 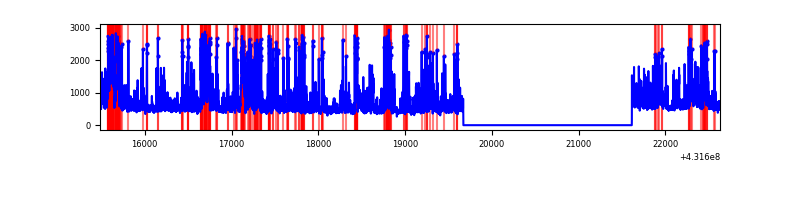 |
Top three noisy pixels from each quadrant. If the there are fewer than three noisy pixels in the level2.evt file, extra rows are filled as -1
| Pixel properties | Quadrant properties | ||||||
|---|---|---|---|---|---|---|---|
| Quadrant | DetID | PixID | Counts | Sigma | Mean | Median | Sigma |
| A | 10 | 83 | 546720 | 4541.75 | 588 | 576 | 120.2 |
| A | 15 | 237 | 331776 | 2754.27 | 588 | 576 | 120.2 |
| A | 2 | 79 | 115854 | 958.65 | 588 | 576 | 120.2 |
| B | 4 | 81 | 2776508 | 28403.97 | 513 | 500 | 97.7 |
| B | 4 | 171 | 42700 | 431.78 | 513 | 500 | 97.7 |
| B | 5 | 172 | 28184 | 283.26 | 513 | 500 | 97.7 |
| C | 15 | 214 | 209390 | 1558.58 | 580 | 585 | 134.0 |
| C | 14 | 254 | 65124 | 481.74 | 580 | 585 | 134.0 |
| C | 12 | 249 | 13387 | 95.56 | 580 | 585 | 134.0 |
| D | 1 | 47 | 610491 | 4424.8 | 571 | 556 | 137.8 |
| D | 1 | 52 | 455950 | 3303.67 | 571 | 556 | 137.8 |
| D | 2 | 249 | 199124 | 1440.52 | 571 | 556 | 137.8 |
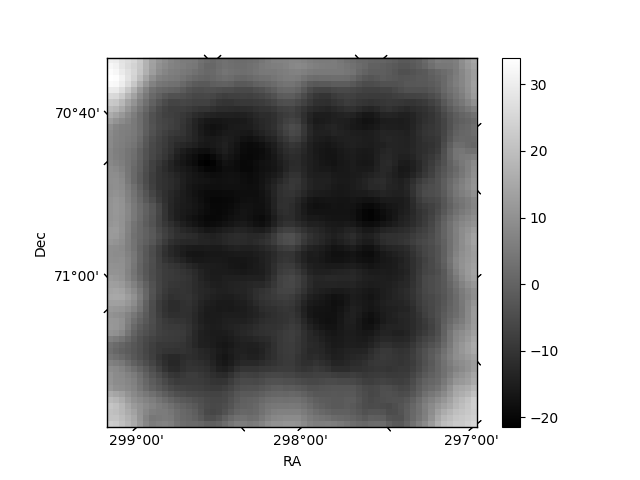
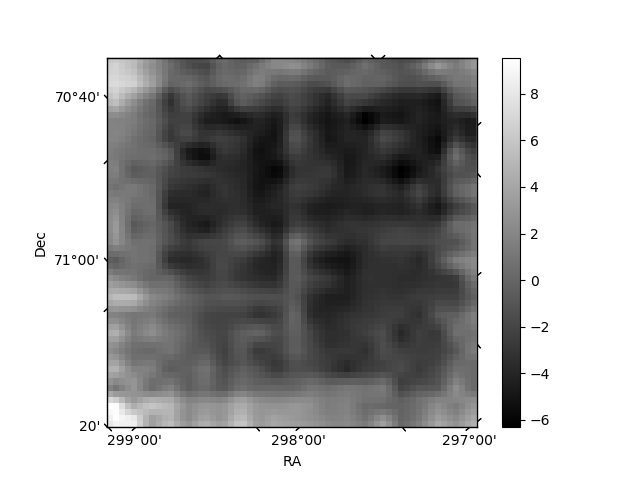
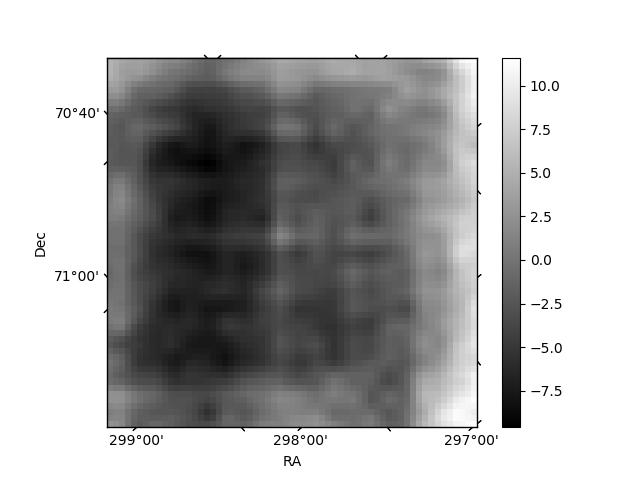
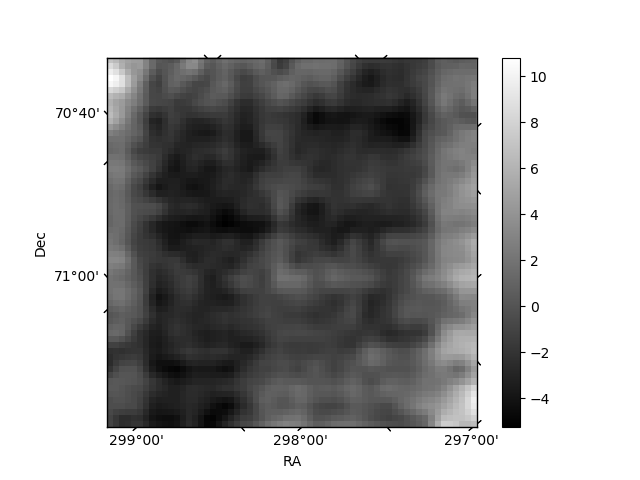
Histogram calculated using DETX and DETY for each event in the final _common_clean file
| Quadrant A | 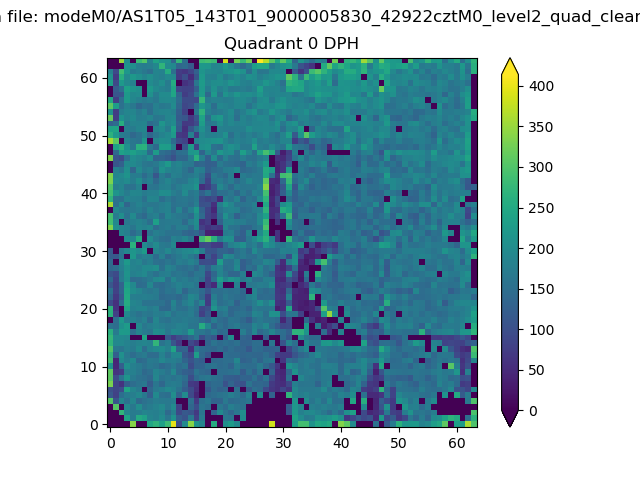 |
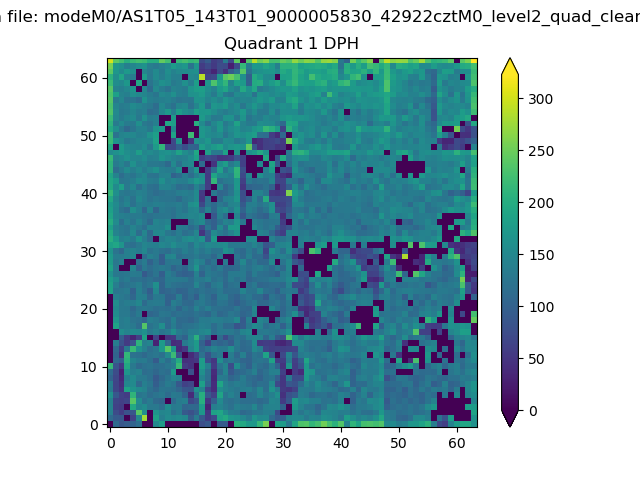 |
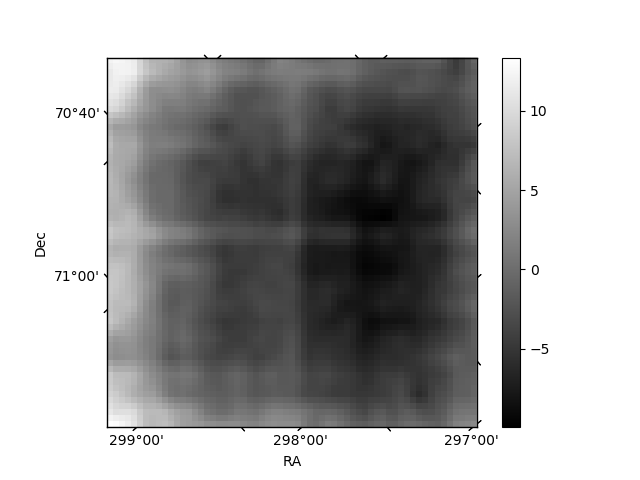
Quadrant B |
|---|---|---|---|
| Quadrant D | 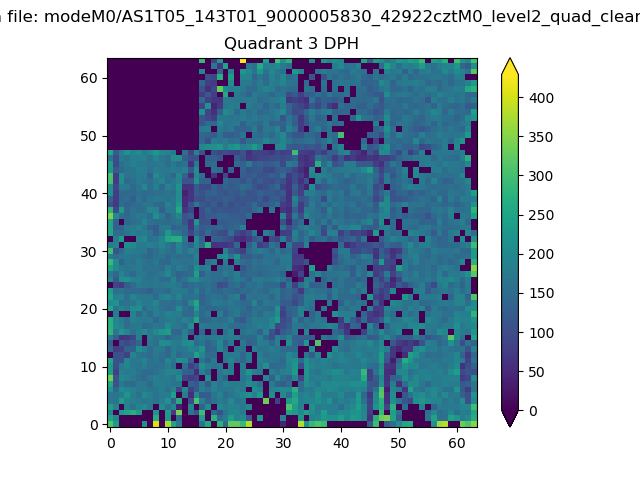 |
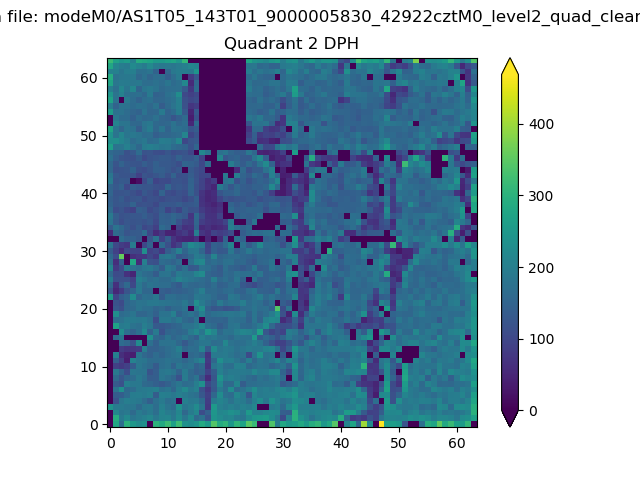 |
Quadrant C |
| Plot type | Count rate plots | Images |
|---|---|---|
| Comparison with Poisson distribution Blue bars denote a histogram of data divided into 1 sec bins. Red curve is a Poisson curve with rate = median count rate of data. |
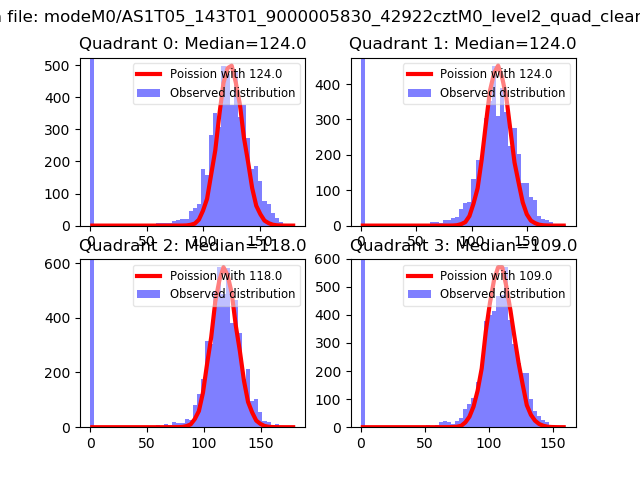 |
 |
| Quadrant-wise count rates Data is divided into 100 sec bins |
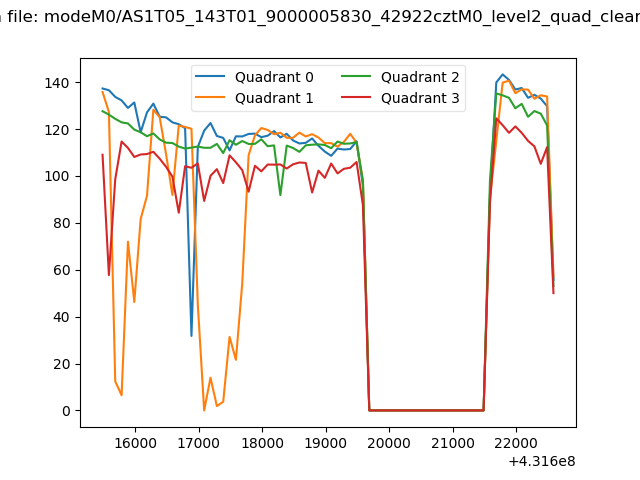 |
|
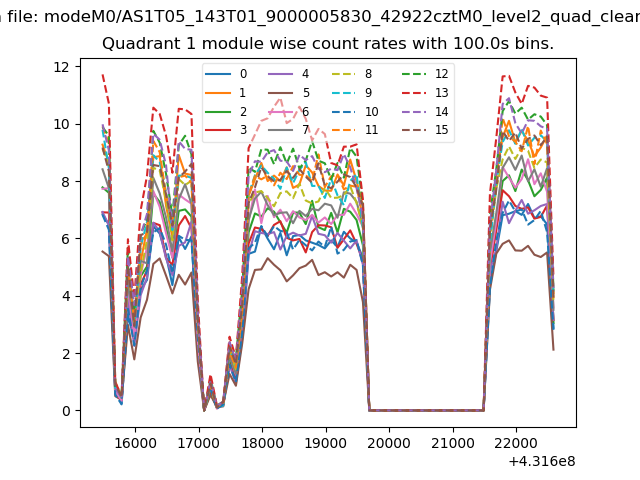
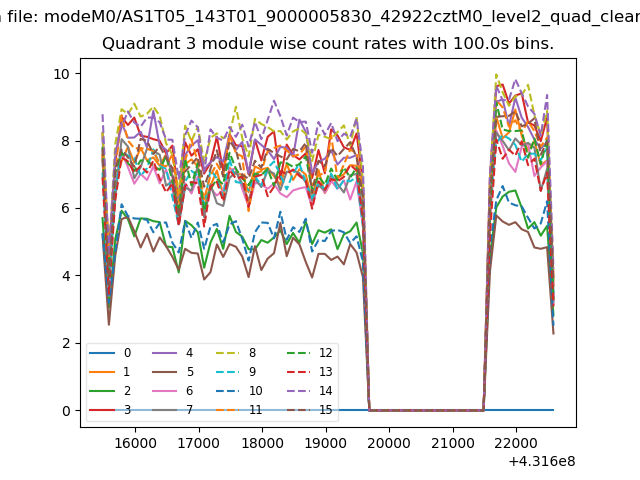
| Module-wise count rates for Quadrant A Data is divided into 100 sec bins |
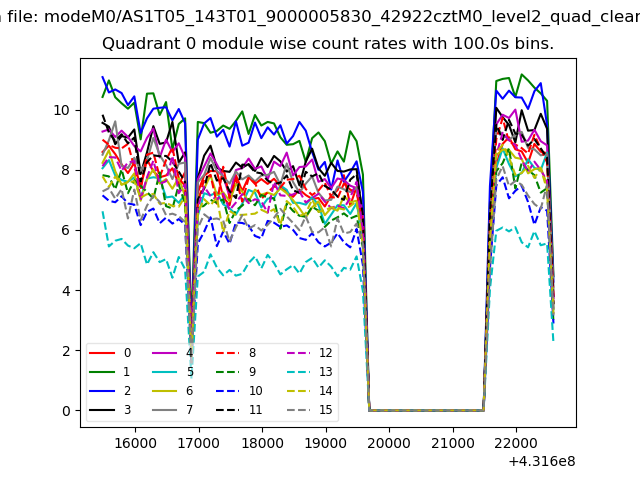 |
 |
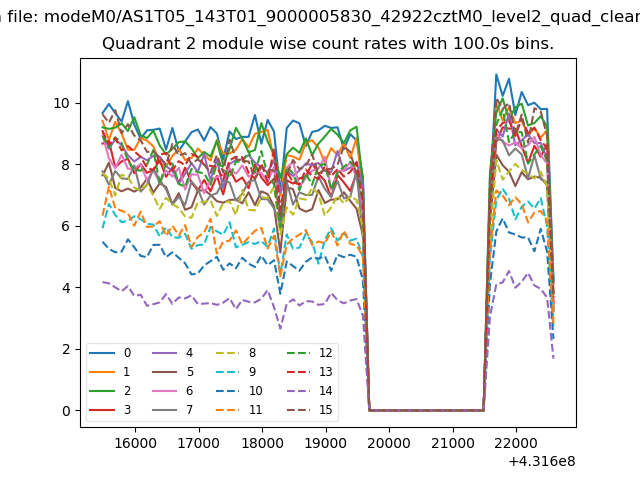
| Module-wise count rates for Quadrant B Data is divided into 100 sec bins |
 |
 |
| Module-wise count rates for Quadrant C Data is divided into 100 sec bins |
 |
 |
| Module-wise count rates for Quadrant D Data is divided into 100 sec bins |
 |
 |
| Parameter | Plot |
|---|---|
| CZT HV Monitor | 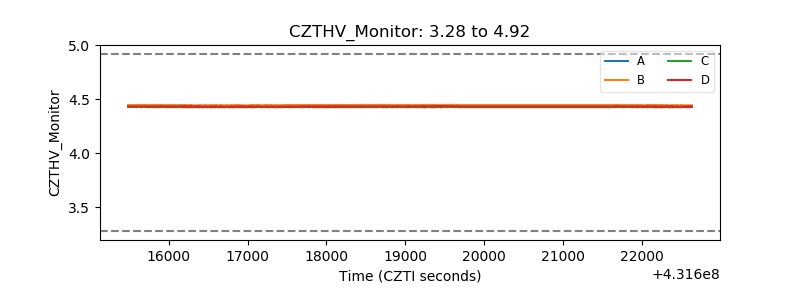 |
| D_VDD | 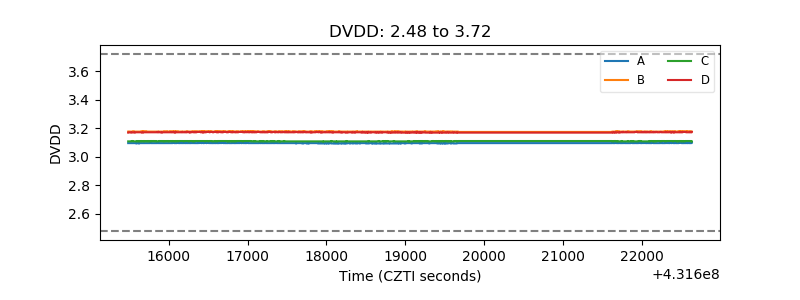 |
| Temperature 1 | 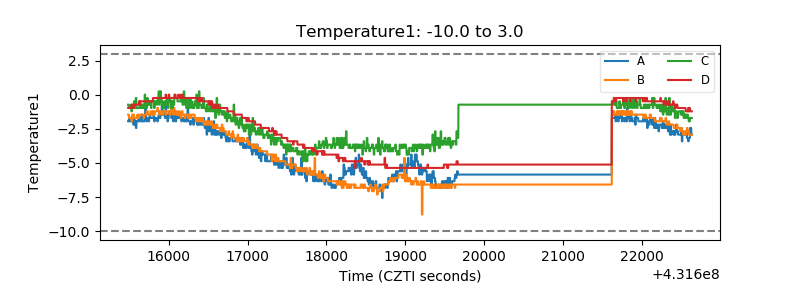 |
| Veto HV Monitor | 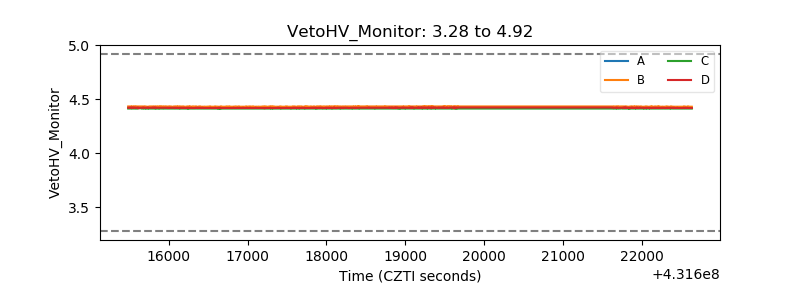 |
| Veto LLD | 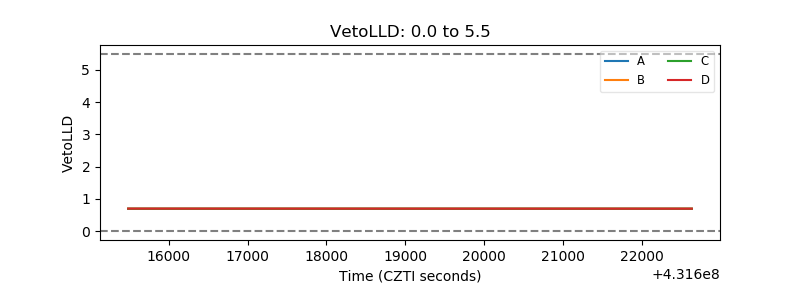 |
| Alpha Counter | 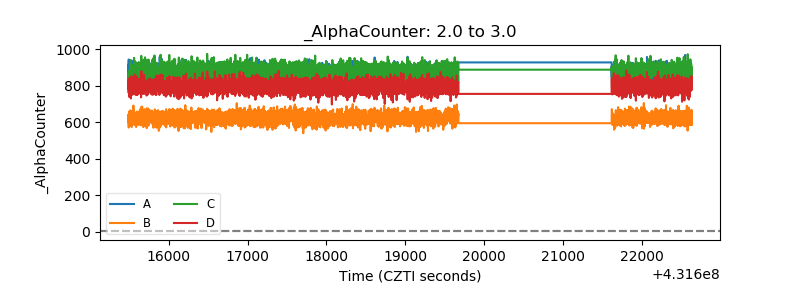 |
| _CPM_Rate | 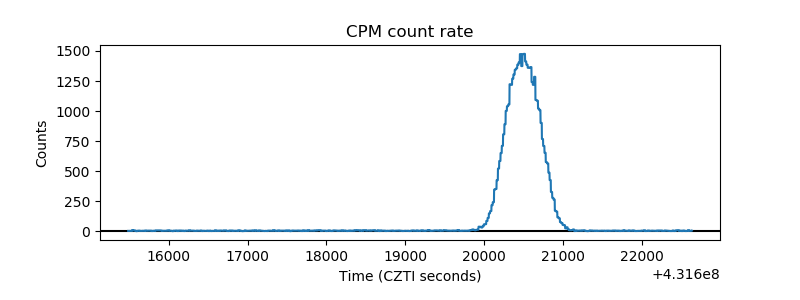 |
| CZT Counter | 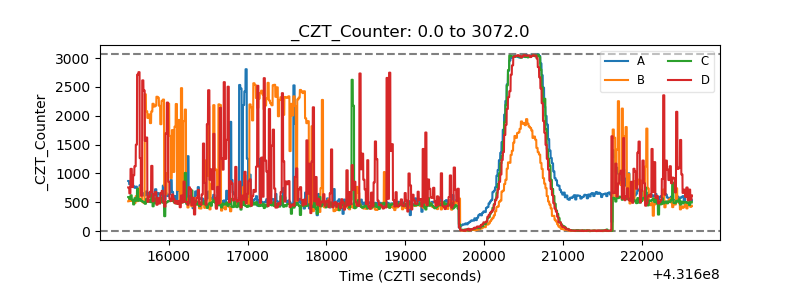 |
| +2.5 Volts monitor | 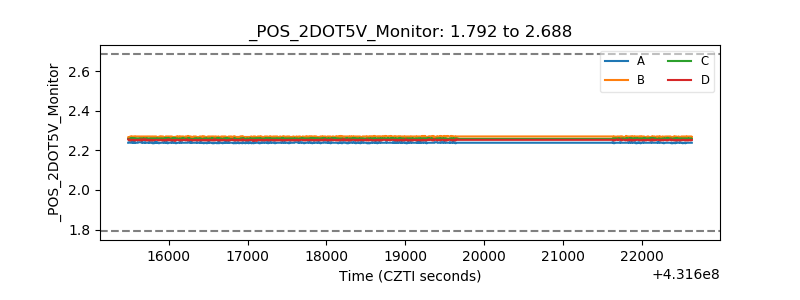 |
| +5 Volts monitor | 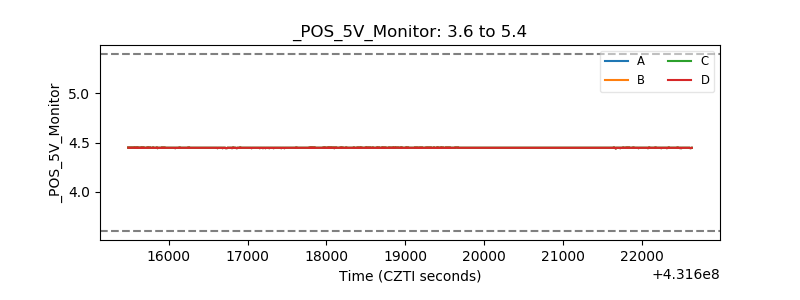 |
| _ROLL_ROT | 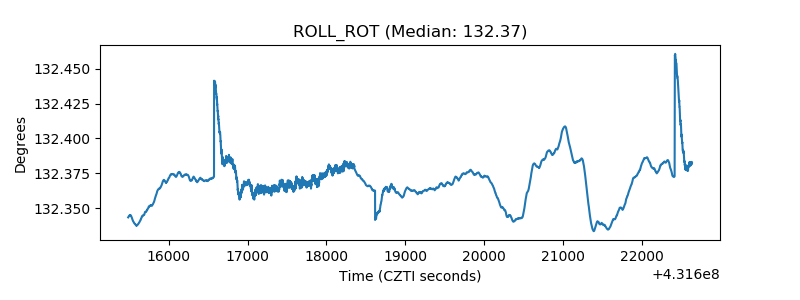 |
| _Roll_DEC | 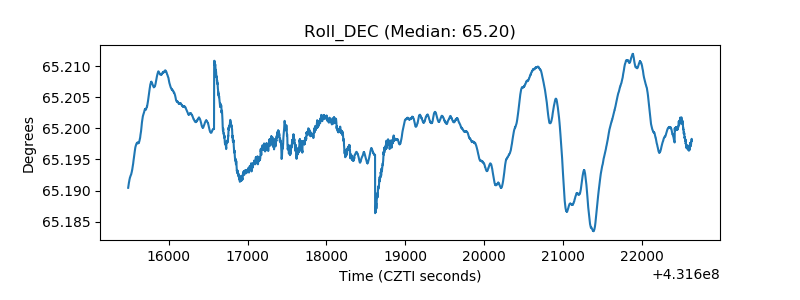 |
| _Roll_RA | 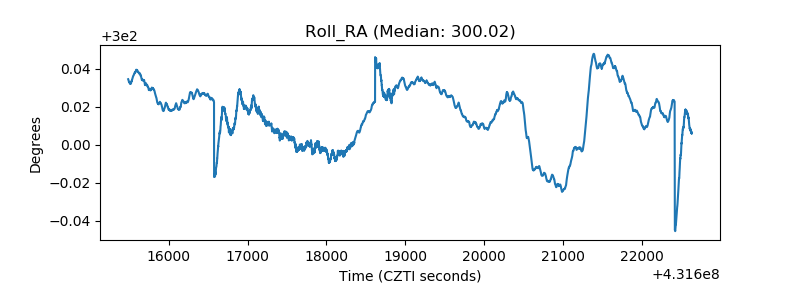 |
| Veto Counter | 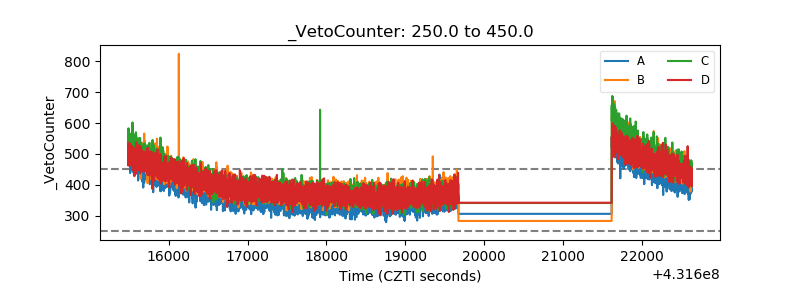 |