| Param | Original file | Final file |
|---|---|---|
| Filename | modeM0/AS1T05_143T01_9000005830_42923cztM0_level2.fits | modeM0/AS1T05_143T01_9000005830_42923cztM0_level2_quad_clean.evt |
| Size (bytes) | 349,680,960 | 91,771,200 |
| Size | 333.5 MB | 87.5 MB |
| Events in quadrant A | 2,975,463 | 636,258 |
| Events in quadrant B | 2,748,641 | 642,464 |
| Events in quadrant C | 2,510,688 | 616,865 |
| Events in quadrant D | 4,312,618 | 526,303 |
| Mode M0 | |||
|---|---|---|---|
| Quadrant | BADHDUFLAG | Total packets | Discarded packets |
| A | 0 | 12003 | 2 |
| B | 0 | 11605 | 2 |
| C | 0 | 10527 | 2 |
| D | 0 | 16351 | 4 |
| Mode M9 | |||
|---|---|---|---|
| Quadrant | BADHDUFLAG | Total packets | Discarded packets |
| A | 0 | 21 | 0 |
| B | 0 | 22 | 0 |
| C | 0 | 22 | 0 |
| D | 0 | 22 | 0 |
| Mode SS | |||
|---|---|---|---|
| Quadrant | BADHDUFLAG | Total packets | Discarded packets |
| A | 0 | 104 | 0 |
| B | 0 | 104 | 0 |
| C | 0 | 104 | 0 |
| D | 0 | 104 | 0 |
| Quadrant | Total seconds | Saturated seconds | Saturation percentage |
|---|---|---|---|
| A | 5096 | 33 | 0.647567% |
| B | 5096 | 61 | 1.197017% |
| C | 5096 | 6 | 0.117739% |
| D | 5095 | 451 | 8.851816% |
Noise dominated data is calculated using 1-second bins in cleaned event files. If a bin has >2000 counts, and if more than 50% of those come from <1% of pixels, then it is considered to be noise-dominated and hence unusable.
| Quadrant | # 1 sec bins | Bins with >0 counts | Bins with >2000 counts | High rate bins dominated by noise | Noise dominated (total time) | Noise dominated (detector-on time) | Marked lightcurve |
|---|---|---|---|---|---|---|---|
| A | 7159 | 5097 | 16 | 16 | 0.22% | 0.31% | 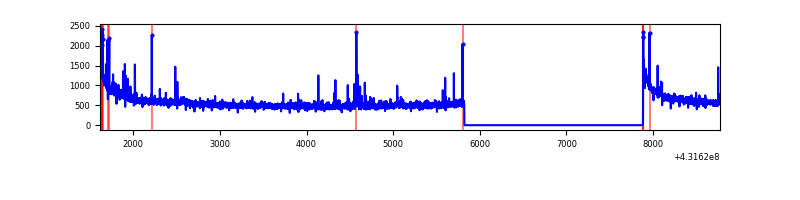 |
| B | 7159 | 5097 | 36 | 36 | 0.50% | 0.71% | 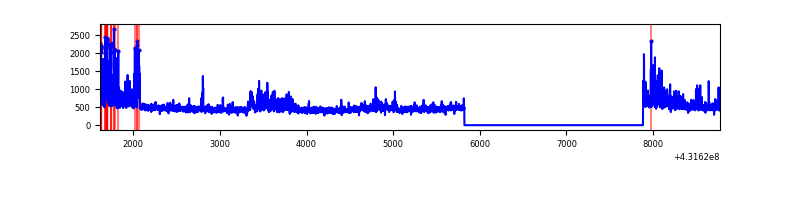 |
| C | 7159 | 5097 | 2 | 2 | 0.03% | 0.04% | 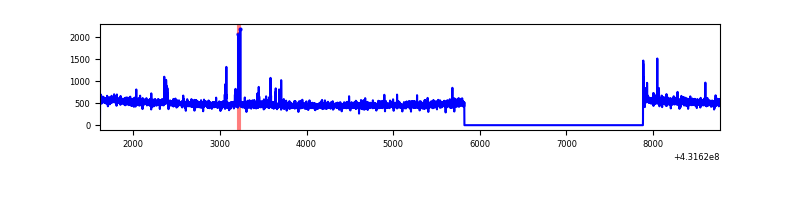 |
| D | 7158 | 5096 | 423 | 423 | 5.91% | 8.30% | 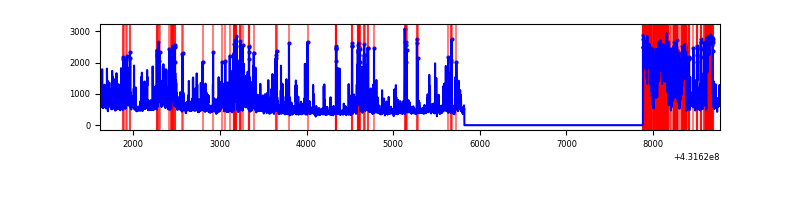 |
Top three noisy pixels from each quadrant. If the there are fewer than three noisy pixels in the level2.evt file, extra rows are filled as -1
| Pixel properties | Quadrant properties | ||||||
|---|---|---|---|---|---|---|---|
| Quadrant | DetID | PixID | Counts | Sigma | Mean | Median | Sigma |
| A | 10 | 83 | 595156 | 5033.26 | 581 | 568 | 118.1 |
| A | 2 | 79 | 45813 | 383.0 | 581 | 568 | 118.1 |
| A | 15 | 222 | 43631 | 364.53 | 581 | 568 | 118.1 |
| B | 4 | 81 | 409430 | 3745.57 | 577 | 562 | 109.2 |
| B | 4 | 171 | 38498 | 347.52 | 577 | 562 | 109.2 |
| B | 5 | 172 | 14722 | 129.72 | 577 | 562 | 109.2 |
| C | 15 | 214 | 206288 | 1550.96 | 574 | 579 | 132.6 |
| C | 14 | 254 | 21458 | 157.42 | 574 | 579 | 132.6 |
| C | 12 | 249 | 13168 | 94.92 | 574 | 579 | 132.6 |
| D | 1 | 47 | 968778 | 7326.74 | 548 | 534 | 132.2 |
| D | 1 | 52 | 409881 | 3097.55 | 548 | 534 | 132.2 |
| D | 2 | 249 | 199384 | 1504.71 | 548 | 534 | 132.2 |
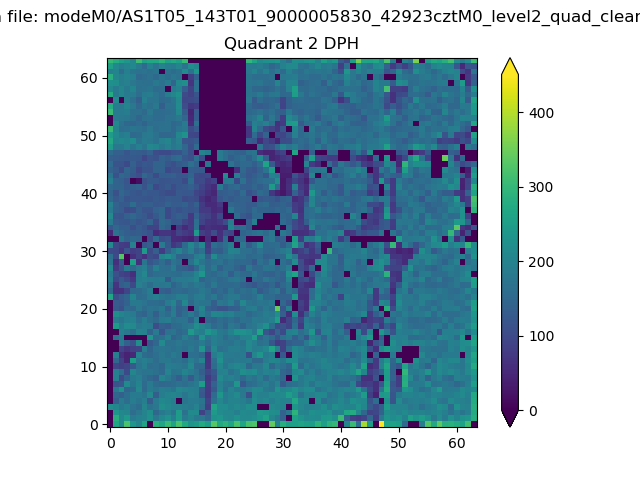
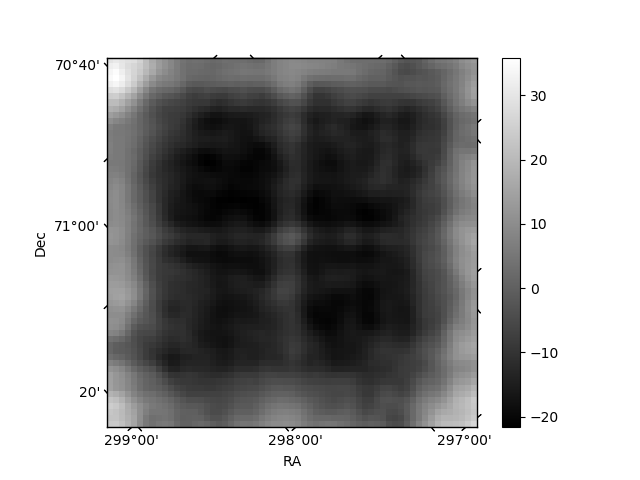
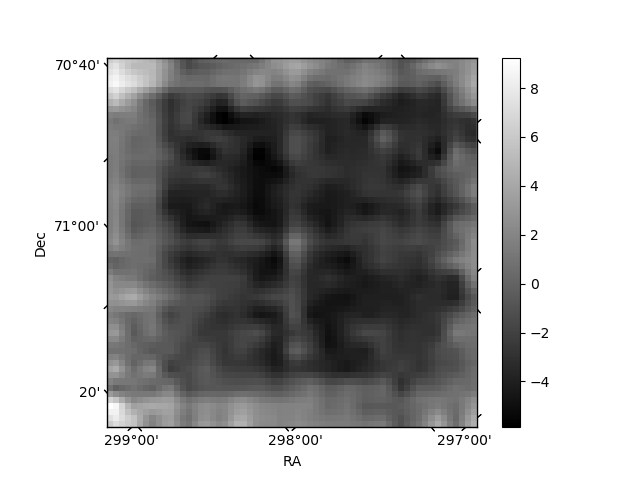
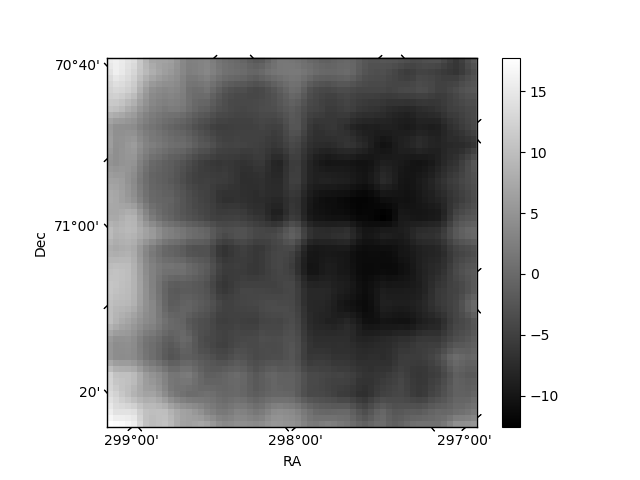
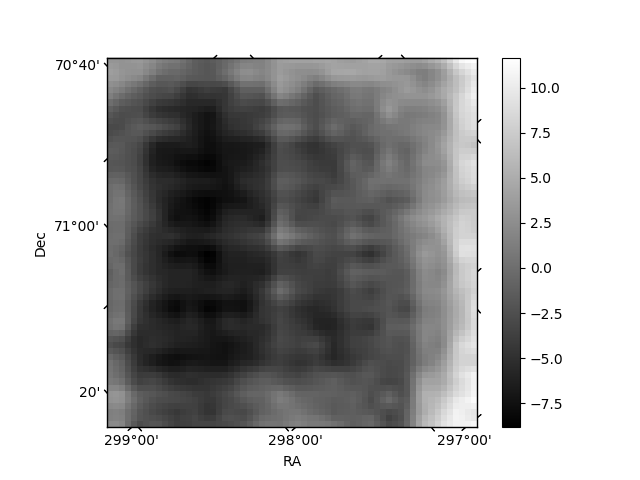
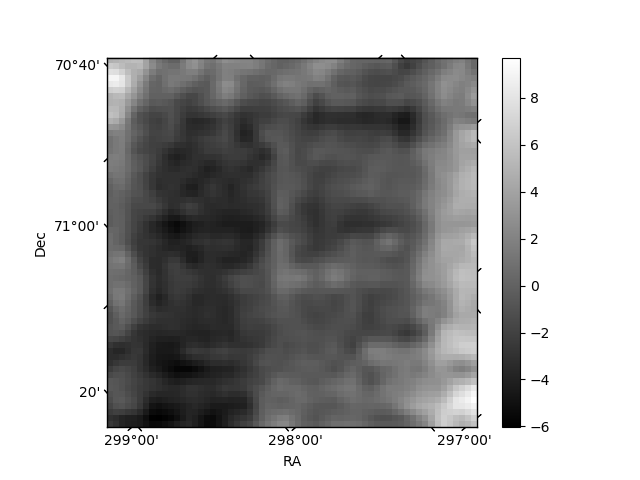
Histogram calculated using DETX and DETY for each event in the final _common_clean file
| Quadrant A | 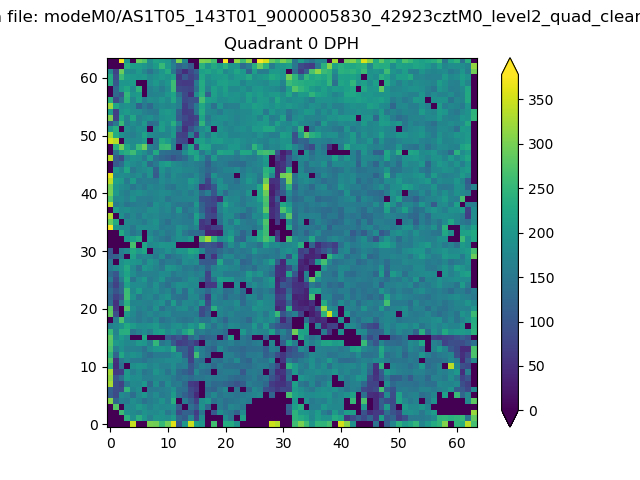 |
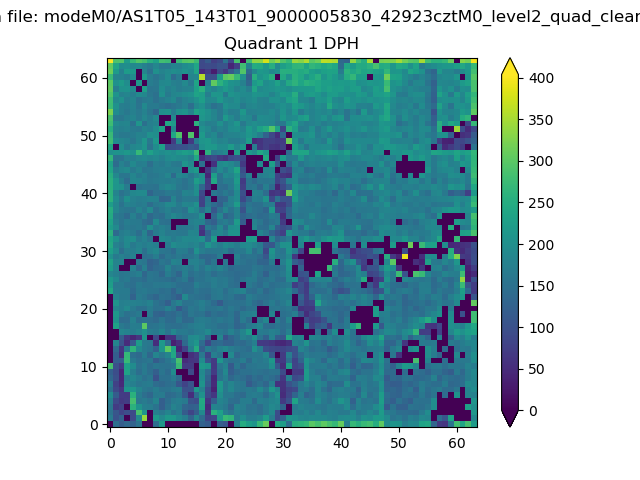 |
Quadrant B |
|---|---|---|---|
| Quadrant D | 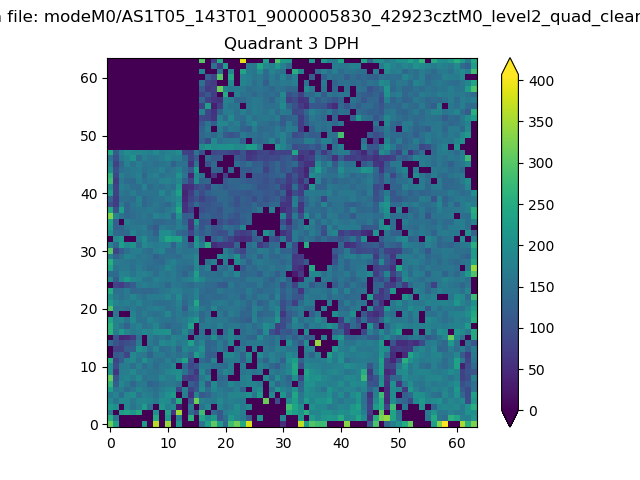 |
 |
Quadrant C |
| Plot type | Count rate plots | Images |
|---|---|---|
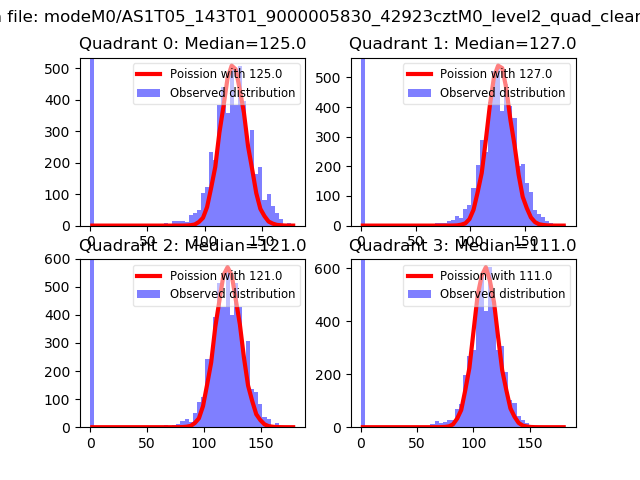
| Comparison with Poisson distribution Blue bars denote a histogram of data divided into 1 sec bins. Red curve is a Poisson curve with rate = median count rate of data. |
 |
 |
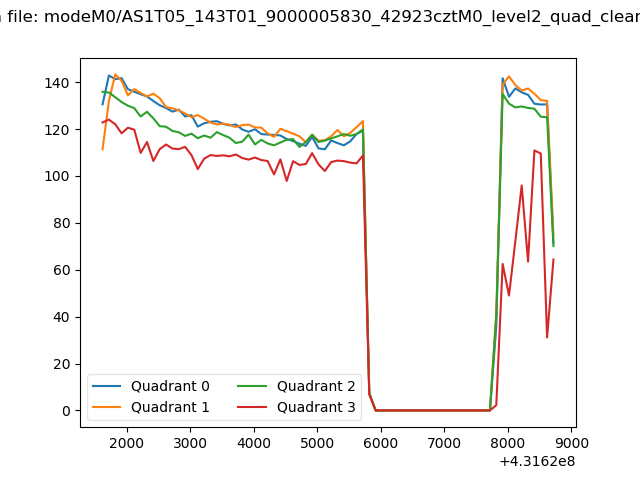
| Quadrant-wise count rates Data is divided into 100 sec bins |
 |
|
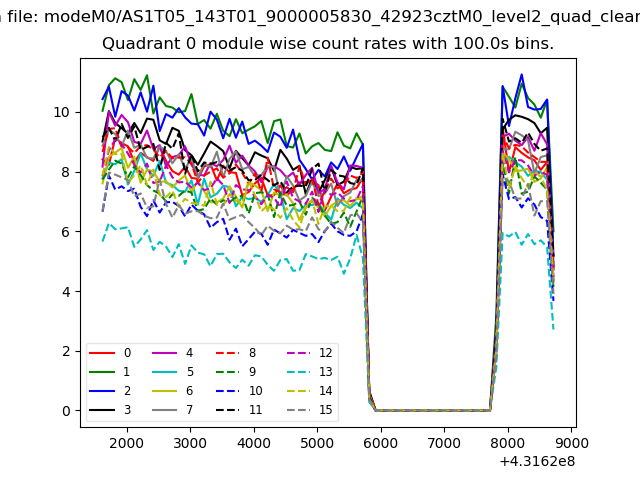
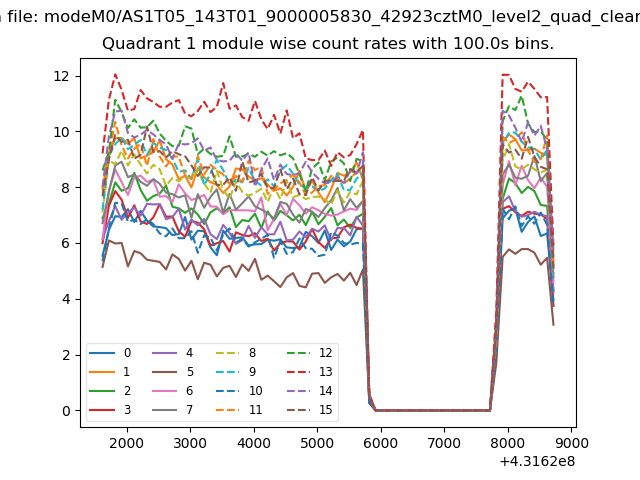
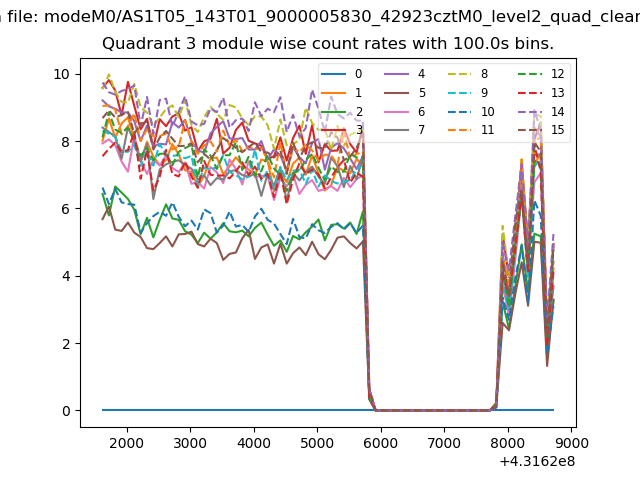
| Module-wise count rates for Quadrant A Data is divided into 100 sec bins |
 |
 |
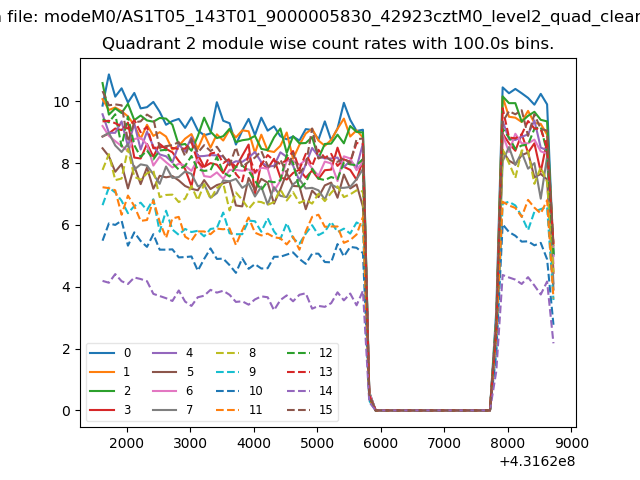
| Module-wise count rates for Quadrant B Data is divided into 100 sec bins |
 |
 |
| Module-wise count rates for Quadrant C Data is divided into 100 sec bins |
 |
 |
| Module-wise count rates for Quadrant D Data is divided into 100 sec bins |
 |
 |
| Parameter | Plot |
|---|---|
| CZT HV Monitor | 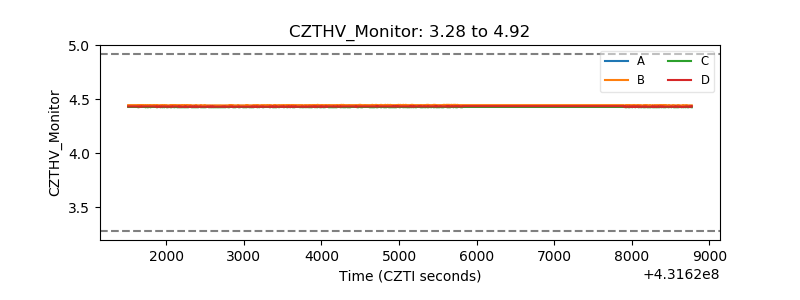 |
| D_VDD | 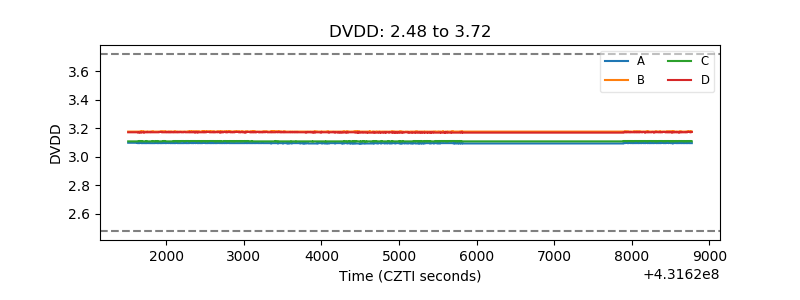 |
| Temperature 1 | 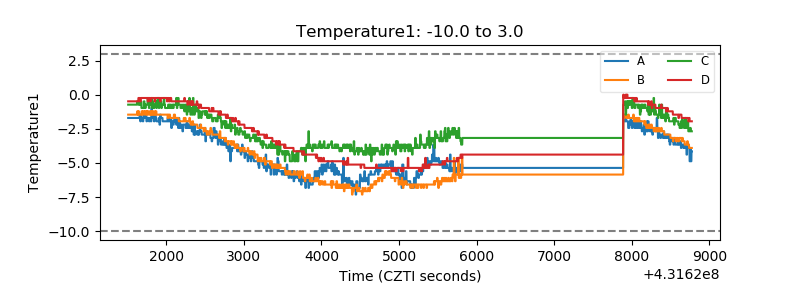 |
| Veto HV Monitor | 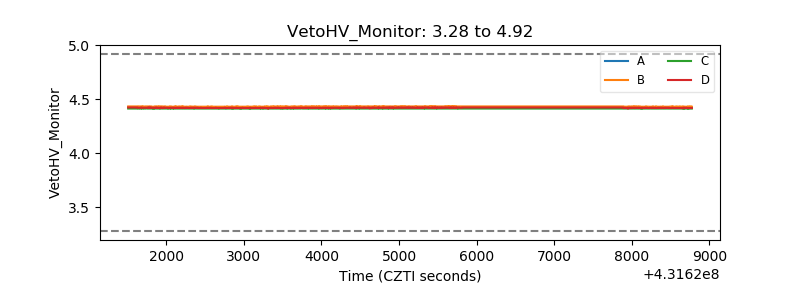 |
| Veto LLD | 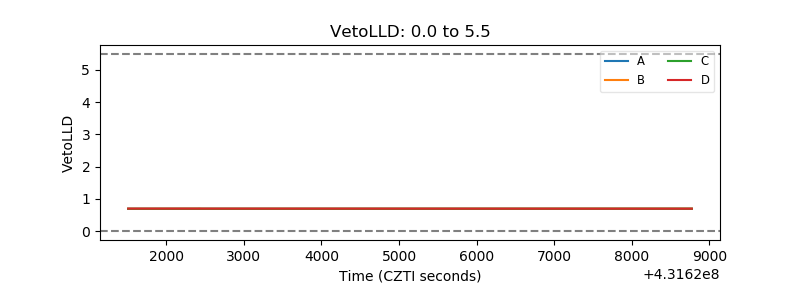 |
| Alpha Counter | 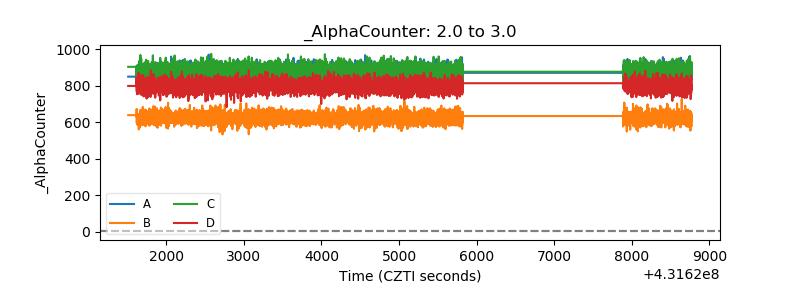 |
| _CPM_Rate | 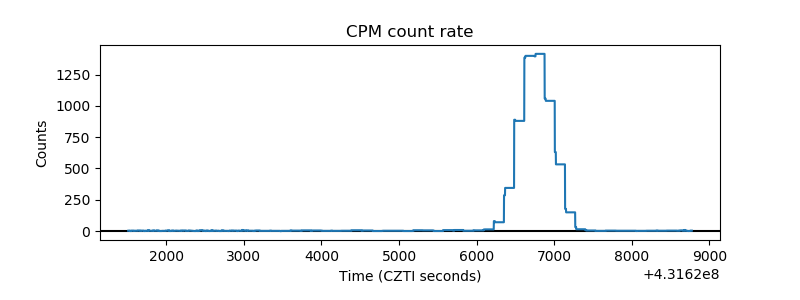 |
| CZT Counter | 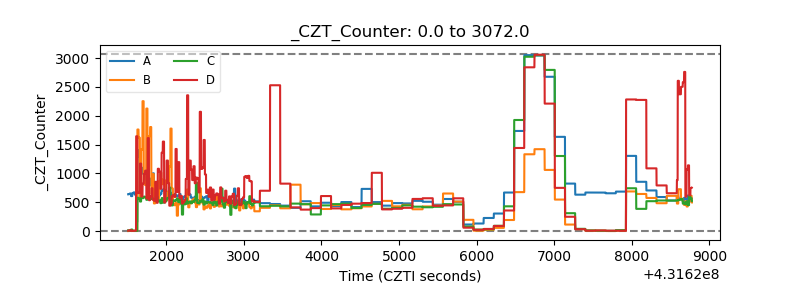 |
| +2.5 Volts monitor | 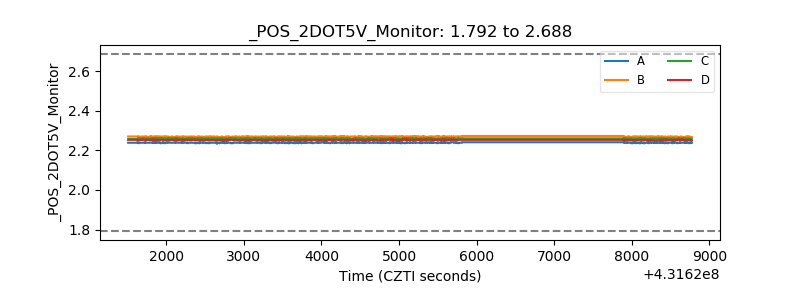 |
| +5 Volts monitor | 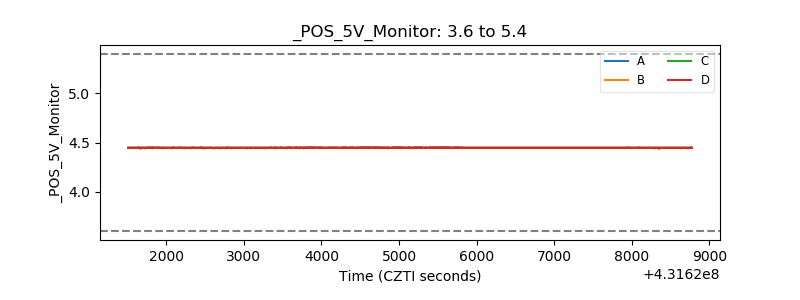 |
| _ROLL_ROT | 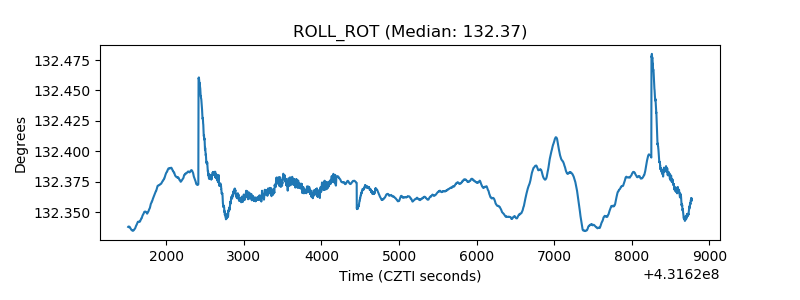 |
| _Roll_DEC | 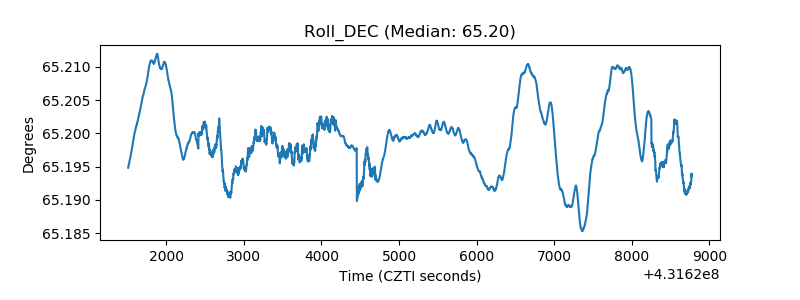 |
| _Roll_RA | 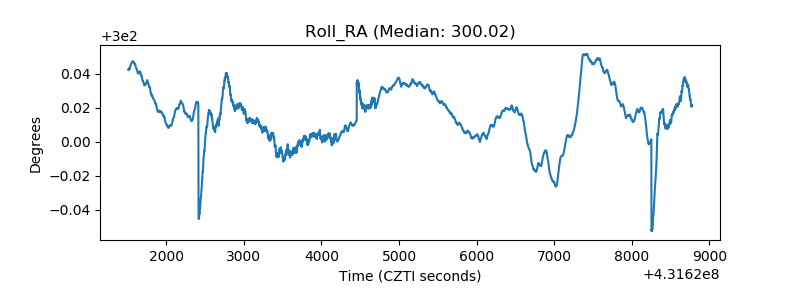 |
| Veto Counter | 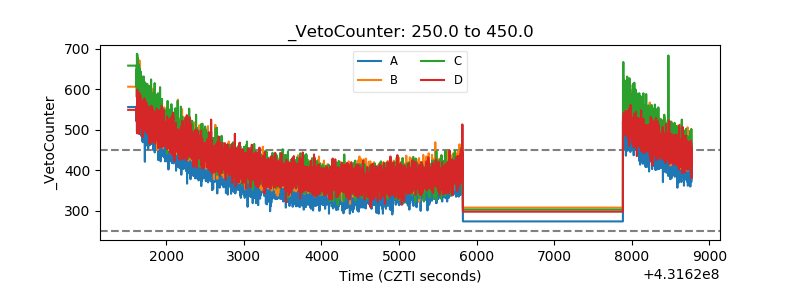 |