| Param | Original file | Final file |
|---|---|---|
| Filename | modeM0/AS1T05_143T01_9000005830_42924cztM0_level2.fits | modeM0/AS1T05_143T01_9000005830_42924cztM0_level2_quad_clean.evt |
| Size (bytes) | 373,714,560 | 82,687,680 |
| Size | 356.4 MB | 78.9 MB |
| Events in quadrant A | 2,899,213 | 579,218 |
| Events in quadrant B | 2,583,535 | 585,843 |
| Events in quadrant C | 2,330,359 | 573,043 |
| Events in quadrant D | 5,645,871 | 427,773 |
| Mode M0 | |||
|---|---|---|---|
| Quadrant | BADHDUFLAG | Total packets | Discarded packets |
| A | 0 | 11654 | 2 |
| B | 0 | 11030 | 4 |
| C | 0 | 9887 | 2 |
| D | 0 | 20165 | 16 |
| Mode M9 | |||
|---|---|---|---|
| Quadrant | BADHDUFLAG | Total packets | Discarded packets |
| A | 0 | 22 | 0 |
| B | 0 | 23 | 0 |
| C | 0 | 23 | 0 |
| D | 0 | 23 | 0 |
| Mode SS | |||
|---|---|---|---|
| Quadrant | BADHDUFLAG | Total packets | Discarded packets |
| A | 0 | 100 | 0 |
| B | 0 | 100 | 0 |
| C | 0 | 100 | 0 |
| D | 0 | 100 | 0 |
| Quadrant | Total seconds | Saturated seconds | Saturation percentage |
|---|---|---|---|
| A | 4812 | 45 | 0.935162% |
| B | 4811 | 114 | 2.369570% |
| C | 4812 | 3 | 0.062344% |
| D | 4810 | 1014 | 21.081081% |
Noise dominated data is calculated using 1-second bins in cleaned event files. If a bin has >2000 counts, and if more than 50% of those come from <1% of pixels, then it is considered to be noise-dominated and hence unusable.
| Quadrant | # 1 sec bins | Bins with >0 counts | Bins with >2000 counts | High rate bins dominated by noise | Noise dominated (total time) | Noise dominated (detector-on time) | Marked lightcurve |
|---|---|---|---|---|---|---|---|
| A | 6935 | 4813 | 28 | 28 | 0.40% | 0.58% | 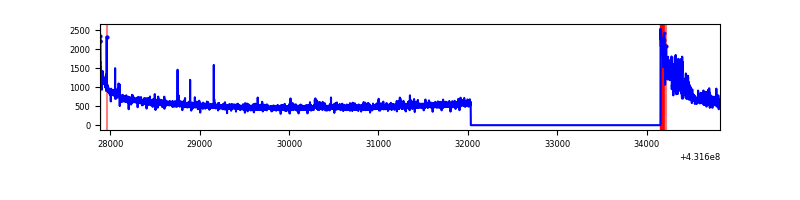 |
| B | 6935 | 4813 | 94 | 94 | 1.36% | 1.95% | 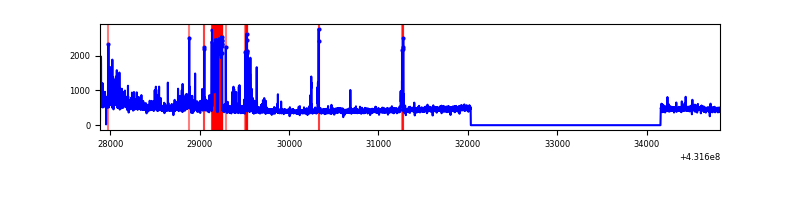 |
| C | 6935 | 4813 | 0 | 0 | 0.00% | 0.00% | 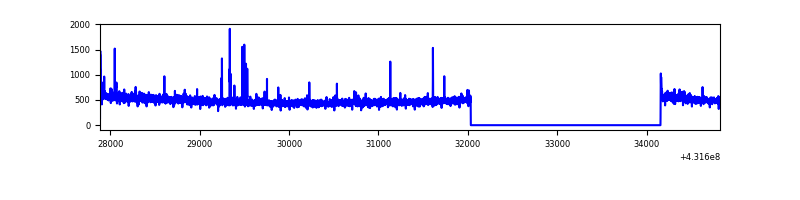 |
| D | 6934 | 4810 | 1037 | 1037 | 14.96% | 21.56% |  |
Top three noisy pixels from each quadrant. If the there are fewer than three noisy pixels in the level2.evt file, extra rows are filled as -1
| Pixel properties | Quadrant properties | ||||||
|---|---|---|---|---|---|---|---|
| Quadrant | DetID | PixID | Counts | Sigma | Mean | Median | Sigma |
| A | 10 | 83 | 555044 | 5069.81 | 533 | 523 | 109.4 |
| A | 15 | 222 | 245854 | 2242.98 | 533 | 523 | 109.4 |
| A | 2 | 79 | 19593 | 174.35 | 533 | 523 | 109.4 |
| B | 4 | 81 | 432662 | 4241.69 | 529 | 516 | 101.9 |
| B | 5 | 172 | 48367 | 469.68 | 529 | 516 | 101.9 |
| B | 4 | 171 | 12489 | 117.52 | 529 | 516 | 101.9 |
| C | 15 | 214 | 193480 | 1584.11 | 532 | 536 | 121.8 |
| C | 0 | 207 | 15139 | 119.89 | 532 | 536 | 121.8 |
| C | 5 | 250 | 12770 | 100.44 | 532 | 536 | 121.8 |
| D | 1 | 47 | 2209162 | 19649.69 | 467 | 455 | 112.4 |
| D | 12 | 6 | 506673 | 4503.55 | 467 | 455 | 112.4 |
| D | 1 | 52 | 384594 | 3417.48 | 467 | 455 | 112.4 |
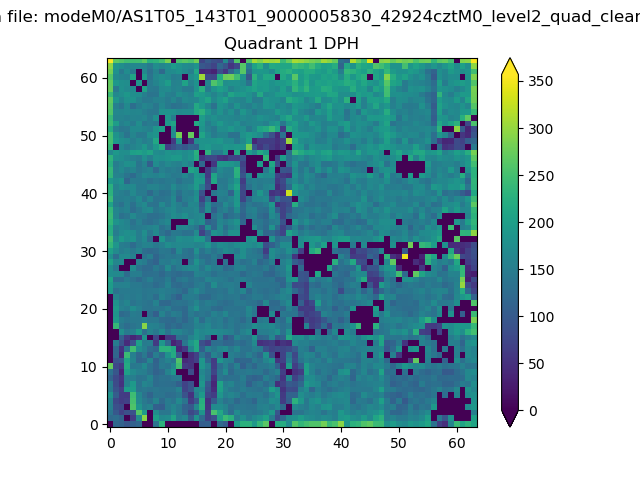
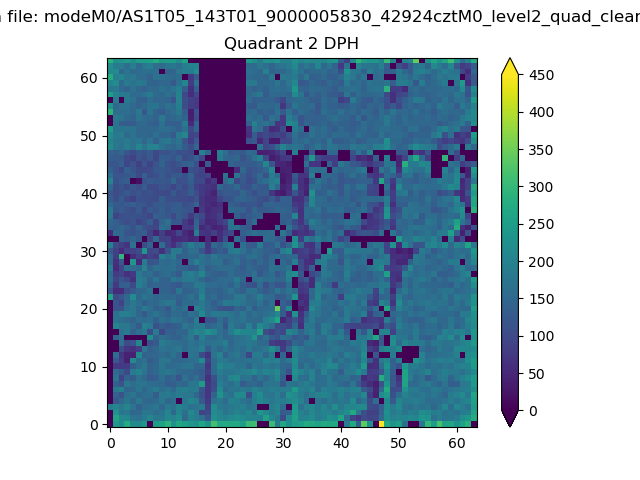
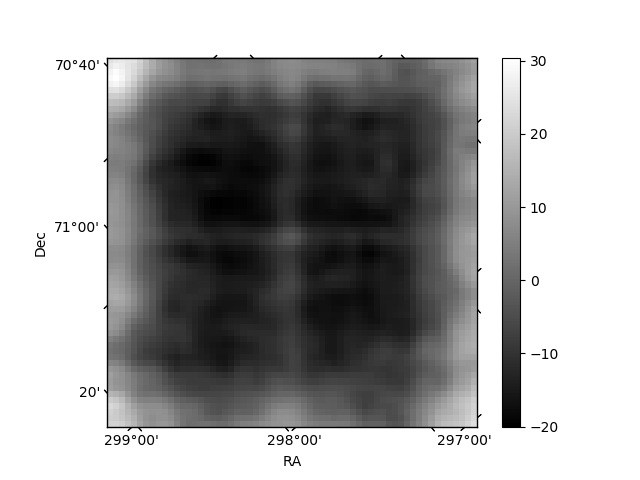
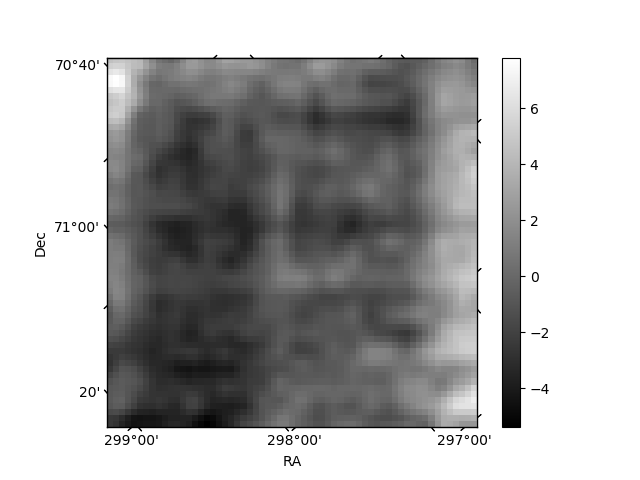
Histogram calculated using DETX and DETY for each event in the final _common_clean file
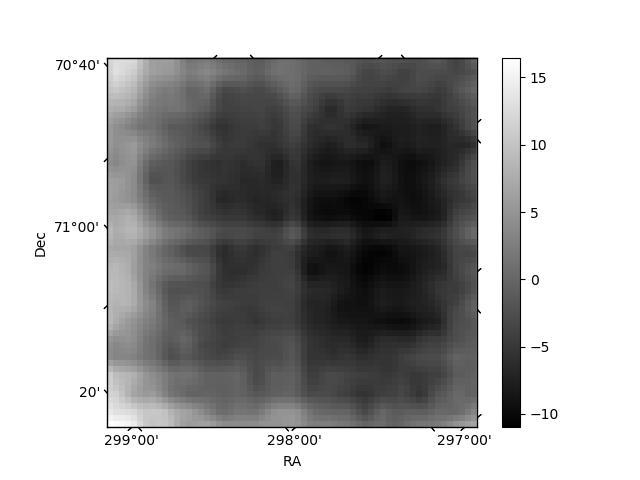
| Quadrant A | 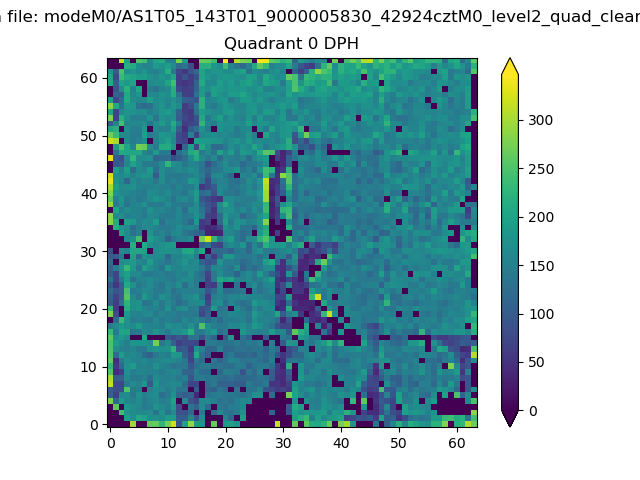 |
 |
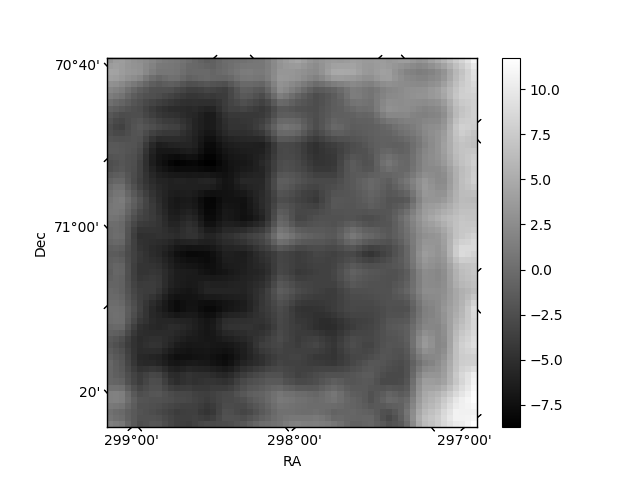
Quadrant B |
|---|---|---|---|
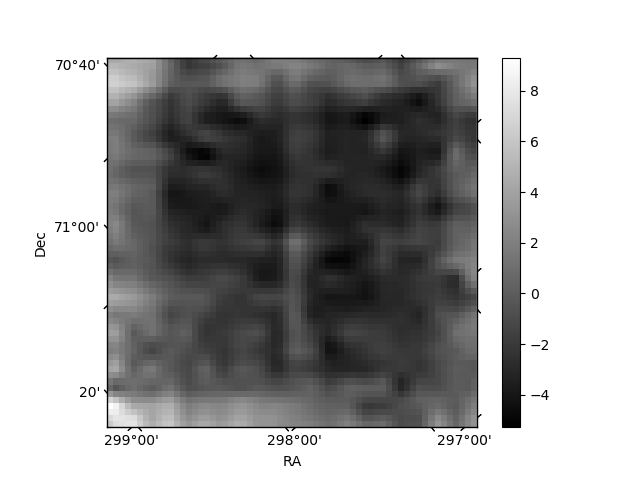
| Quadrant D | 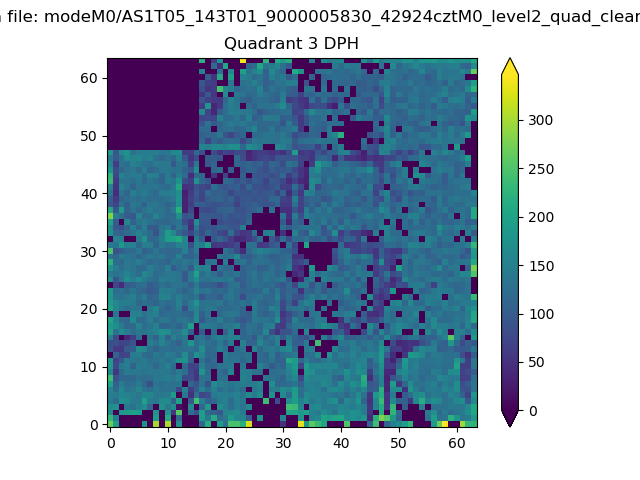 |
 |
Quadrant C |
| Plot type | Count rate plots | Images |
|---|---|---|
| Comparison with Poisson distribution Blue bars denote a histogram of data divided into 1 sec bins. Red curve is a Poisson curve with rate = median count rate of data. |
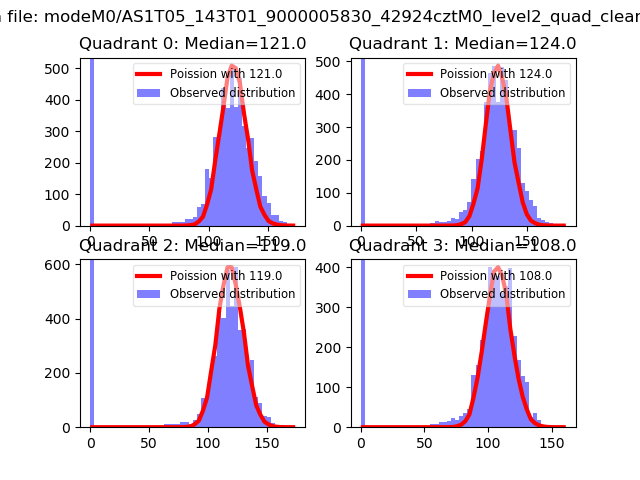 |
 |
| Quadrant-wise count rates Data is divided into 100 sec bins |
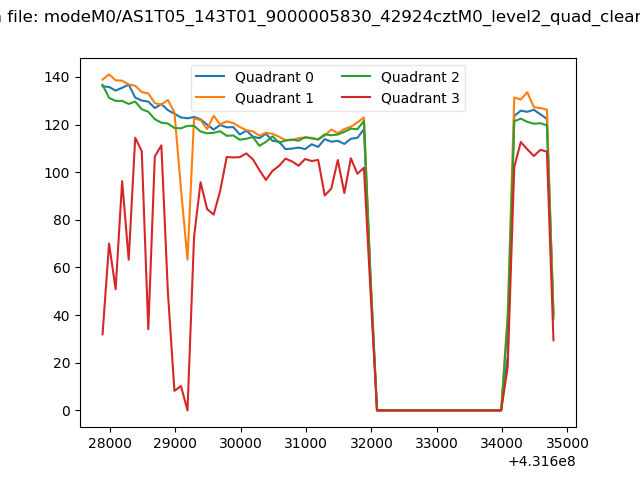 |
|
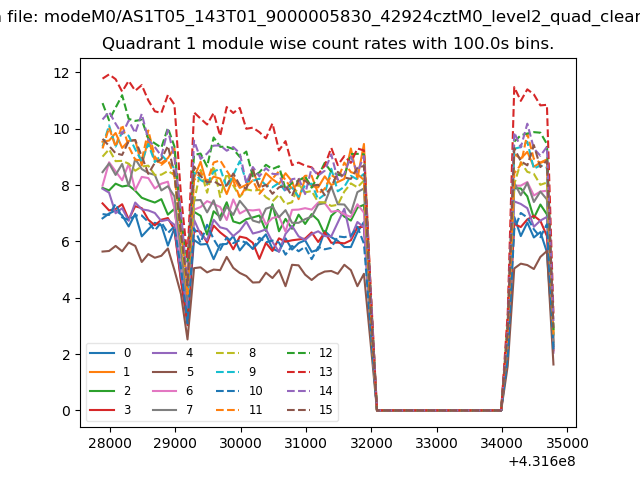
| Module-wise count rates for Quadrant A Data is divided into 100 sec bins |
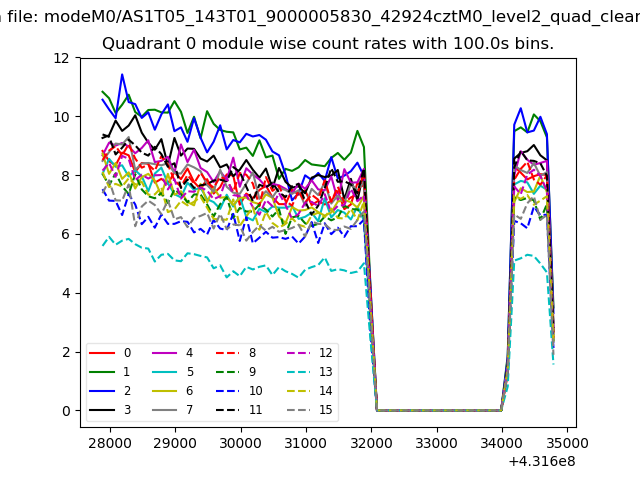 |
 |
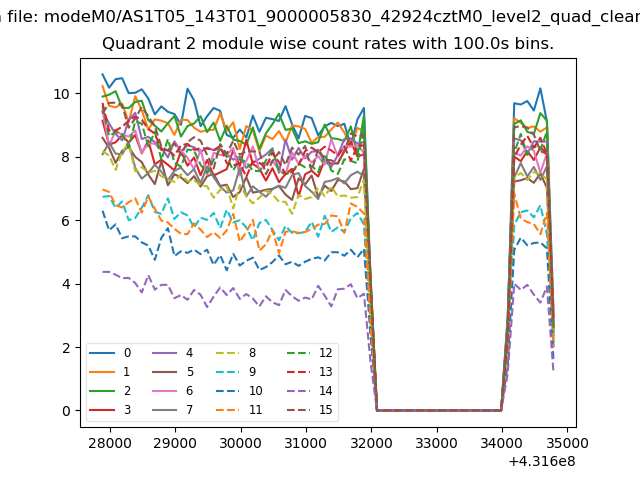
| Module-wise count rates for Quadrant B Data is divided into 100 sec bins |
 |
 |
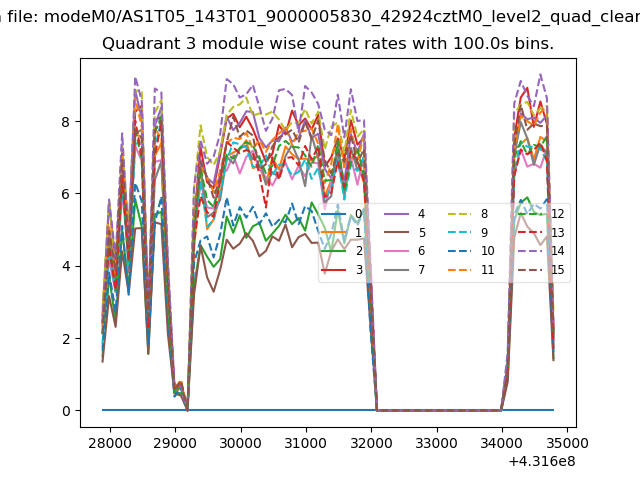
| Module-wise count rates for Quadrant C Data is divided into 100 sec bins |
 |
 |
| Module-wise count rates for Quadrant D Data is divided into 100 sec bins |
 |
 |
| Parameter | Plot |
|---|---|
| CZT HV Monitor | 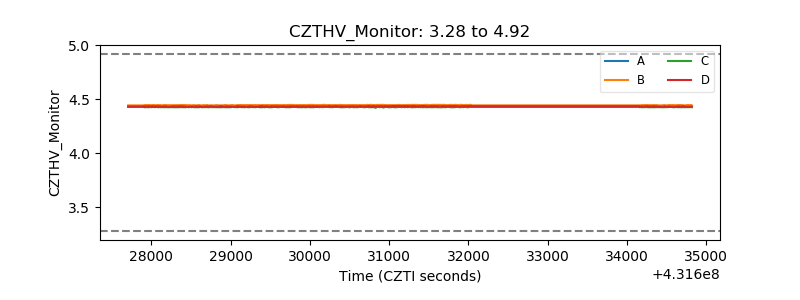 |
| D_VDD | 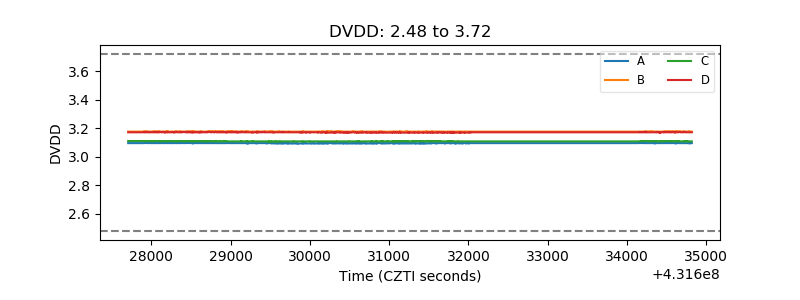 |
| Temperature 1 |  |
| Veto HV Monitor | 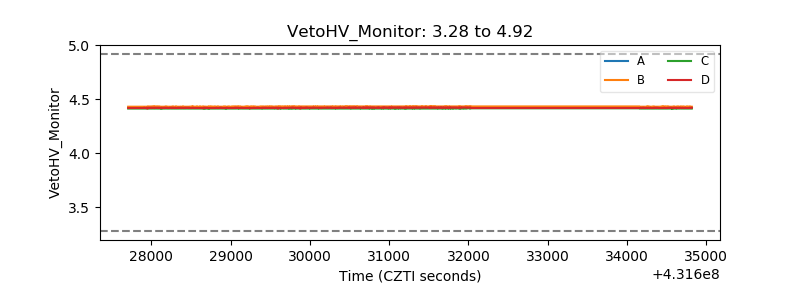 |
| Veto LLD | 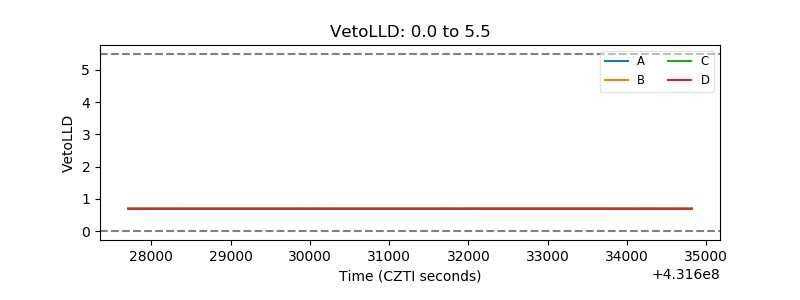 |
| Alpha Counter | 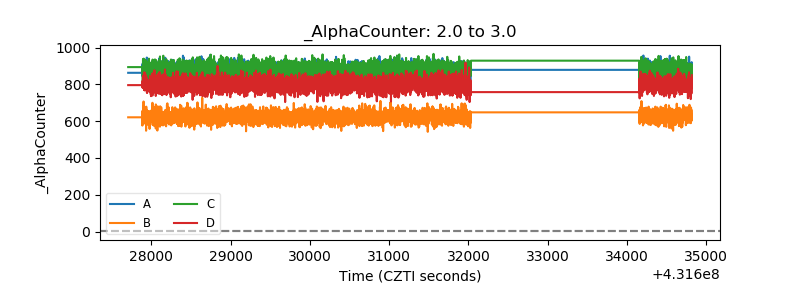 |
| _CPM_Rate | 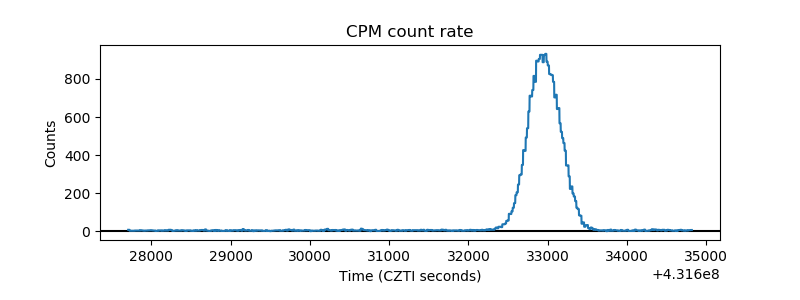 |
| CZT Counter | 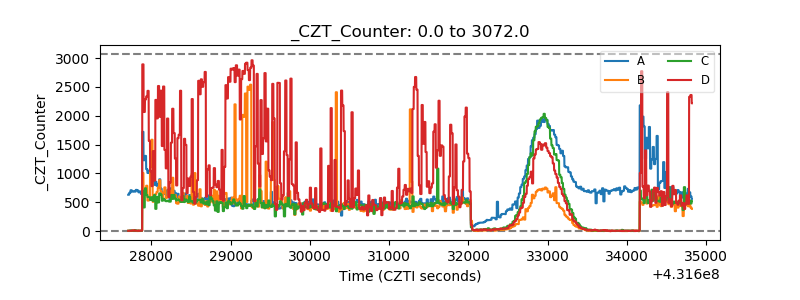 |
| +2.5 Volts monitor | 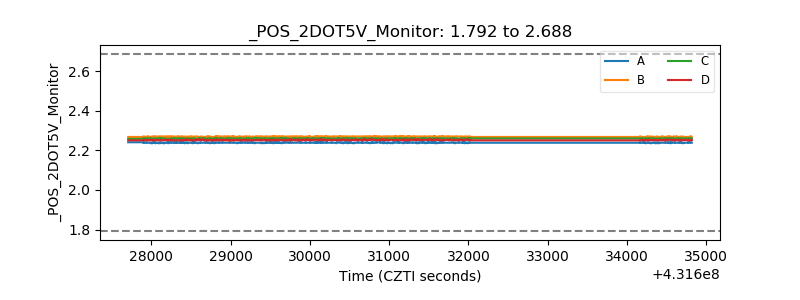 |
| +5 Volts monitor | 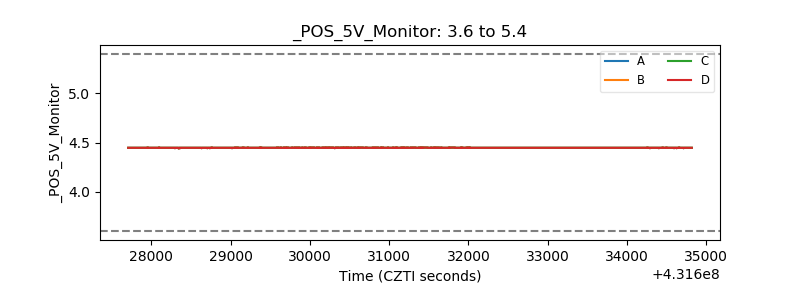 |
| _ROLL_ROT | 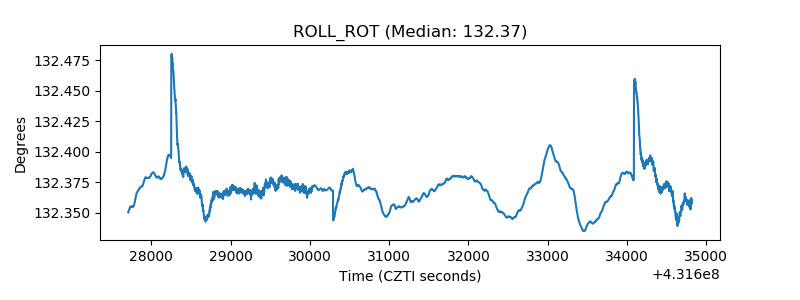 |
| _Roll_DEC | 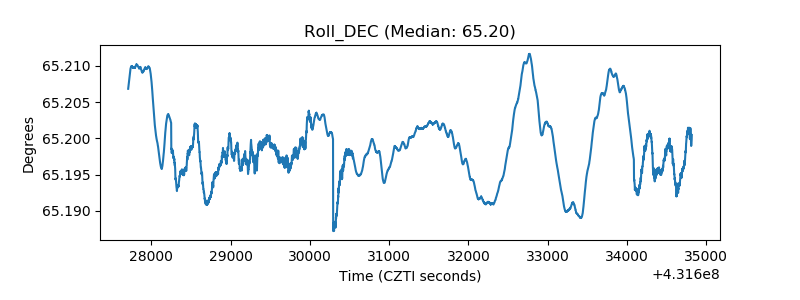 |
| _Roll_RA | 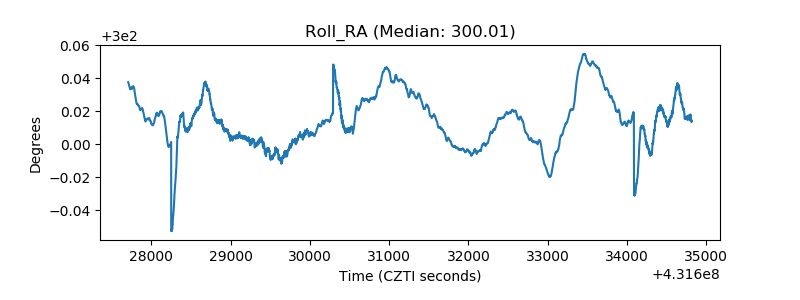 |
| Veto Counter | 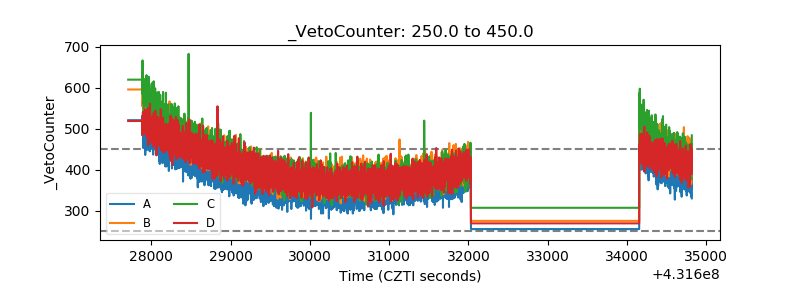 |