| Param | Original file | Final file |
|---|---|---|
| Filename | modeM0/AS1T05_143T01_9000005830_42927cztM0_level2.fits | modeM0/AS1T05_143T01_9000005830_42927cztM0_level2_quad_clean.evt |
| Size (bytes) | 414,648,000 | 83,283,840 |
| Size | 395.4 MB | 79.4 MB |
| Events in quadrant A | 3,188,735 | 581,715 |
| Events in quadrant B | 5,853,254 | 477,613 |
| Events in quadrant C | 2,445,817 | 571,392 |
| Events in quadrant D | 3,441,917 | 514,419 |
| Mode M0 | |||
|---|---|---|---|
| Quadrant | BADHDUFLAG | Total packets | Discarded packets |
| A | 0 | 13041 | 2 |
| B | 0 | 21271 | 2 |
| C | 0 | 10895 | 2 |
| D | 0 | 14273 | 2 |
| Mode M9 | |||
|---|---|---|---|
| Quadrant | BADHDUFLAG | Total packets | Discarded packets |
| A | 0 | 32 | 0 |
| B | 0 | 33 | 0 |
| C | 0 | 33 | 0 |
| D | 0 | 33 | 0 |
| Mode SS | |||
|---|---|---|---|
| Quadrant | BADHDUFLAG | Total packets | Discarded packets |
| A | 0 | 108 | 0 |
| B | 0 | 108 | 0 |
| C | 0 | 108 | 0 |
| D | 0 | 108 | 0 |
| Quadrant | Total seconds | Saturated seconds | Saturation percentage |
|---|---|---|---|
| A | 5384 | 52 | 0.965825% |
| B | 5384 | 1333 | 24.758544% |
| C | 5384 | 7 | 0.130015% |
| D | 5383 | 201 | 3.733977% |
Noise dominated data is calculated using 1-second bins in cleaned event files. If a bin has >2000 counts, and if more than 50% of those come from <1% of pixels, then it is considered to be noise-dominated and hence unusable.
| Quadrant | # 1 sec bins | Bins with >0 counts | Bins with >2000 counts | High rate bins dominated by noise | Noise dominated (total time) | Noise dominated (detector-on time) | Marked lightcurve |
|---|---|---|---|---|---|---|---|
| A | 7027 | 5385 | 40 | 40 | 0.57% | 0.74% | 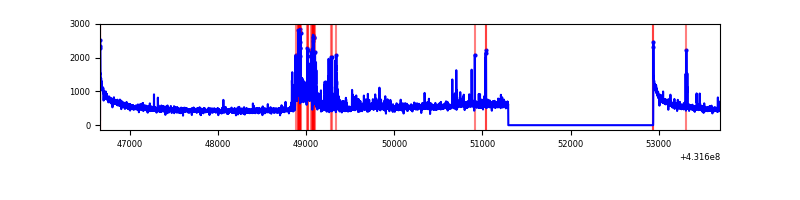 |
| B | 7027 | 5385 | 1065 | 1065 | 15.16% | 19.78% | 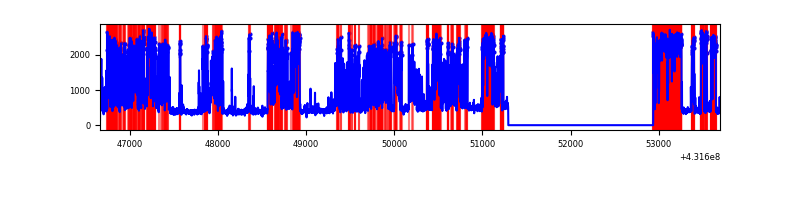 |
| C | 7027 | 5385 | 1 | 1 | 0.01% | 0.02% | 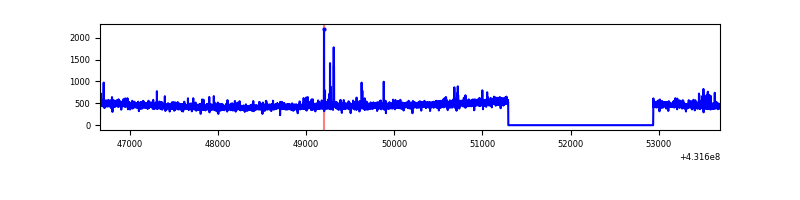 |
| D | 7026 | 5384 | 217 | 217 | 3.09% | 4.03% | 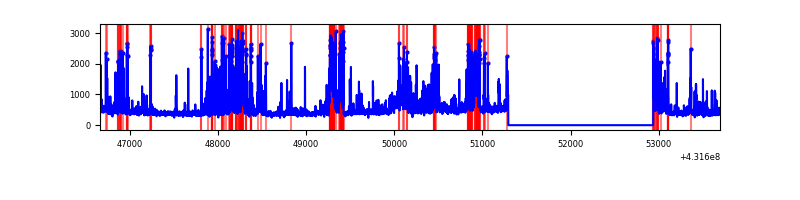 |
Top three noisy pixels from each quadrant. If the there are fewer than three noisy pixels in the level2.evt file, extra rows are filled as -1
| Pixel properties | Quadrant properties | ||||||
|---|---|---|---|---|---|---|---|
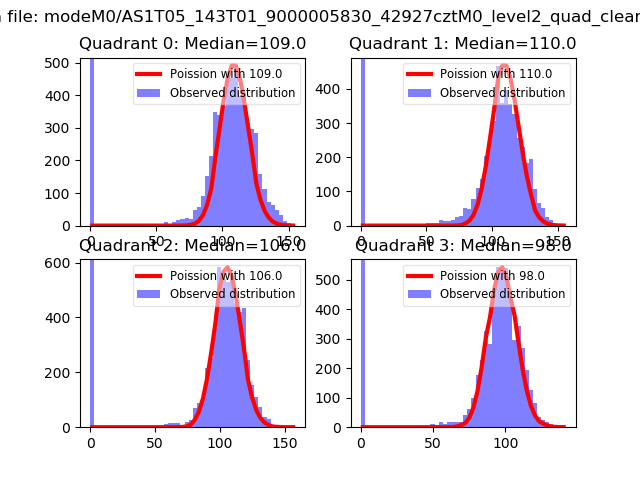
| Quadrant | DetID | PixID | Counts | Sigma | Mean | Median | Sigma |
| A | 10 | 83 | 568140 | 4886.45 | 566 | 556 | 116.2 |
| A | 15 | 222 | 405619 | 3487.27 | 566 | 556 | 116.2 |
| A | 5 | 168 | 19285 | 161.24 | 566 | 556 | 116.2 |
| B | 4 | 81 | 3723874 | 38202.17 | 505 | 492 | 97.5 |
| B | 0 | 229 | 44445 | 450.96 | 505 | 492 | 97.5 |
| B | 5 | 172 | 32796 | 331.44 | 505 | 492 | 97.5 |
| C | 15 | 214 | 220467 | 1686.67 | 557 | 560 | 130.4 |
| C | 12 | 249 | 23132 | 173.13 | 557 | 560 | 130.4 |
| C | 15 | 143 | 21703 | 162.17 | 557 | 560 | 130.4 |
| D | 12 | 6 | 505697 | 3761.61 | 544 | 527 | 134.3 |
| D | 2 | 249 | 273227 | 2030.59 | 544 | 527 | 134.3 |
| D | 12 | 233 | 170948 | 1268.99 | 544 | 527 | 134.3 |
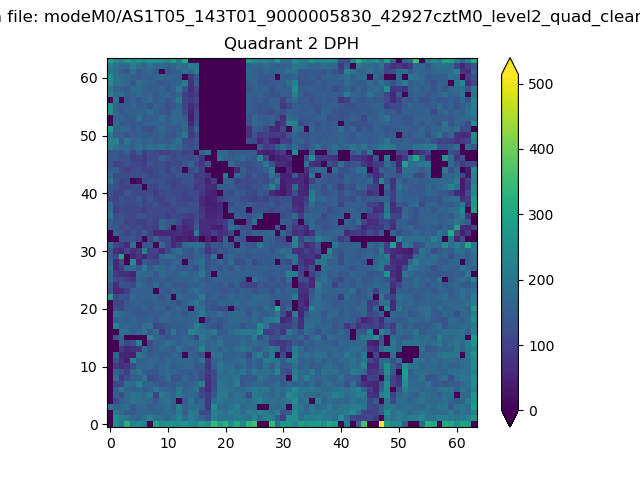
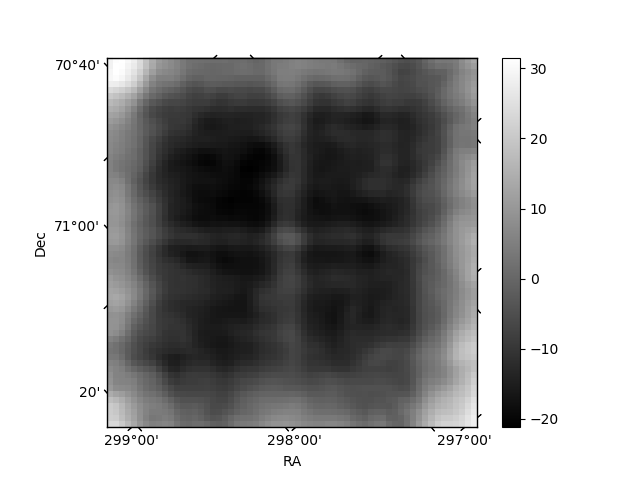
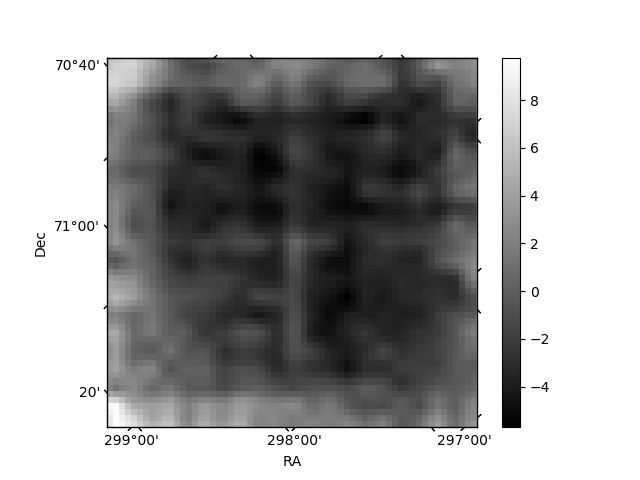
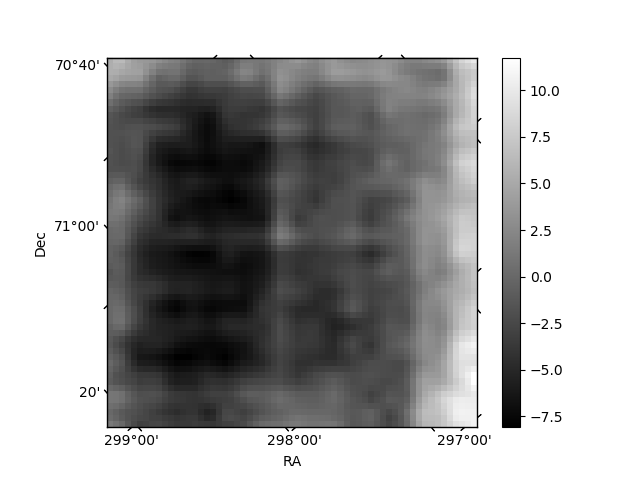
Histogram calculated using DETX and DETY for each event in the final _common_clean file
| Quadrant A | 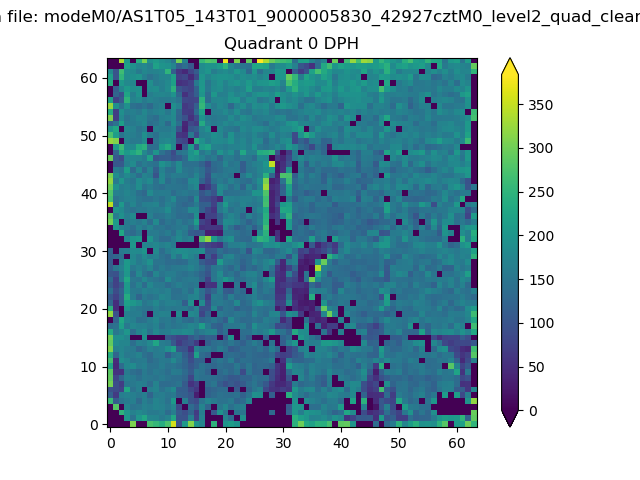 |
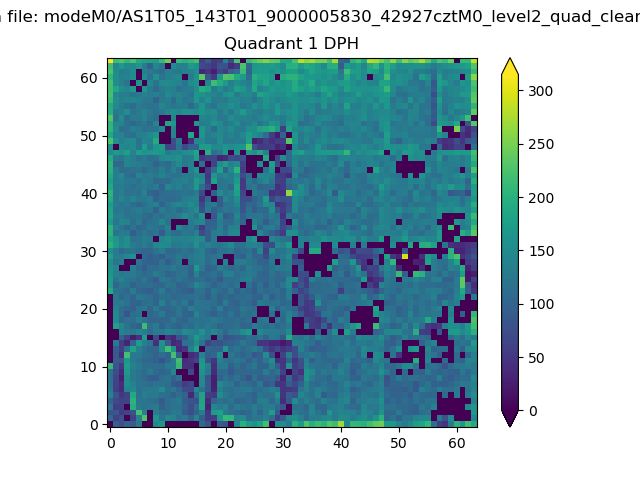 |
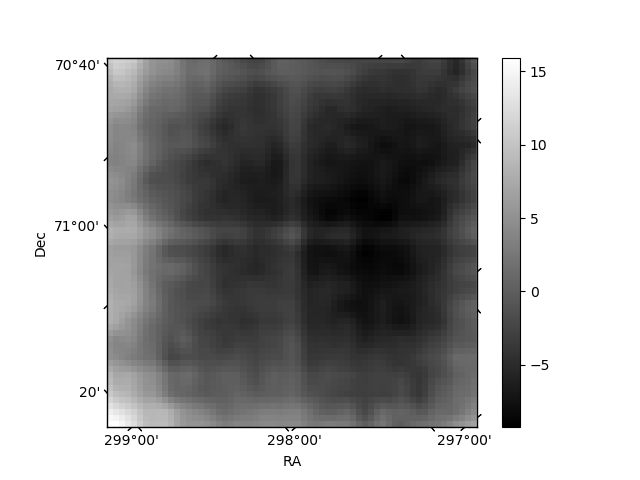
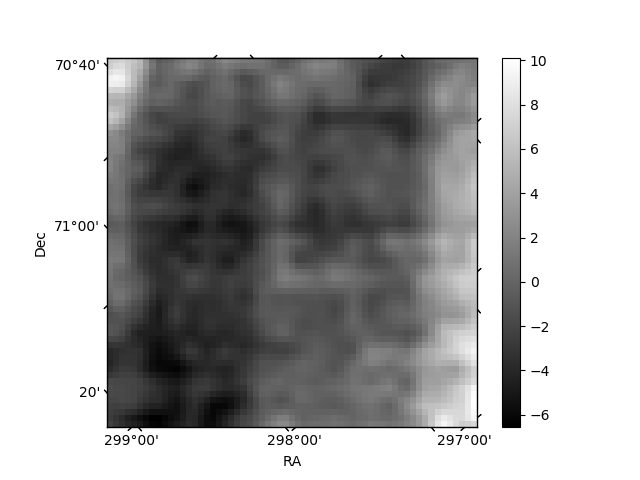
Quadrant B |
|---|---|---|---|
| Quadrant D | 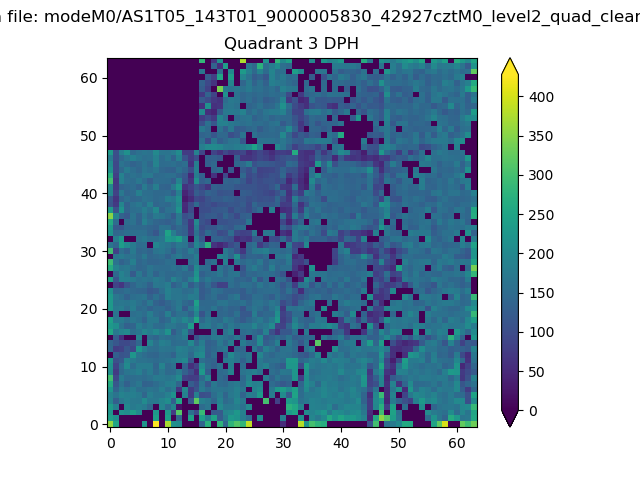 |
 |
Quadrant C |
| Plot type | Count rate plots | Images |
|---|---|---|
| Comparison with Poisson distribution Blue bars denote a histogram of data divided into 1 sec bins. Red curve is a Poisson curve with rate = median count rate of data. |
 |
 |
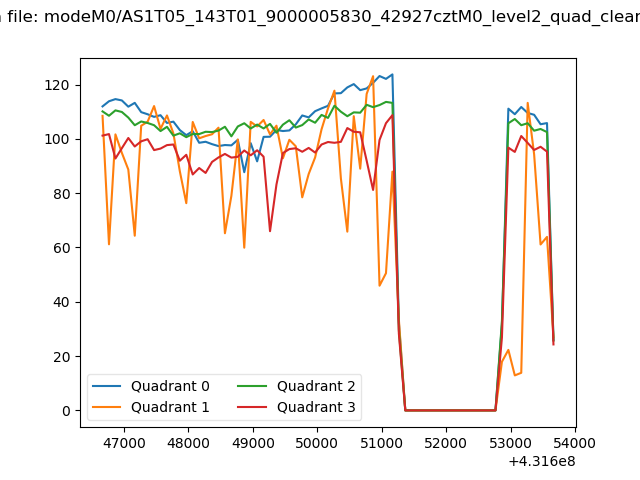
| Quadrant-wise count rates Data is divided into 100 sec bins |
 |
|
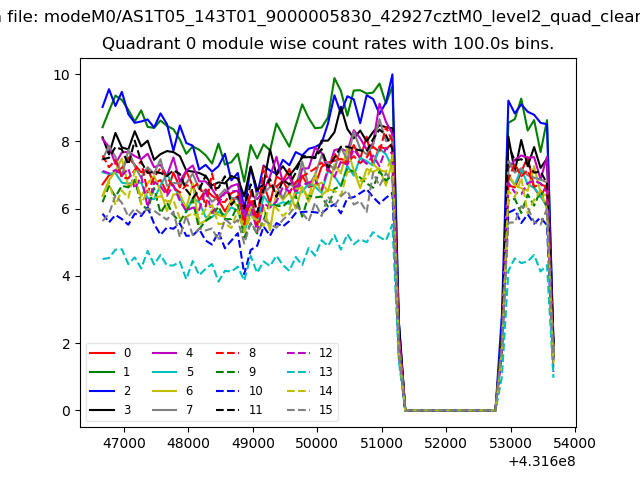
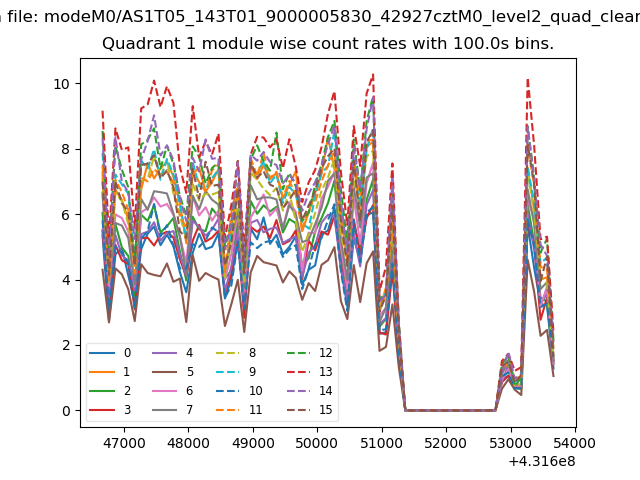
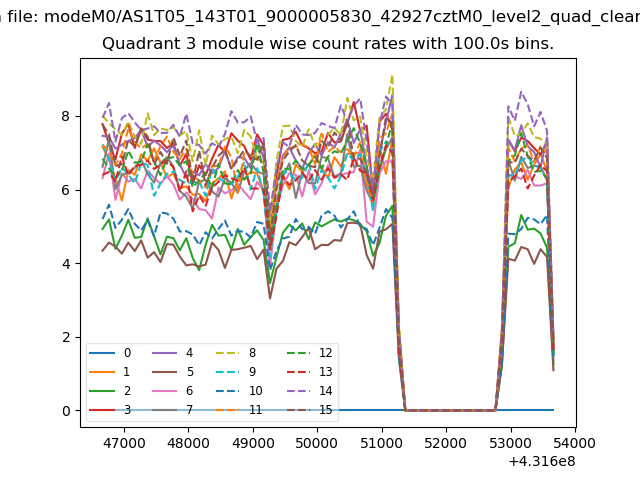
| Module-wise count rates for Quadrant A Data is divided into 100 sec bins |
 |
 |
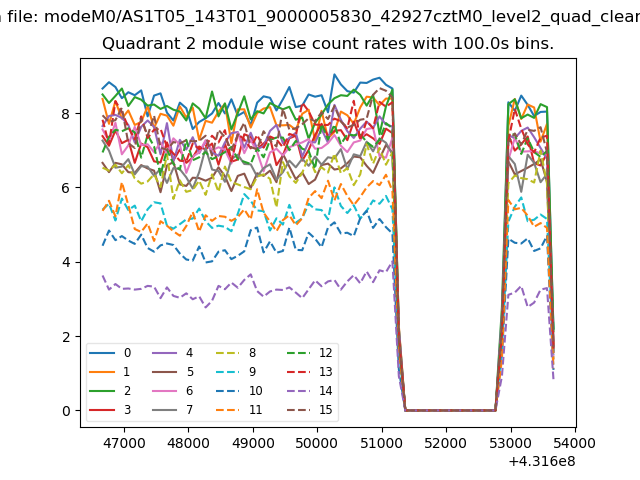
| Module-wise count rates for Quadrant B Data is divided into 100 sec bins |
 |
 |
| Module-wise count rates for Quadrant C Data is divided into 100 sec bins |
 |
 |
| Module-wise count rates for Quadrant D Data is divided into 100 sec bins |
 |
 |
| Parameter | Plot |
|---|---|
| CZT HV Monitor | 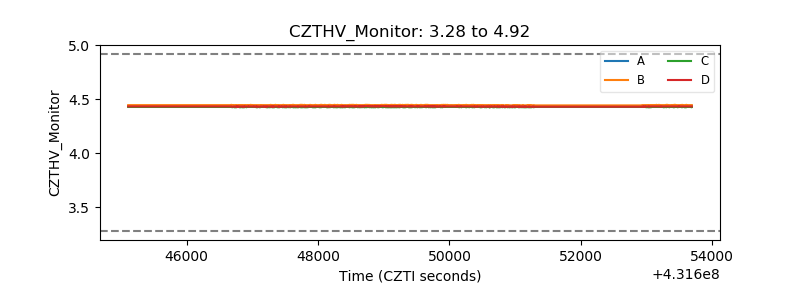 |
| D_VDD | 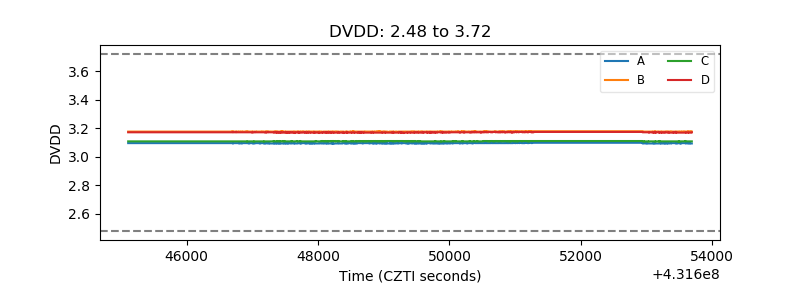 |
| Temperature 1 | 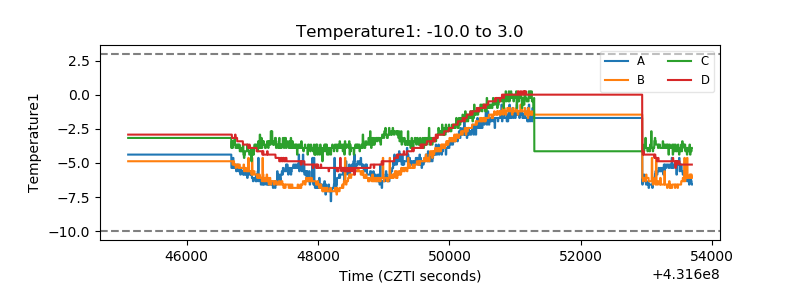 |
| Veto HV Monitor | 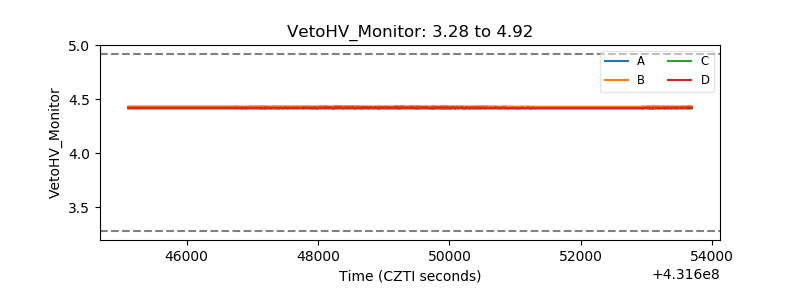 |
| Veto LLD | 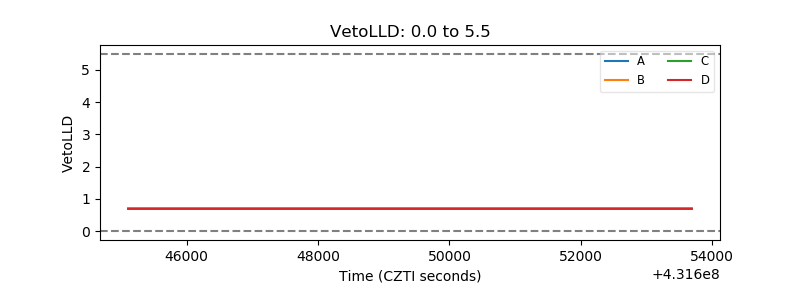 |
| Alpha Counter | 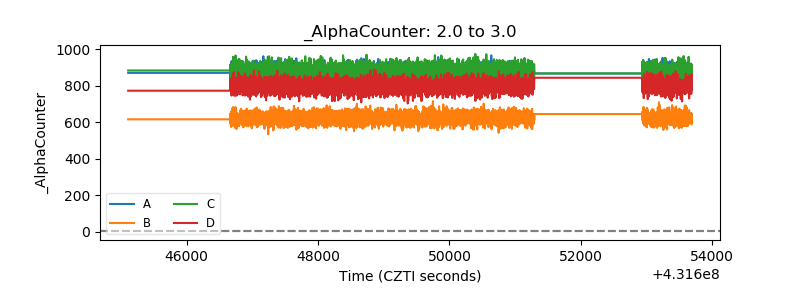 |
| _CPM_Rate | 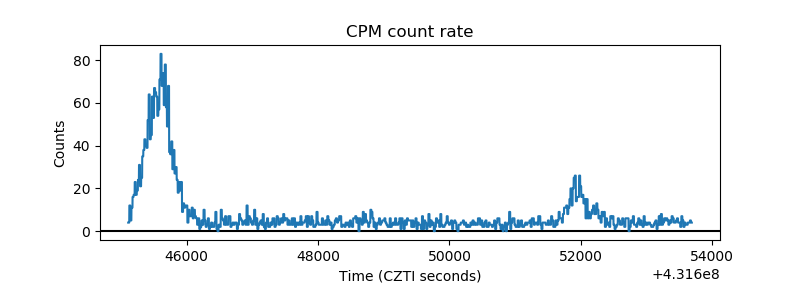 |
| CZT Counter | 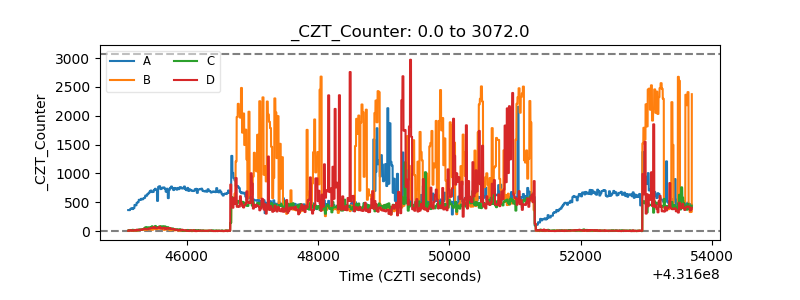 |
| +2.5 Volts monitor | 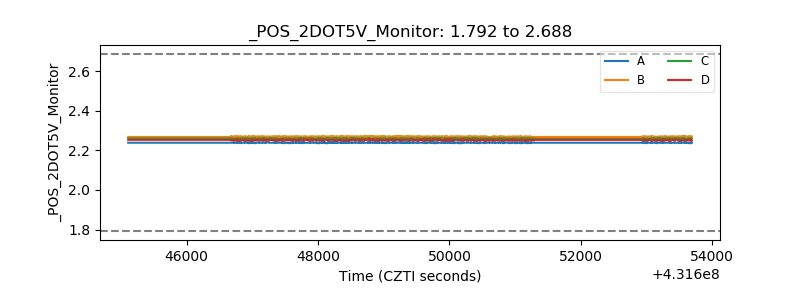 |
| +5 Volts monitor | 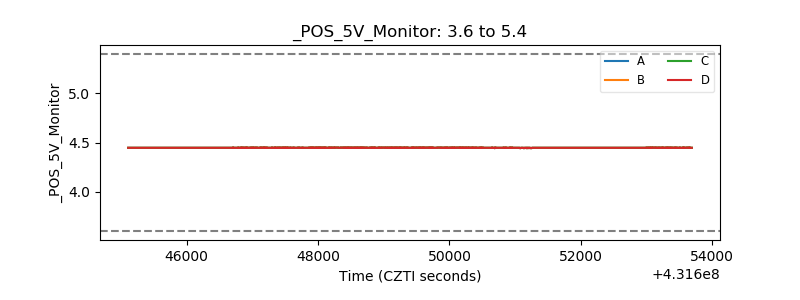 |
| _ROLL_ROT | 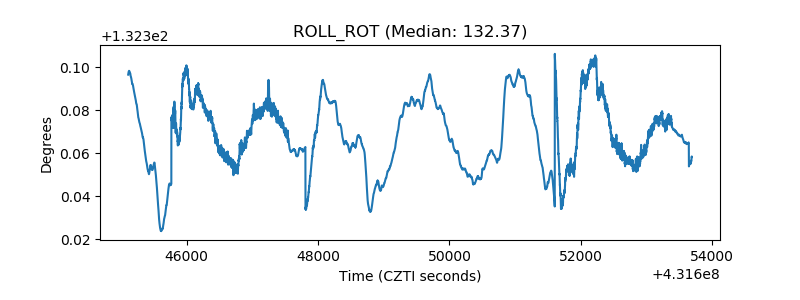 |
| _Roll_DEC | 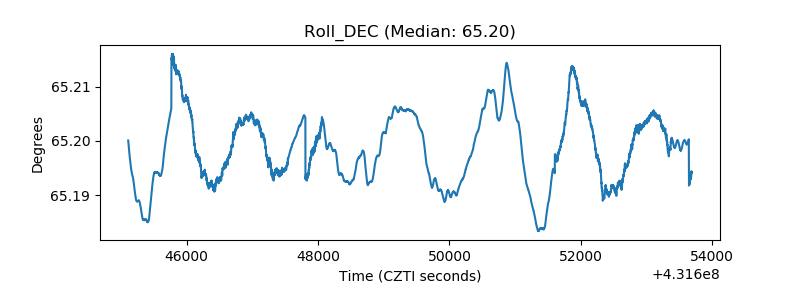 |
| _Roll_RA | 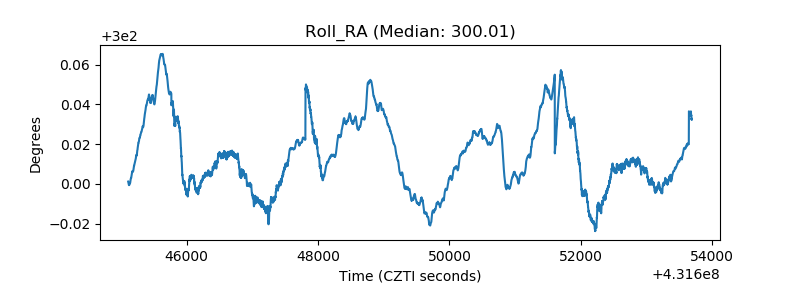 |
| Veto Counter | 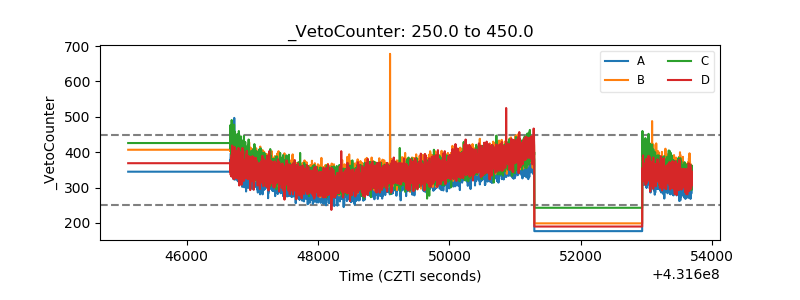 |