| Param | Original file | Final file |
|---|---|---|
| Filename | modeM0/AS1T05_143T01_9000005830_42928cztM0_level2.fits | modeM0/AS1T05_143T01_9000005830_42928cztM0_level2_quad_clean.evt |
| Size (bytes) | 499,129,920 | 87,963,840 |
| Size | 476.0 MB | 83.9 MB |
| Events in quadrant A | 3,391,047 | 648,133 |
| Events in quadrant B | 8,084,293 | 385,741 |
| Events in quadrant C | 2,777,680 | 637,127 |
| Events in quadrant D | 3,752,473 | 570,102 |
| Mode M0 | |||
|---|---|---|---|
| Quadrant | BADHDUFLAG | Total packets | Discarded packets |
| A | 0 | 13956 | 2 |
| B | 0 | 28310 | 2 |
| C | 0 | 12293 | 2 |
| D | 0 | 15712 | 2 |
| Mode M9 | |||
|---|---|---|---|
| Quadrant | BADHDUFLAG | Total packets | Discarded packets |
| A | 0 | 30 | 0 |
| B | 0 | 30 | 0 |
| C | 0 | 30 | 0 |
| D | 0 | 30 | 0 |
| Mode SS | |||
|---|---|---|---|
| Quadrant | BADHDUFLAG | Total packets | Discarded packets |
| A | 0 | 126 | 0 |
| B | 0 | 126 | 0 |
| C | 0 | 126 | 0 |
| D | 0 | 126 | 0 |
| Quadrant | Total seconds | Saturated seconds | Saturation percentage |
|---|---|---|---|
| A | 6042 | 27 | 0.446872% |
| B | 6043 | 2604 | 43.091180% |
| C | 6043 | 6 | 0.099288% |
| D | 6043 | 261 | 4.319047% |
Noise dominated data is calculated using 1-second bins in cleaned event files. If a bin has >2000 counts, and if more than 50% of those come from <1% of pixels, then it is considered to be noise-dominated and hence unusable.
| Quadrant | # 1 sec bins | Bins with >0 counts | Bins with >2000 counts | High rate bins dominated by noise | Noise dominated (total time) | Noise dominated (detector-on time) | Marked lightcurve |
|---|---|---|---|---|---|---|---|
| A | 9057 | 6044 | 18 | 18 | 0.20% | 0.30% | 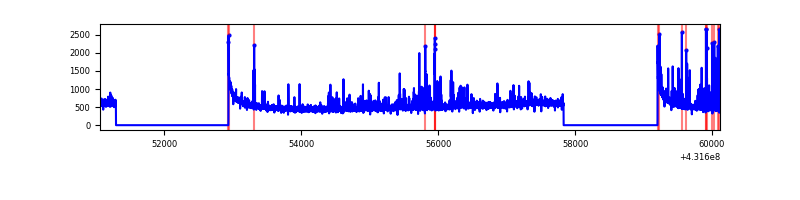 |
| B | 9058 | 6044 | 2402 | 2402 | 26.52% | 39.74% | 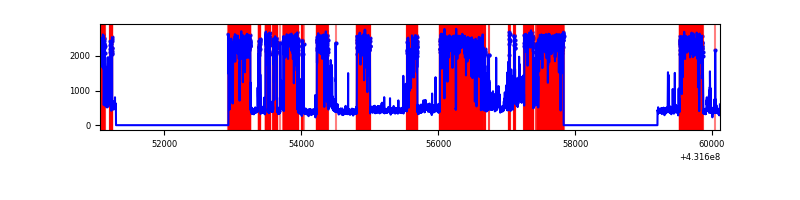 |
| C | 9058 | 6045 | 3 | 3 | 0.03% | 0.05% | 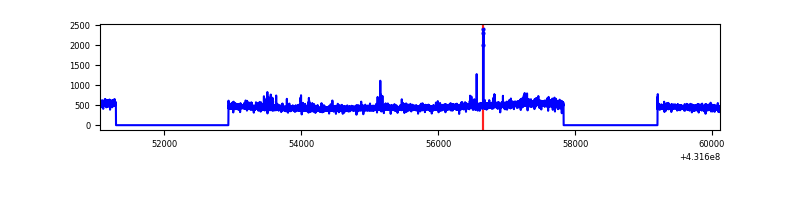 |
| D | 9058 | 6045 | 253 | 253 | 2.79% | 4.19% | 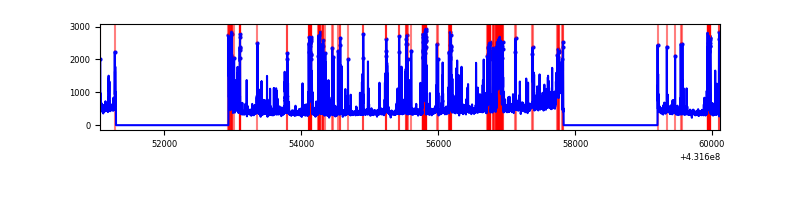 |
Top three noisy pixels from each quadrant. If the there are fewer than three noisy pixels in the level2.evt file, extra rows are filled as -1
| Pixel properties | Quadrant properties | ||||||
|---|---|---|---|---|---|---|---|
| Quadrant | DetID | PixID | Counts | Sigma | Mean | Median | Sigma |
| A | 10 | 83 | 625323 | 4698.12 | 646 | 632 | 133.0 |
| A | 15 | 222 | 226800 | 1700.94 | 646 | 632 | 133.0 |
| A | 5 | 168 | 18546 | 134.73 | 646 | 632 | 133.0 |
| B | 4 | 81 | 5974024 | 63742.64 | 483 | 469 | 93.7 |
| B | 0 | 229 | 64853 | 687.03 | 483 | 469 | 93.7 |
| B | 4 | 171 | 44223 | 466.89 | 483 | 469 | 93.7 |
| C | 15 | 214 | 260768 | 1759.84 | 633 | 636 | 147.8 |
| C | 15 | 143 | 18793 | 122.84 | 633 | 636 | 147.8 |
| C | 12 | 249 | 15571 | 101.04 | 633 | 636 | 147.8 |
| D | 2 | 249 | 692008 | 4538.84 | 620 | 602 | 152.3 |
| D | 12 | 6 | 227643 | 1490.44 | 620 | 602 | 152.3 |
| D | 1 | 47 | 109688 | 716.11 | 620 | 602 | 152.3 |
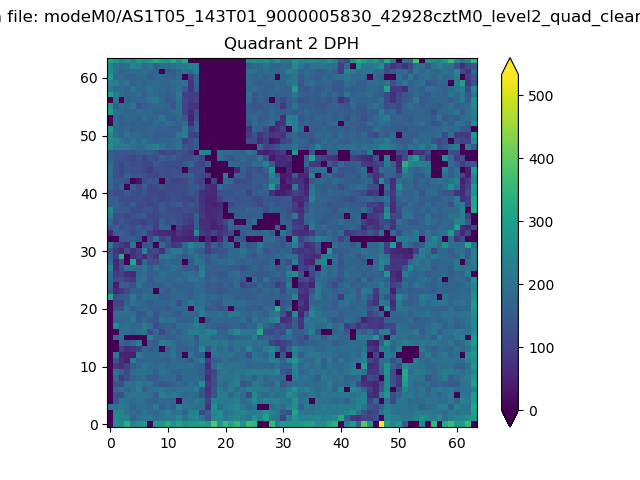
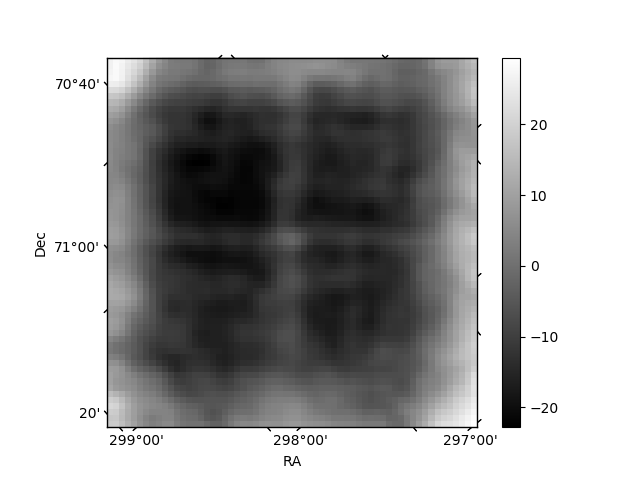
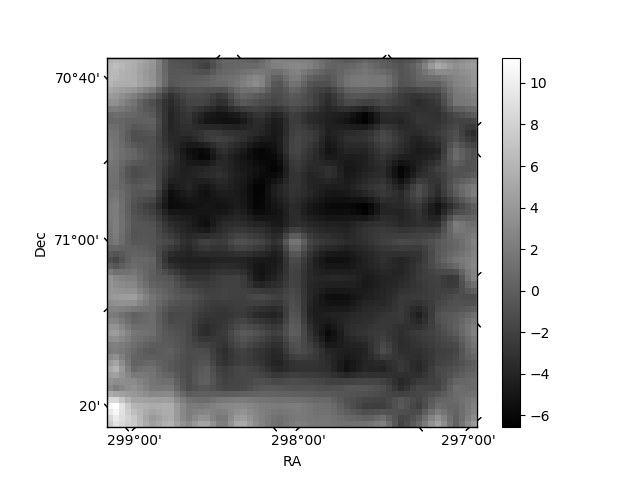
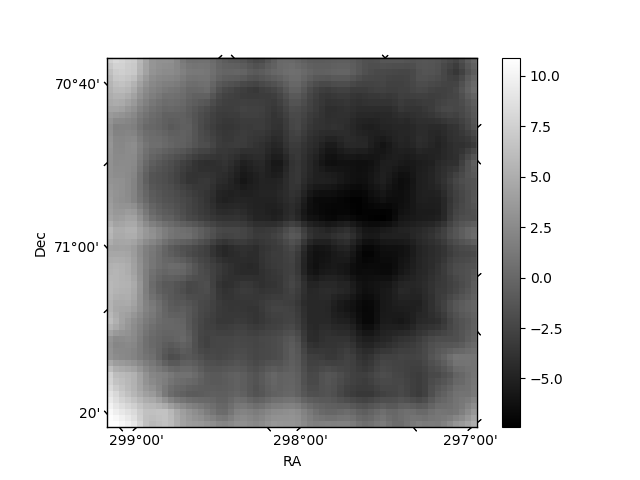
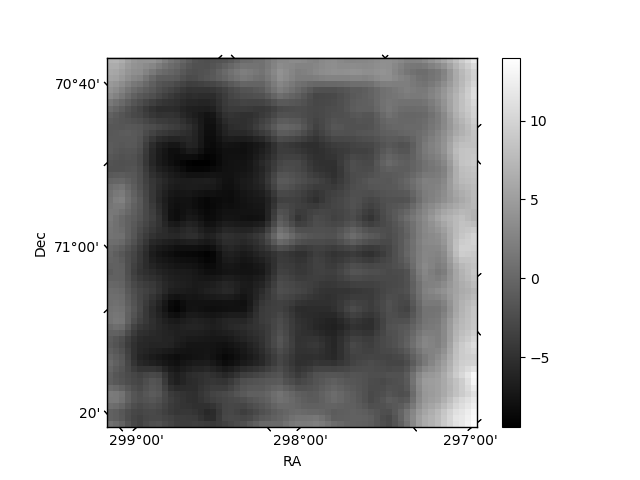
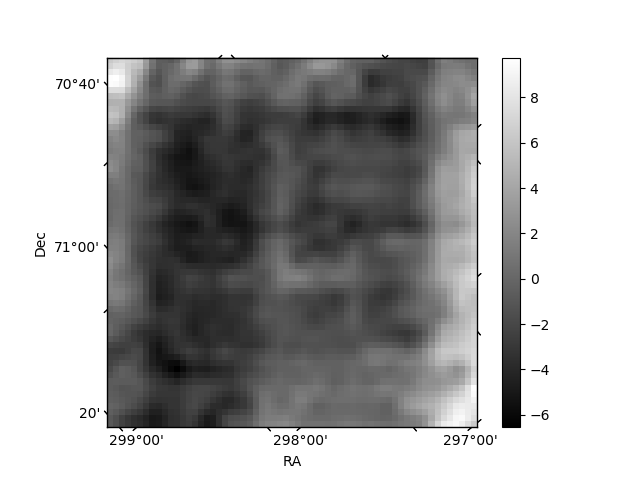
Histogram calculated using DETX and DETY for each event in the final _common_clean file
| Quadrant A | 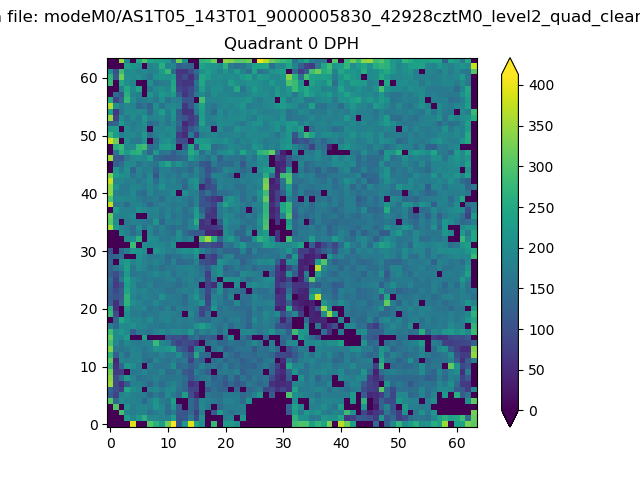 |
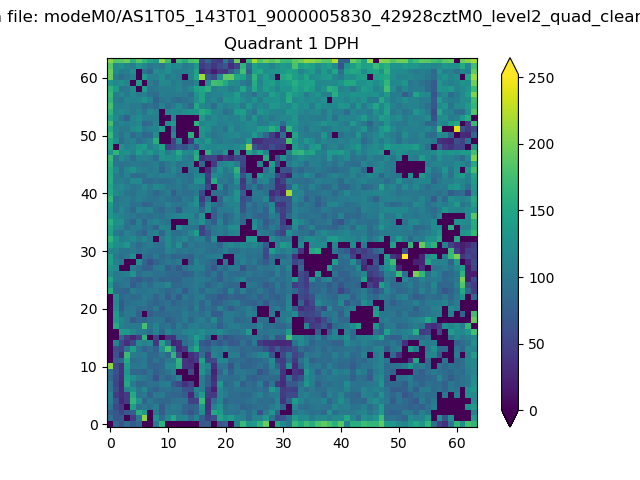 |
Quadrant B |
|---|---|---|---|
| Quadrant D | 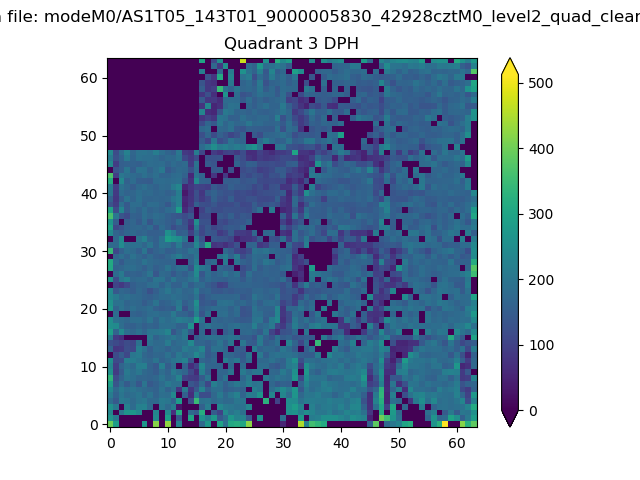 |
 |
Quadrant C |
| Plot type | Count rate plots | Images |
|---|---|---|
| Comparison with Poisson distribution Blue bars denote a histogram of data divided into 1 sec bins. Red curve is a Poisson curve with rate = median count rate of data. |
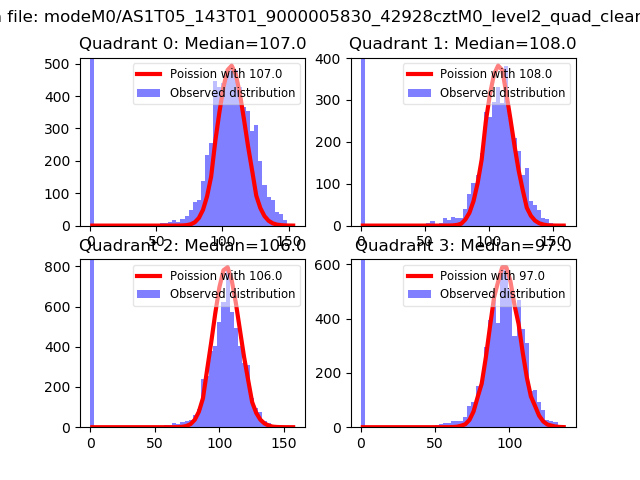 |
 |
| Quadrant-wise count rates Data is divided into 100 sec bins |
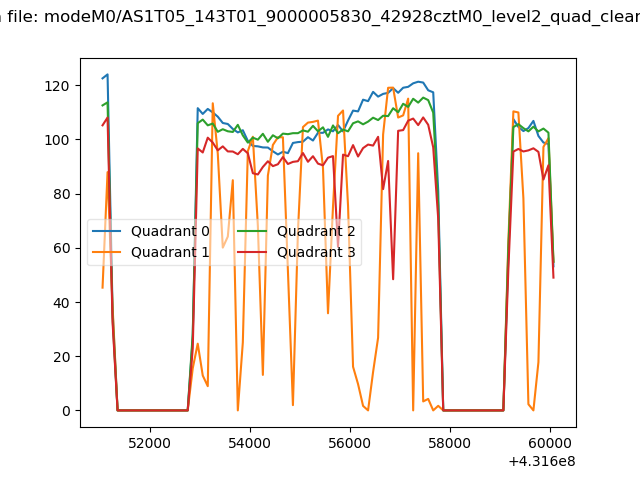 |
|
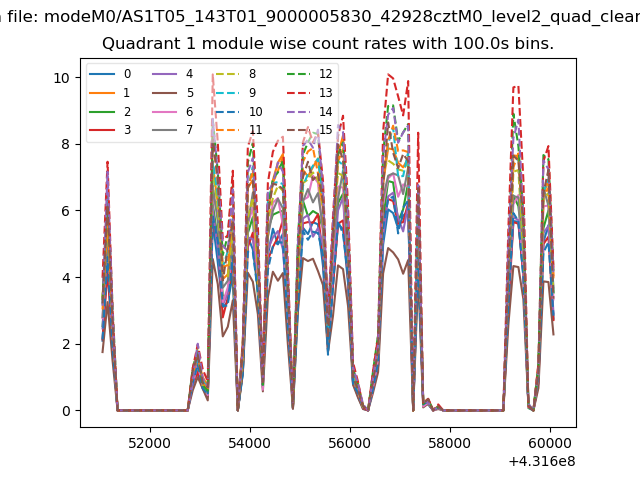
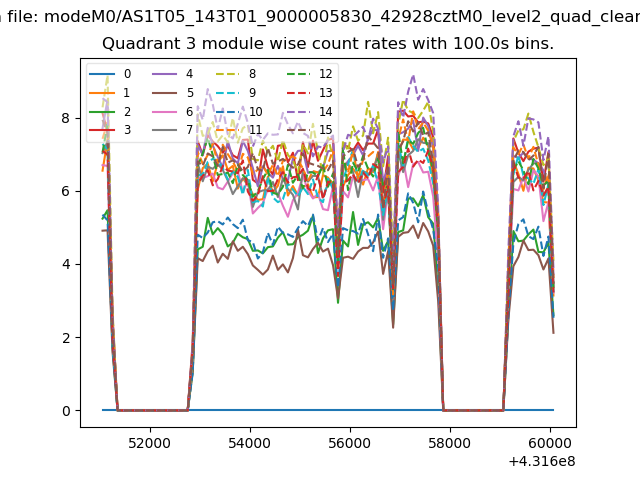
| Module-wise count rates for Quadrant A Data is divided into 100 sec bins |
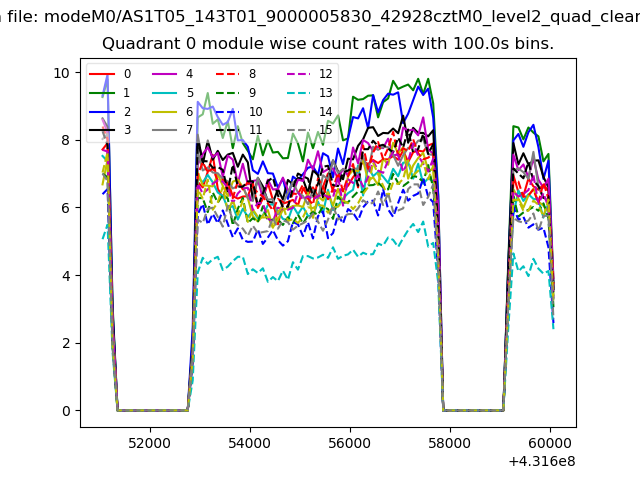 |
 |
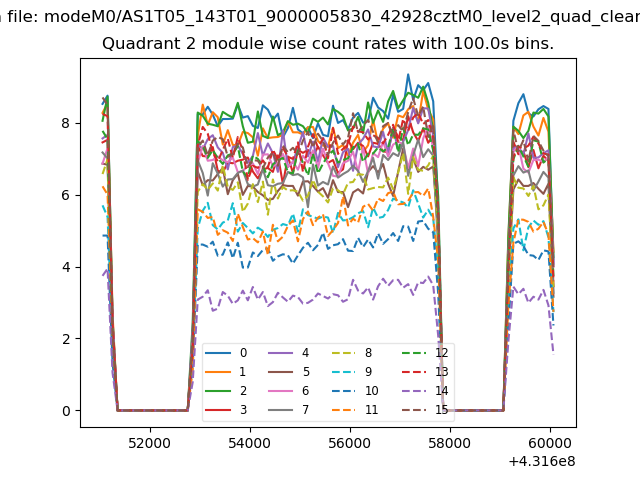
| Module-wise count rates for Quadrant B Data is divided into 100 sec bins |
 |
 |
| Module-wise count rates for Quadrant C Data is divided into 100 sec bins |
 |
 |
| Module-wise count rates for Quadrant D Data is divided into 100 sec bins |
 |
 |
| Parameter | Plot |
|---|---|
| CZT HV Monitor | 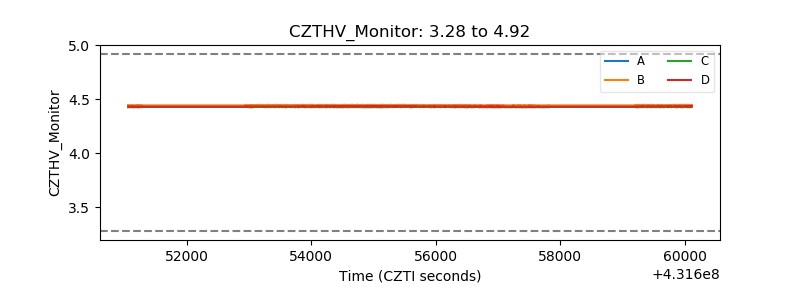 |
| D_VDD | 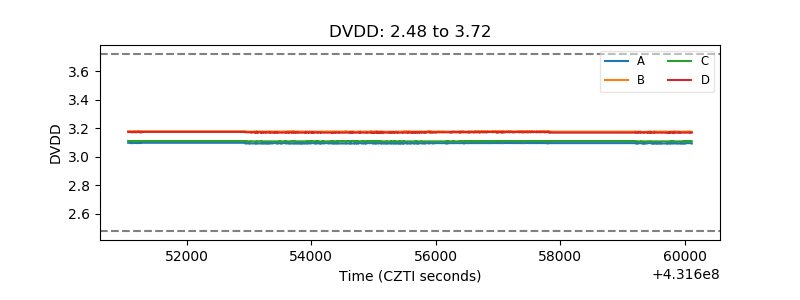 |
| Temperature 1 | 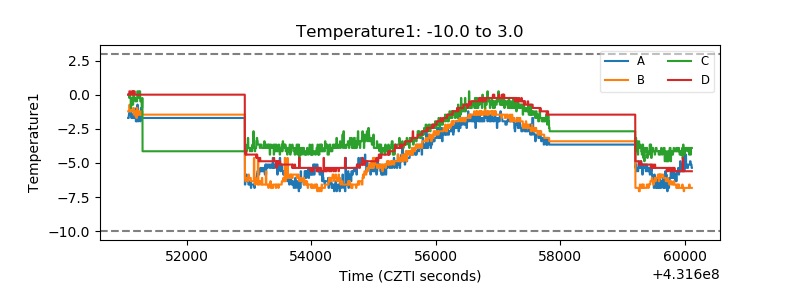 |
| Veto HV Monitor | 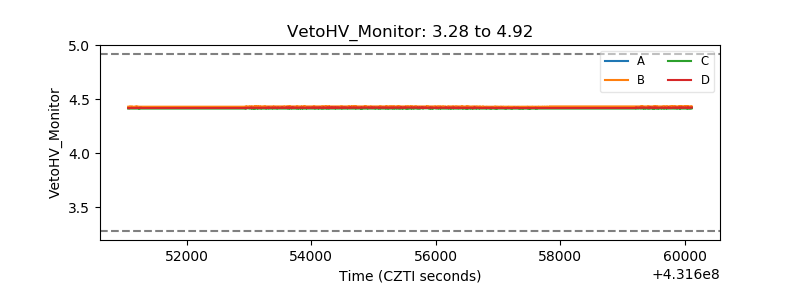 |
| Veto LLD | 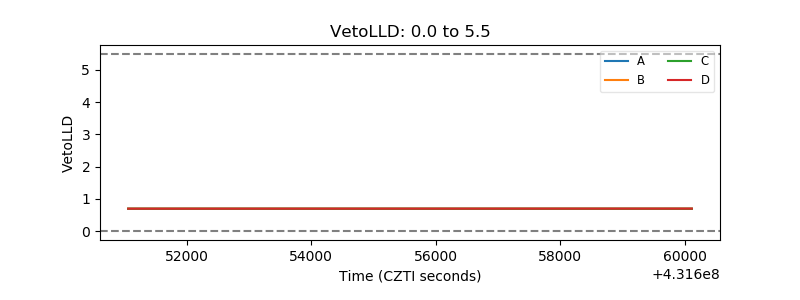 |
| Alpha Counter | 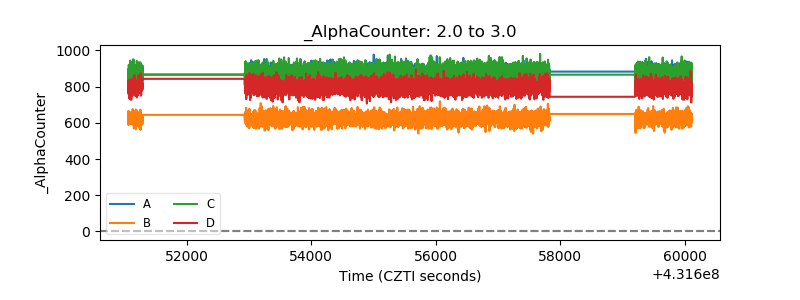 |
| _CPM_Rate | 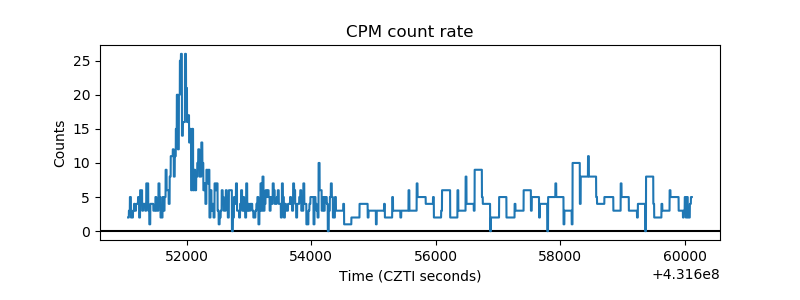 |
| CZT Counter | 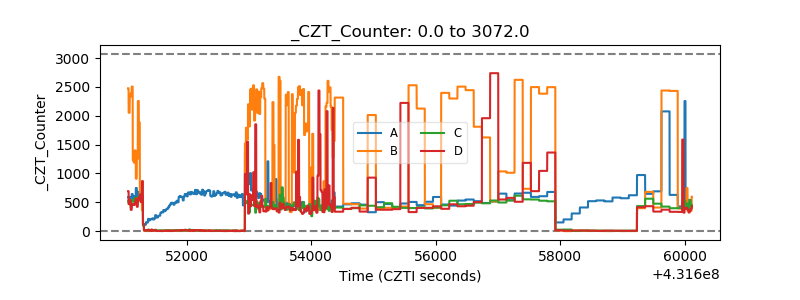 |
| +2.5 Volts monitor | 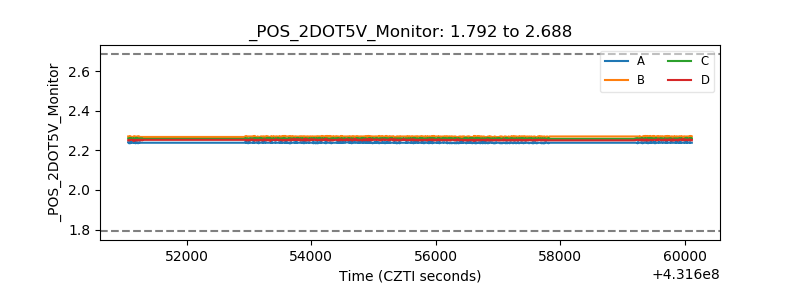 |
| +5 Volts monitor | 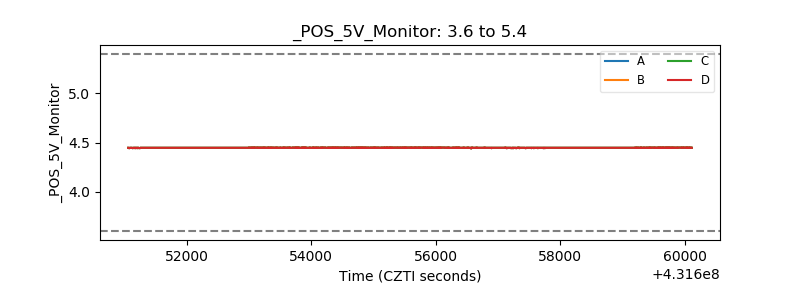 |
| _ROLL_ROT | 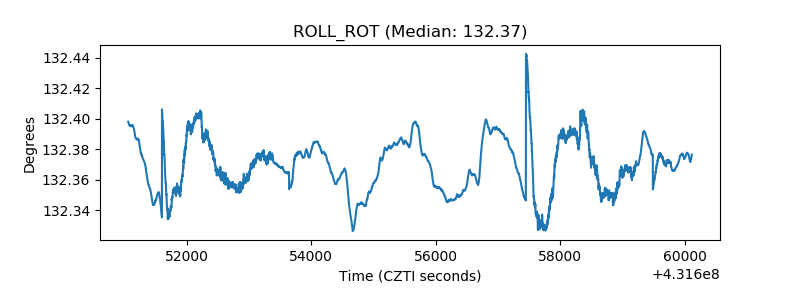 |
| _Roll_DEC | 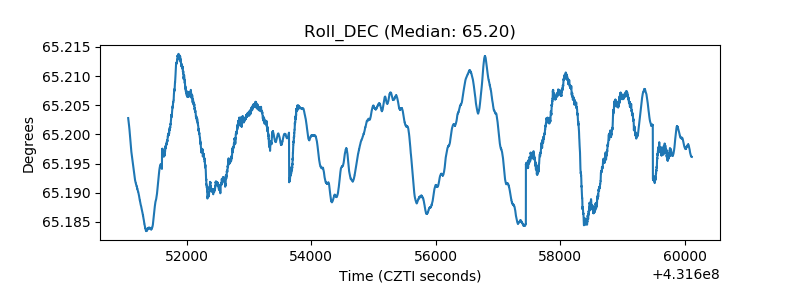 |
| _Roll_RA | 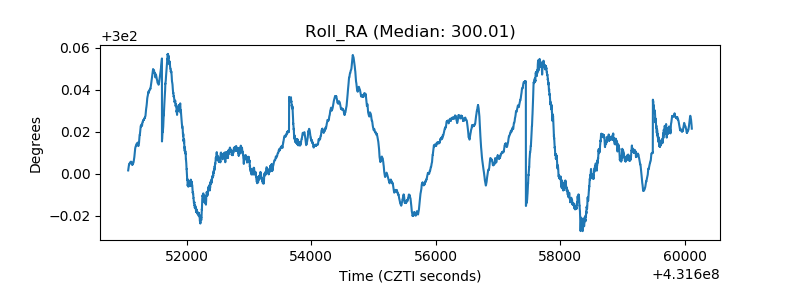 |
| Veto Counter | 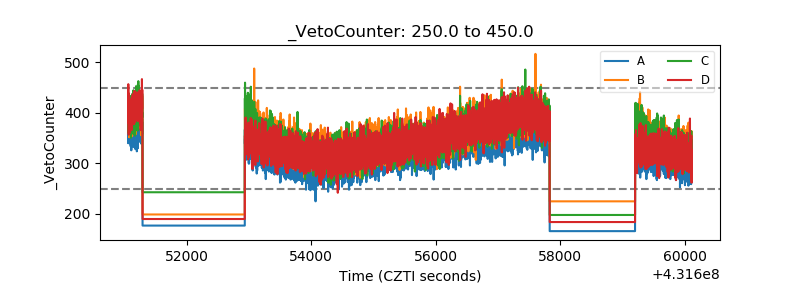 |