| Param | Original file | Final file |
|---|---|---|
| Filename | modeM0/AS1T05_143T01_9000005830_42929cztM0_level2.fits | modeM0/AS1T05_143T01_9000005830_42929cztM0_level2_quad_clean.evt |
| Size (bytes) | 544,455,360 | 81,443,520 |
| Size | 519.2 MB | 77.7 MB |
| Events in quadrant A | 3,300,440 | 628,890 |
| Events in quadrant B | 9,544,351 | 263,099 |
| Events in quadrant C | 2,795,824 | 619,690 |
| Events in quadrant D | 4,051,242 | 539,386 |
| Mode M0 | |||
|---|---|---|---|
| Quadrant | BADHDUFLAG | Total packets | Discarded packets |
| A | 0 | 13380 | 2 |
| B | 0 | 32578 | 3 |
| C | 0 | 12190 | 2 |
| D | 0 | 16455 | 2 |
| Mode M9 | |||
|---|---|---|---|
| Quadrant | BADHDUFLAG | Total packets | Discarded packets |
| A | 0 | 24 | 0 |
| B | 0 | 25 | 0 |
| C | 0 | 25 | 0 |
| D | 0 | 25 | 0 |
| Mode SS | |||
|---|---|---|---|
| Quadrant | BADHDUFLAG | Total packets | Discarded packets |
| A | 0 | 122 | 0 |
| B | 0 | 122 | 0 |
| C | 0 | 122 | 0 |
| D | 0 | 122 | 0 |
| Quadrant | Total seconds | Saturated seconds | Saturation percentage |
|---|---|---|---|
| A | 5932 | 26 | 0.438301% |
| B | 5931 | 3528 | 59.484067% |
| C | 5931 | 5 | 0.084303% |
| D | 5931 | 410 | 6.912831% |
Noise dominated data is calculated using 1-second bins in cleaned event files. If a bin has >2000 counts, and if more than 50% of those come from <1% of pixels, then it is considered to be noise-dominated and hence unusable.
| Quadrant | # 1 sec bins | Bins with >0 counts | Bins with >2000 counts | High rate bins dominated by noise | Noise dominated (total time) | Noise dominated (detector-on time) | Marked lightcurve |
|---|---|---|---|---|---|---|---|
| A | 7245 | 5933 | 17 | 17 | 0.23% | 0.29% | 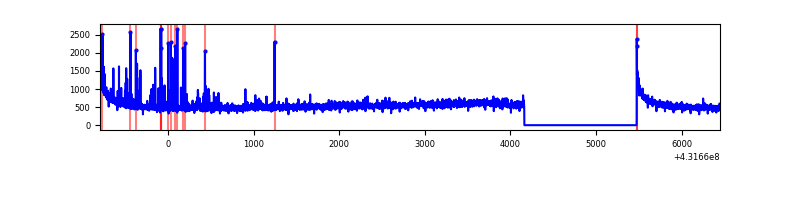 |
| B | 7244 | 5931 | 3312 | 3312 | 45.72% | 55.84% | 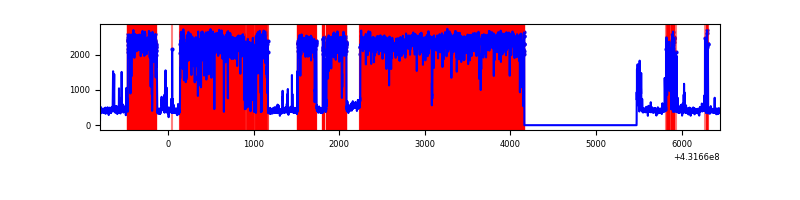 |
| C | 7244 | 5932 | 2 | 2 | 0.03% | 0.03% | 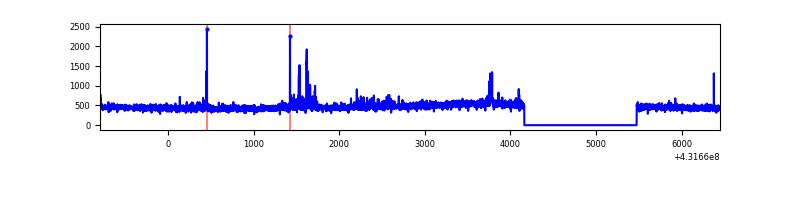 |
| D | 7244 | 5932 | 376 | 376 | 5.19% | 6.34% | 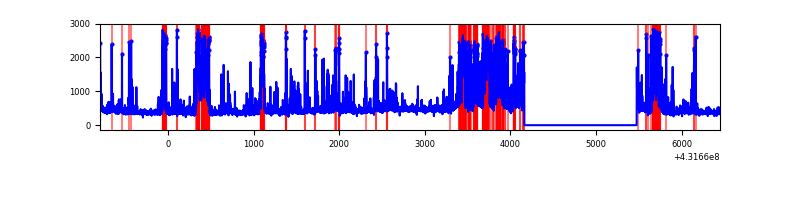 |
Top three noisy pixels from each quadrant. If the there are fewer than three noisy pixels in the level2.evt file, extra rows are filled as -1
| Pixel properties | Quadrant properties | ||||||
|---|---|---|---|---|---|---|---|
| Quadrant | DetID | PixID | Counts | Sigma | Mean | Median | Sigma |
| A | 10 | 83 | 633937 | 4819.46 | 634 | 619 | 131.4 |
| A | 15 | 222 | 192390 | 1459.35 | 634 | 619 | 131.4 |
| A | 13 | 248 | 13230 | 95.97 | 634 | 619 | 131.4 |
| B | 4 | 81 | 7859057 | 103015.83 | 388 | 377 | 76.3 |
| B | 5 | 172 | 52387 | 681.78 | 388 | 377 | 76.3 |
| B | 3 | 112 | 33740 | 437.34 | 388 | 377 | 76.3 |
| C | 15 | 214 | 260044 | 1785.13 | 622 | 626 | 145.3 |
| C | 14 | 254 | 66398 | 452.6 | 622 | 626 | 145.3 |
| C | 12 | 249 | 16767 | 111.07 | 622 | 626 | 145.3 |
| D | 10 | 118 | 589966 | 4004.98 | 600 | 583 | 147.2 |
| D | 12 | 6 | 465749 | 3160.9 | 600 | 583 | 147.2 |
| D | 2 | 249 | 285133 | 1933.58 | 600 | 583 | 147.2 |
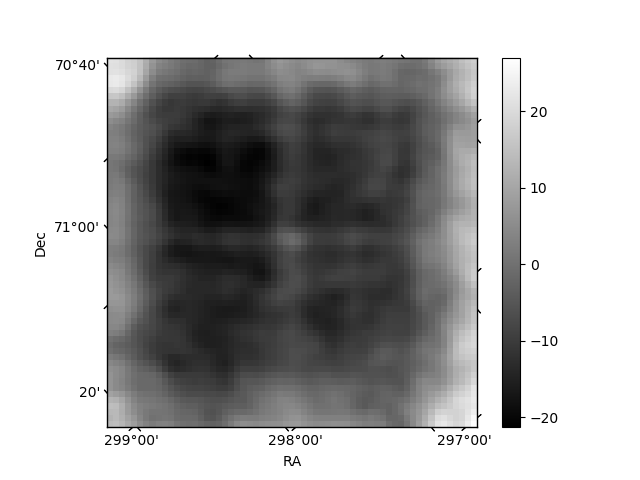
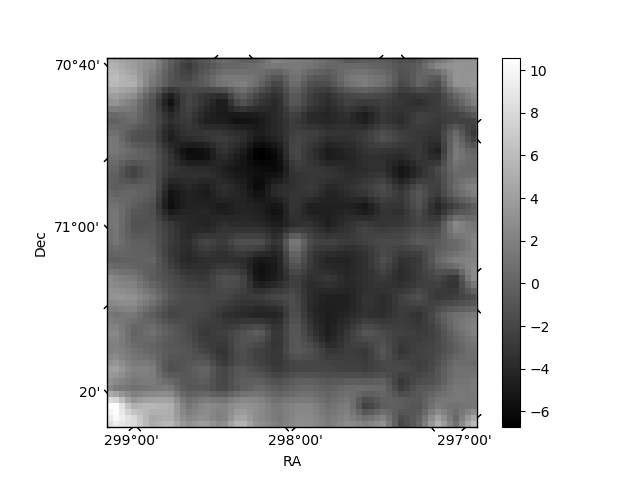
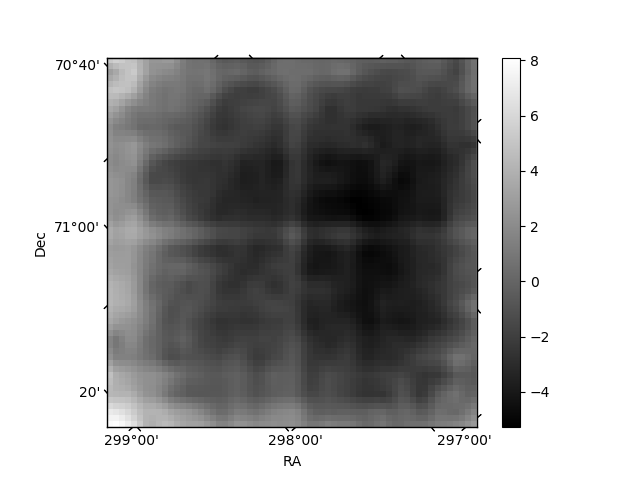
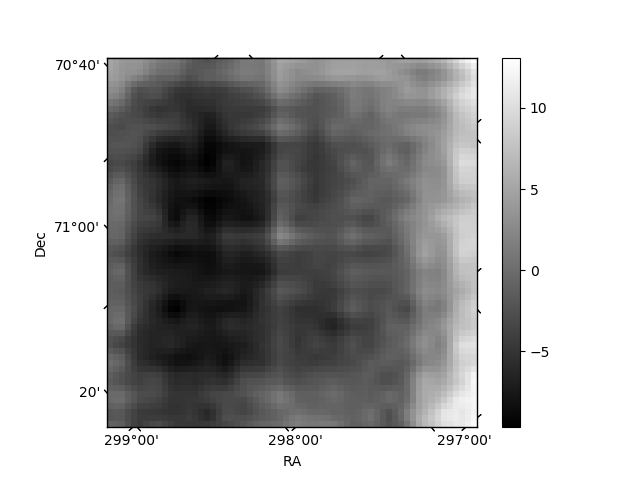
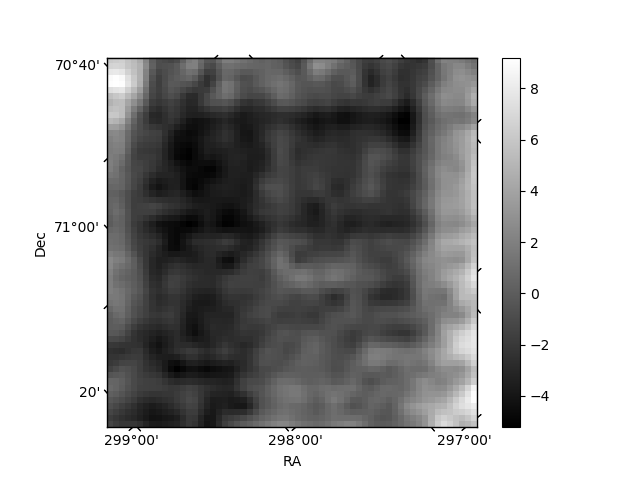
Histogram calculated using DETX and DETY for each event in the final _common_clean file
| Quadrant A | 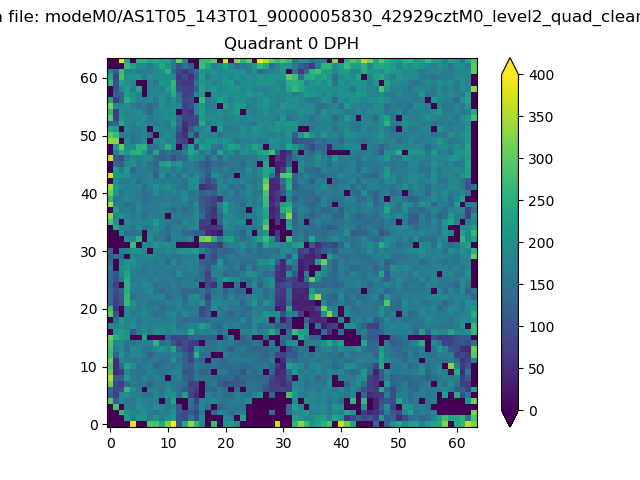 |
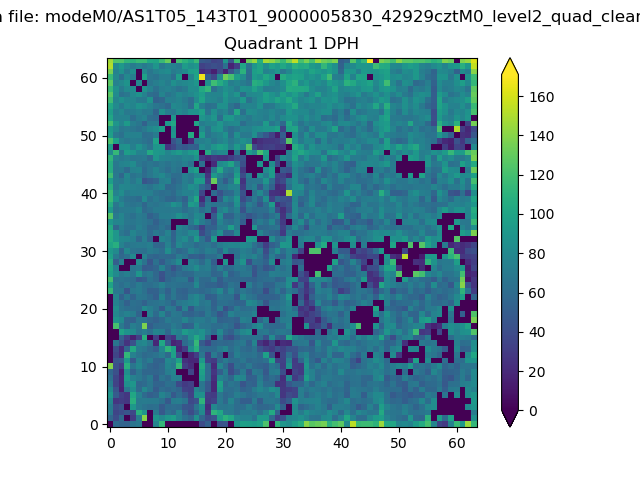 |
Quadrant B |
|---|---|---|---|
| Quadrant D | 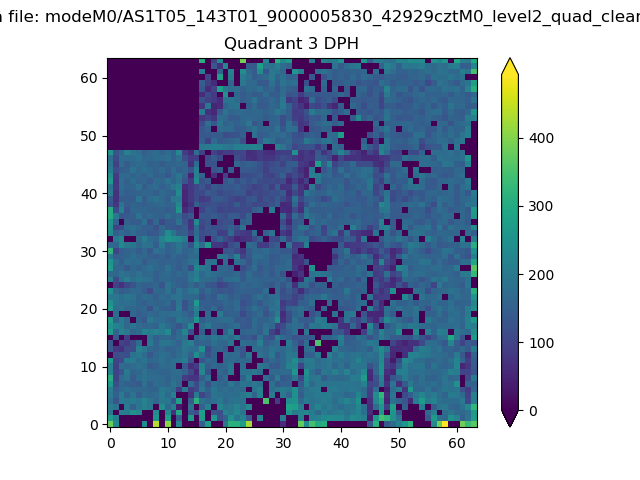 |
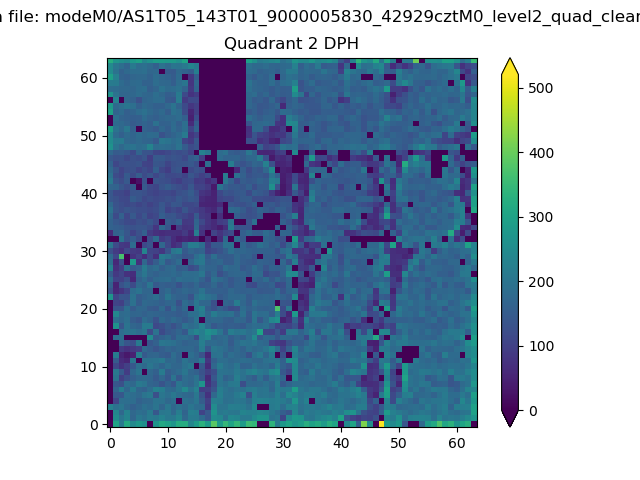 |
Quadrant C |
| Plot type | Count rate plots | Images |
|---|---|---|
| Comparison with Poisson distribution Blue bars denote a histogram of data divided into 1 sec bins. Red curve is a Poisson curve with rate = median count rate of data. |
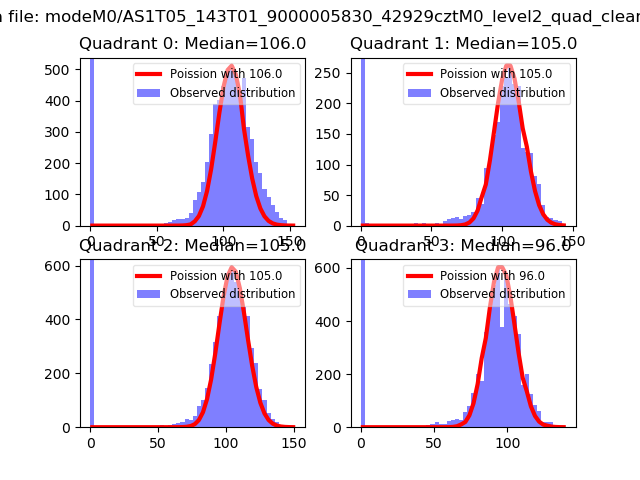 |
 |
| Quadrant-wise count rates Data is divided into 100 sec bins |
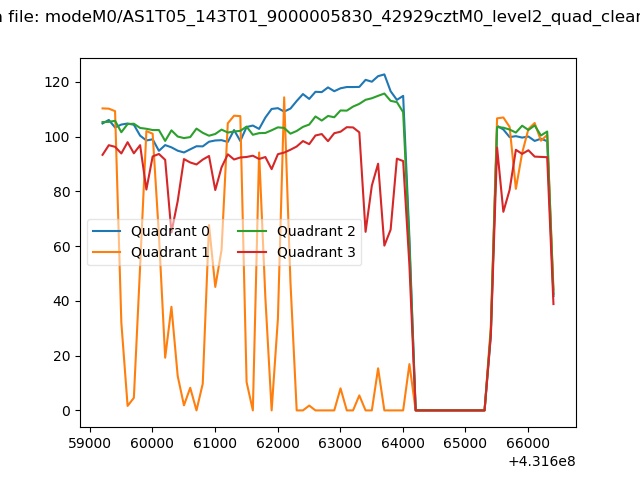 |
|
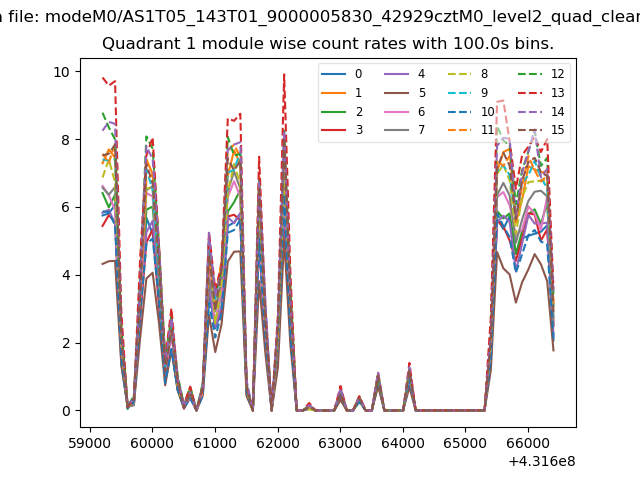
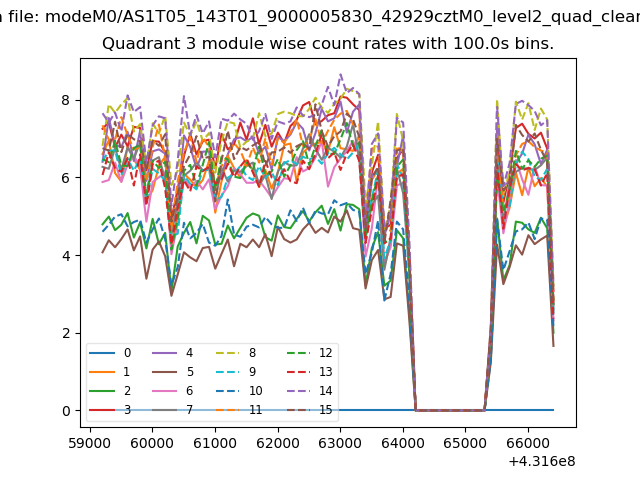
| Module-wise count rates for Quadrant A Data is divided into 100 sec bins |
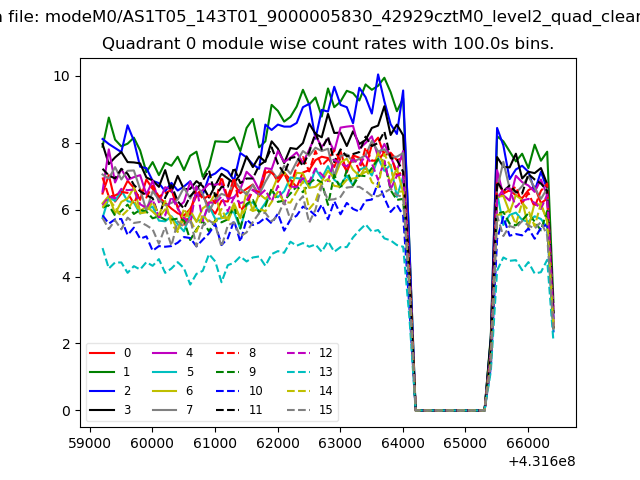 |
 |
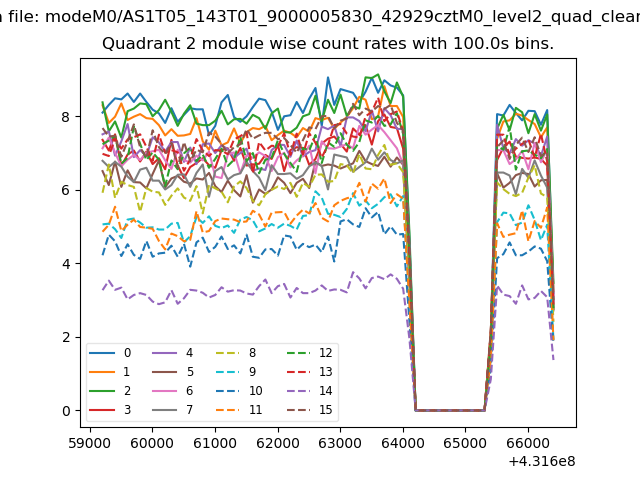
| Module-wise count rates for Quadrant B Data is divided into 100 sec bins |
 |
 |
| Module-wise count rates for Quadrant C Data is divided into 100 sec bins |
 |
 |
| Module-wise count rates for Quadrant D Data is divided into 100 sec bins |
 |
 |
| Parameter | Plot |
|---|---|
| CZT HV Monitor | 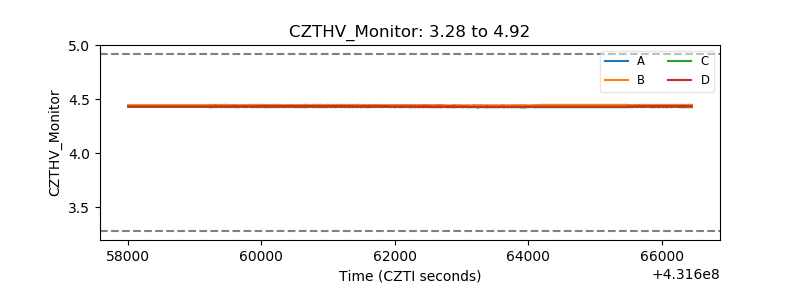 |
| D_VDD | 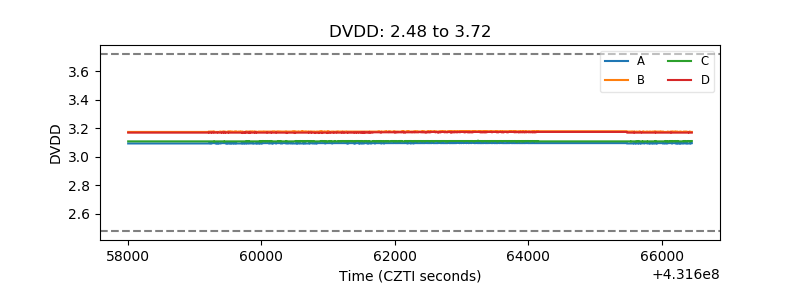 |
| Temperature 1 | 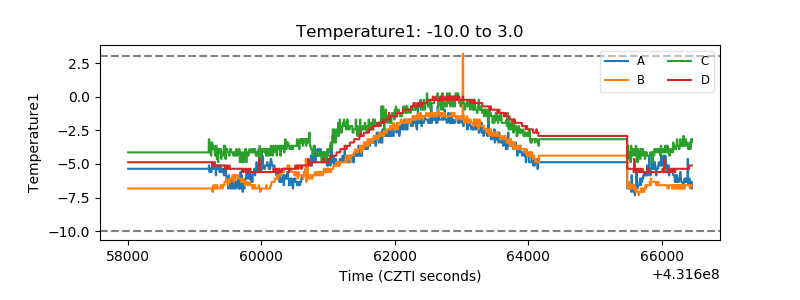 |
| Veto HV Monitor | 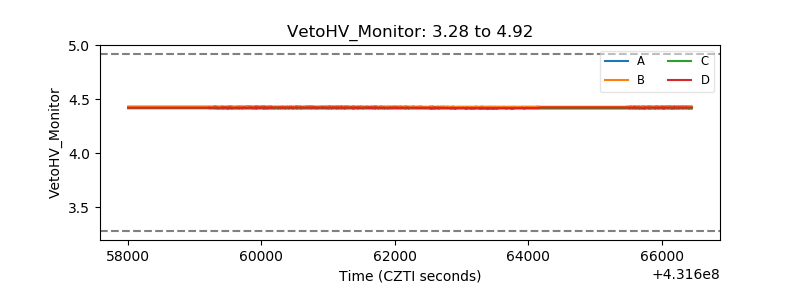 |
| Veto LLD | 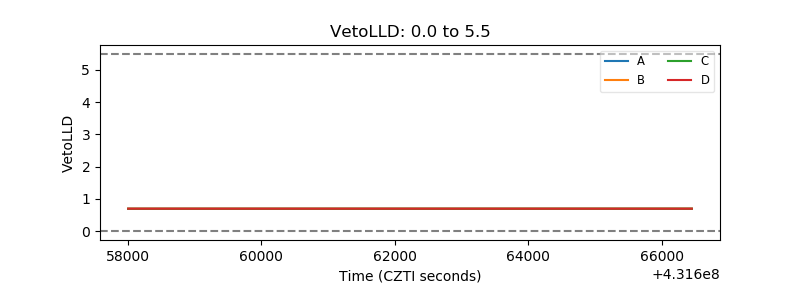 |
| Alpha Counter | 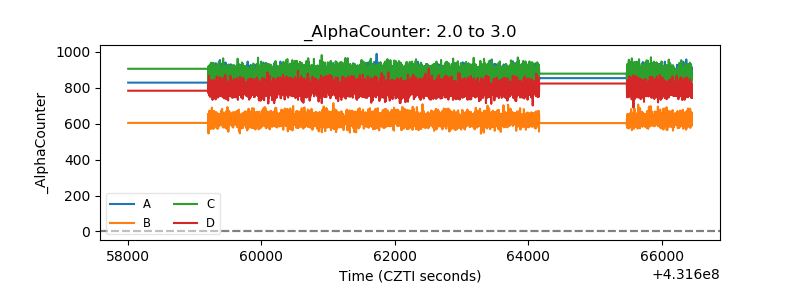 |
| _CPM_Rate | 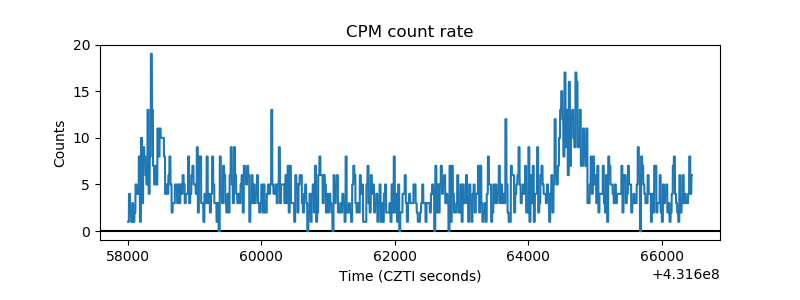 |
| CZT Counter | 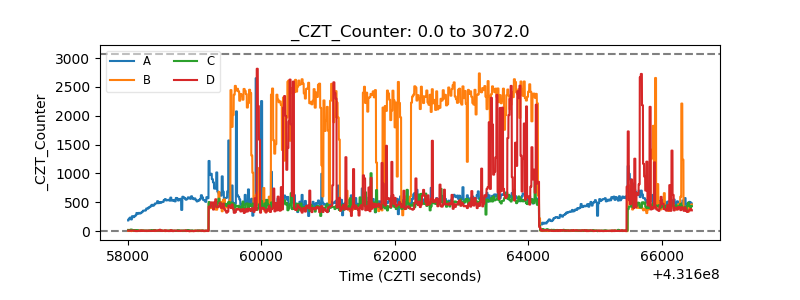 |
| +2.5 Volts monitor | 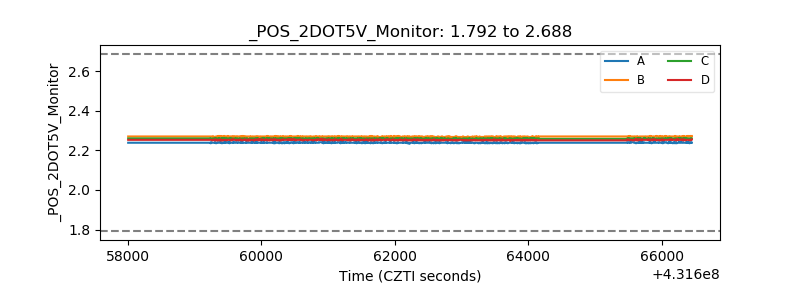 |
| +5 Volts monitor | 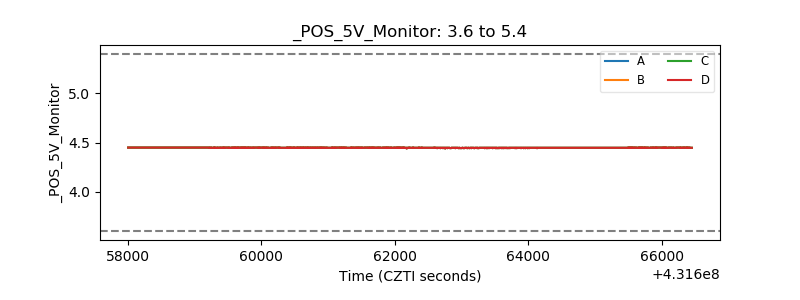 |
| _ROLL_ROT | 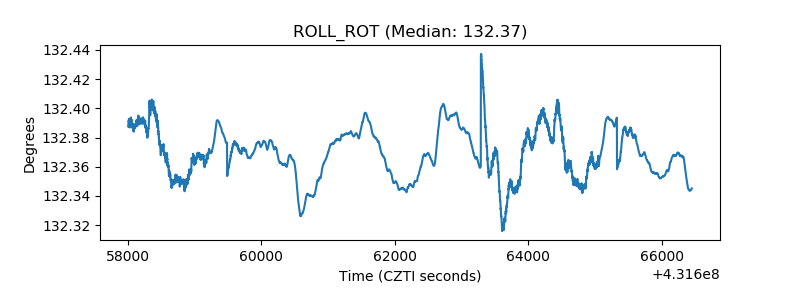 |
| _Roll_DEC | 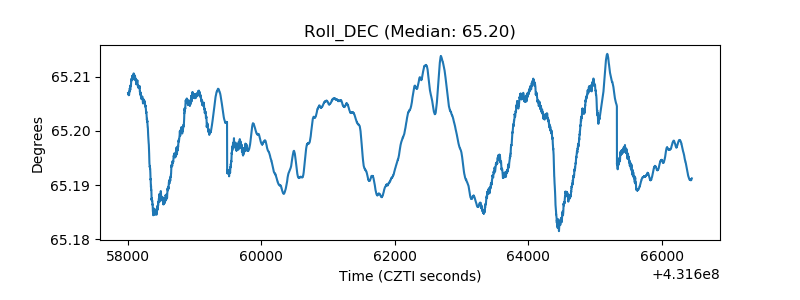 |
| _Roll_RA | 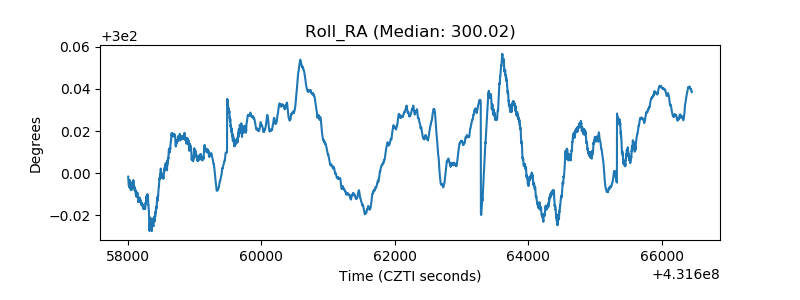 |
| Veto Counter | 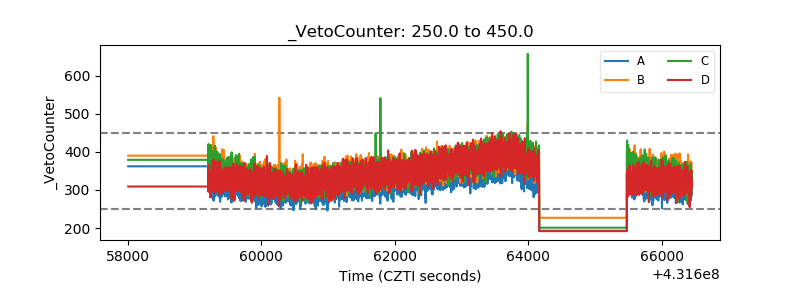 |