| Param | Original file | Final file |
|---|---|---|
| Filename | modeM0/AS1T05_143T01_9000005830_42932cztM0_level2.fits | modeM0/AS1T05_143T01_9000005830_42932cztM0_level2_quad_clean.evt |
| Size (bytes) | 1,412,435,520 | 214,073,280 |
| Size | 1.3 GB | 204.2 MB |
| Events in quadrant A | 8,420,640 | 1,645,870 |
| Events in quadrant B | 25,411,110 | 752,312 |
| Events in quadrant C | 7,391,935 | 1,601,160 |
| Events in quadrant D | 9,856,520 | 1,410,326 |
| Mode M0 | |||
|---|---|---|---|
| Quadrant | BADHDUFLAG | Total packets | Discarded packets |
| A | 0 | 33862 | 4 |
| B | 0 | 86306 | 4 |
| C | 0 | 31889 | 4 |
| D | 0 | 40503 | 4 |
| Mode M9 | |||
|---|---|---|---|
| Quadrant | BADHDUFLAG | Total packets | Discarded packets |
| A | 0 | 43 | 0 |
| B | 0 | 44 | 0 |
| C | 0 | 44 | 0 |
| D | 0 | 44 | 0 |
| Mode SS | |||
|---|---|---|---|
| Quadrant | BADHDUFLAG | Total packets | Discarded packets |
| A | 0 | 316 | 0 |
| B | 0 | 316 | 0 |
| C | 0 | 316 | 0 |
| D | 0 | 316 | 0 |
| Quadrant | Total seconds | Saturated seconds | Saturation percentage |
|---|---|---|---|
| A | 15529 | 44 | 0.283341% |
| B | 15529 | 8956 | 57.672741% |
| C | 15529 | 19 | 0.122352% |
| D | 15529 | 650 | 4.185717% |
Noise dominated data is calculated using 1-second bins in cleaned event files. If a bin has >2000 counts, and if more than 50% of those come from <1% of pixels, then it is considered to be noise-dominated and hence unusable.
| Quadrant | # 1 sec bins | Bins with >0 counts | Bins with >2000 counts | High rate bins dominated by noise | Noise dominated (total time) | Noise dominated (detector-on time) | Marked lightcurve |
|---|---|---|---|---|---|---|---|
| A | 19797 | 15532 | 18 | 18 | 0.09% | 0.12% | 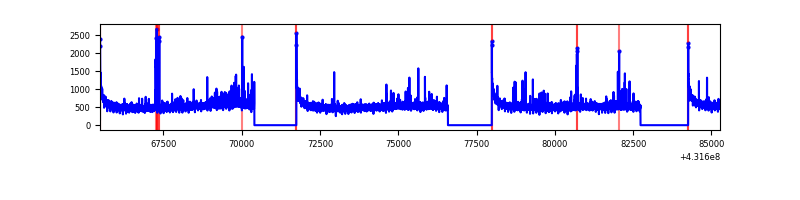 |
| B | 19797 | 15531 | 8191 | 8191 | 41.37% | 52.74% | 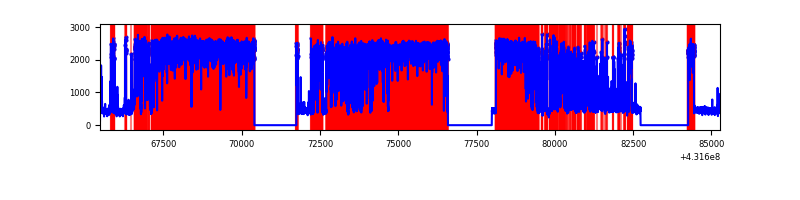 |
| C | 19797 | 15532 | 12 | 12 | 0.06% | 0.08% | 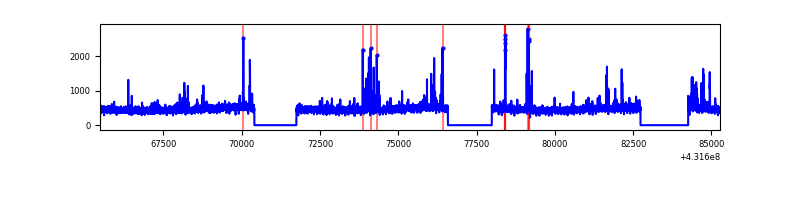 |
| D | 19797 | 15532 | 656 | 656 | 3.31% | 4.22% | 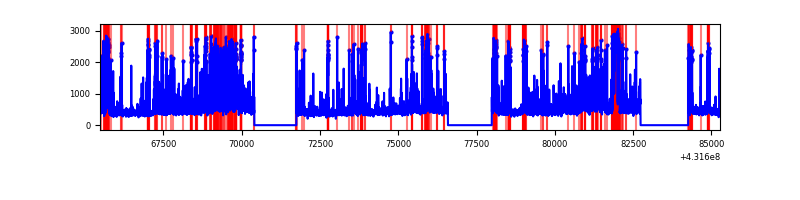 |
Top three noisy pixels from each quadrant. If the there are fewer than three noisy pixels in the level2.evt file, extra rows are filled as -1
| Pixel properties | Quadrant properties | ||||||
|---|---|---|---|---|---|---|---|
| Quadrant | DetID | PixID | Counts | Sigma | Mean | Median | Sigma |
| A | 10 | 83 | 1561067 | 4453.68 | 1698 | 1660 | 350.1 |
| A | 15 | 222 | 210287 | 595.84 | 1698 | 1660 | 350.1 |
| A | 7 | 3 | 36773 | 100.28 | 1698 | 1660 | 350.1 |
| B | 4 | 81 | 20834715 | 99481.23 | 1084 | 1053 | 209.4 |
| B | 4 | 171 | 107248 | 507.08 | 1084 | 1053 | 209.4 |
| B | 5 | 172 | 101863 | 481.37 | 1084 | 1053 | 209.4 |
| C | 15 | 214 | 678468 | 1771.72 | 1649 | 1656 | 382.0 |
| C | 14 | 254 | 165880 | 429.9 | 1649 | 1656 | 382.0 |
| C | 12 | 249 | 84548 | 216.99 | 1649 | 1656 | 382.0 |
| D | 2 | 249 | 1398292 | 3525.98 | 1626 | 1577 | 396.1 |
| D | 12 | 6 | 519671 | 1307.92 | 1626 | 1577 | 396.1 |
| D | 1 | 52 | 366425 | 921.05 | 1626 | 1577 | 396.1 |
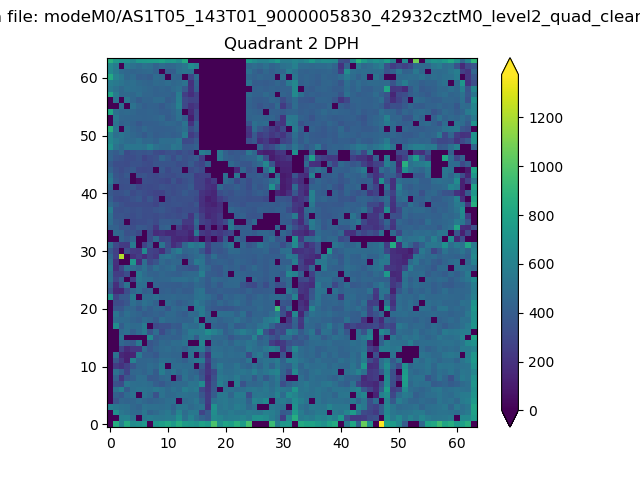
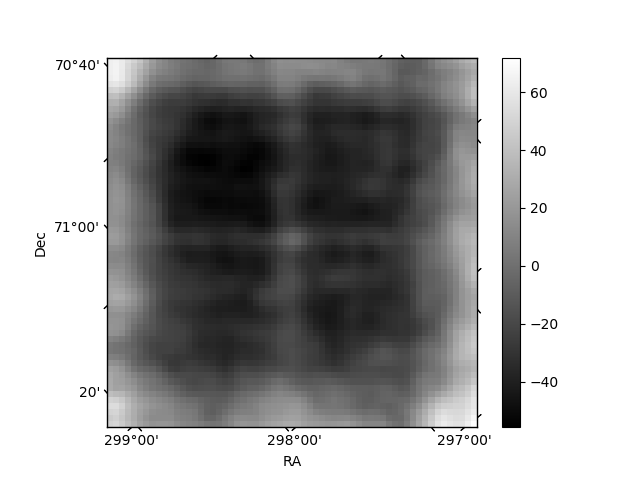
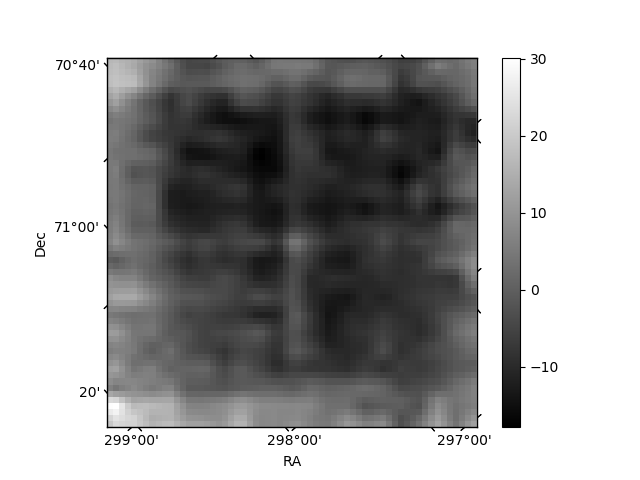
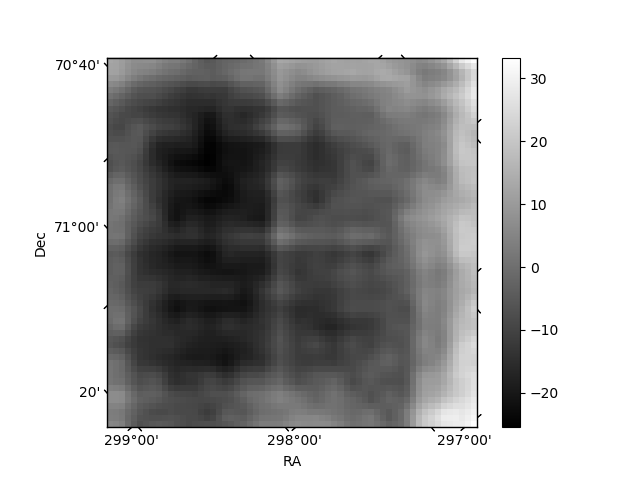
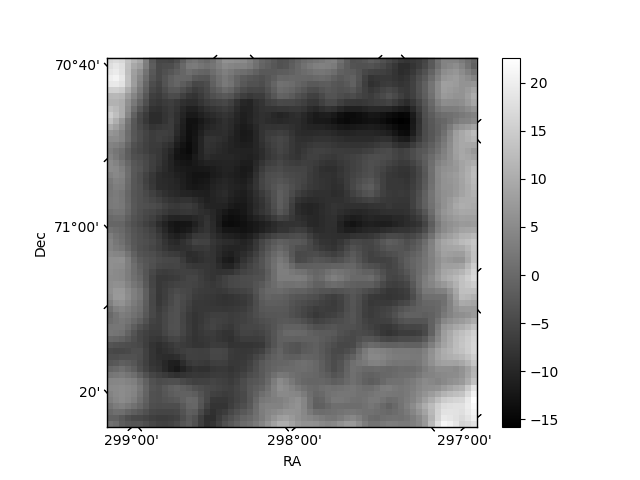
Histogram calculated using DETX and DETY for each event in the final _common_clean file
| Quadrant A | 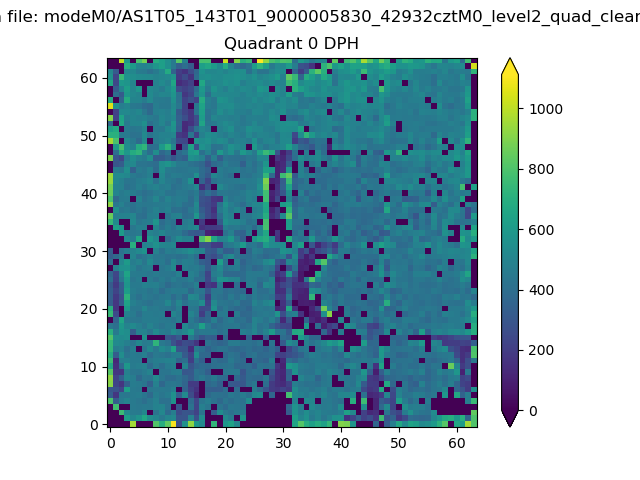 |
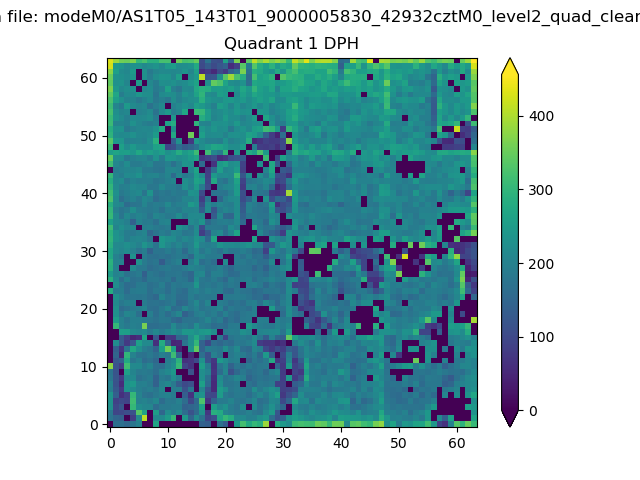 |
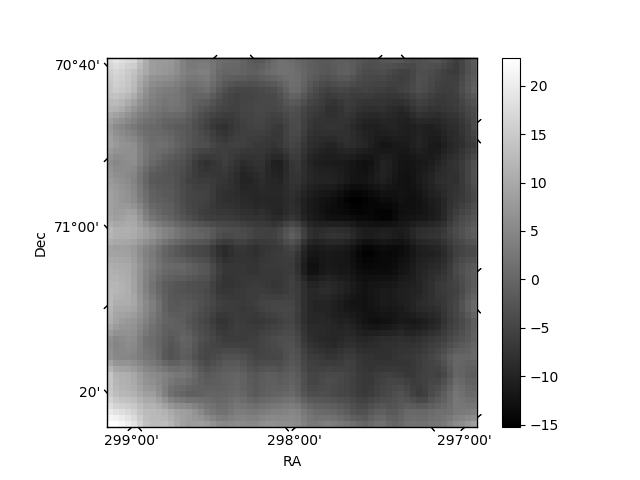
Quadrant B |
|---|---|---|---|
| Quadrant D | 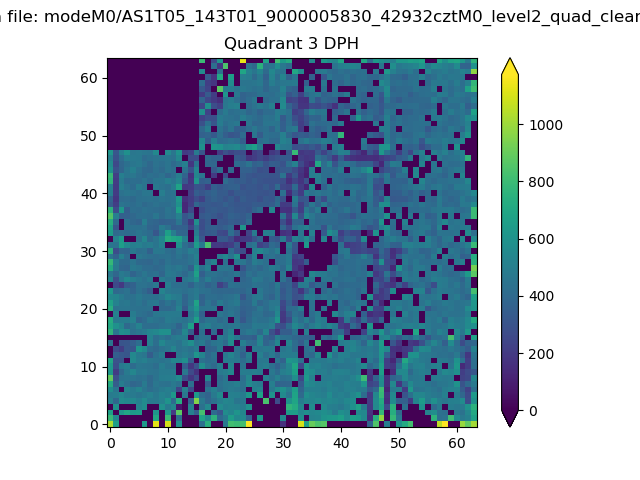 |
 |
Quadrant C |
| Plot type | Count rate plots | Images |
|---|---|---|
| Comparison with Poisson distribution Blue bars denote a histogram of data divided into 1 sec bins. Red curve is a Poisson curve with rate = median count rate of data. |
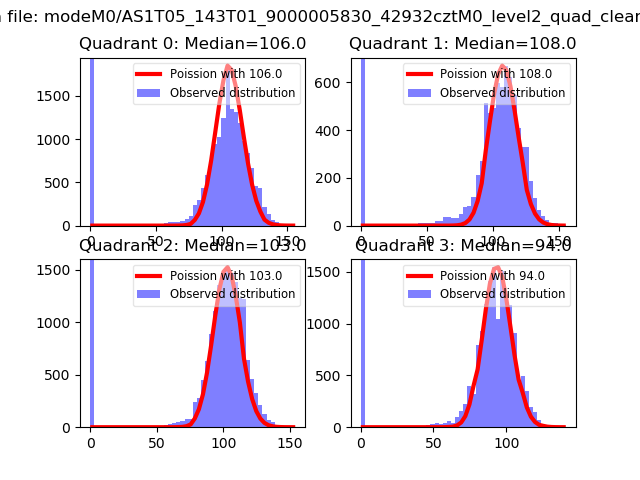 |
 |
| Quadrant-wise count rates Data is divided into 100 sec bins |
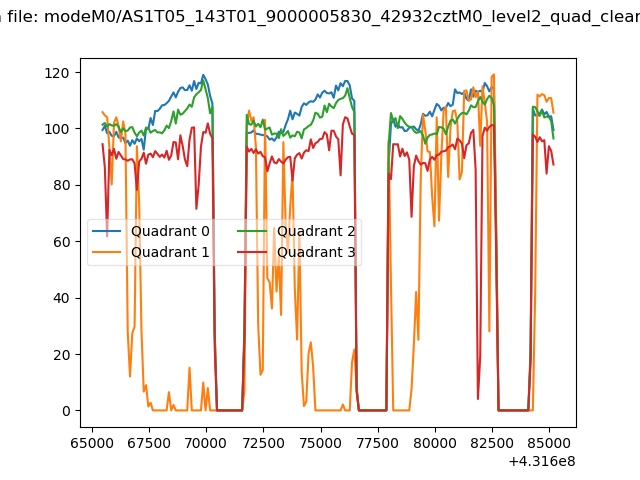 |
|
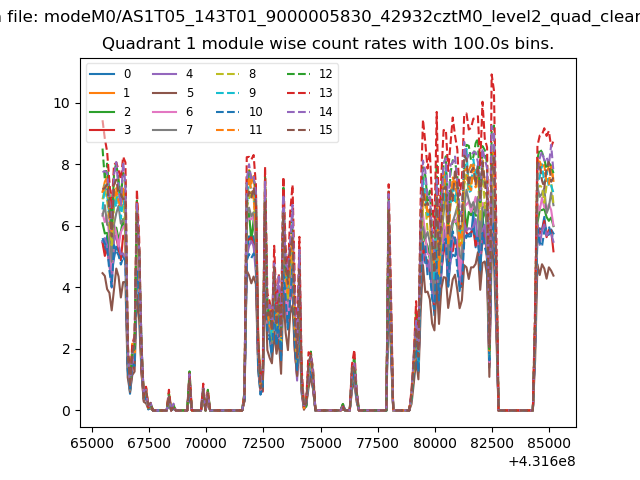
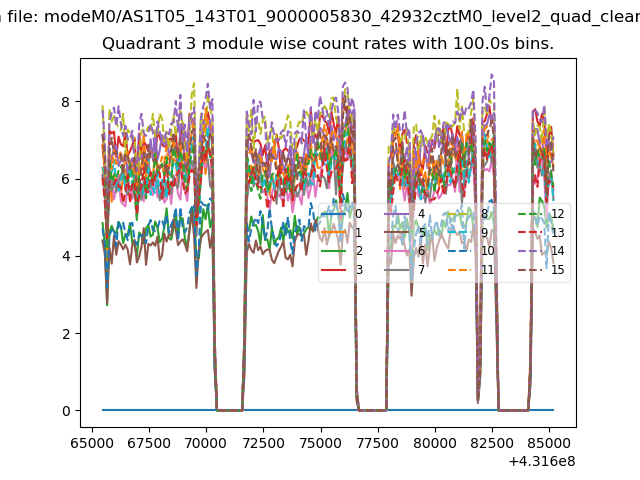
| Module-wise count rates for Quadrant A Data is divided into 100 sec bins |
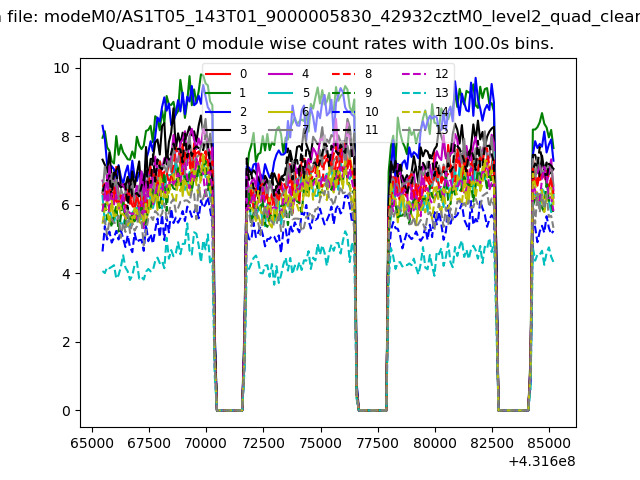 |
 |
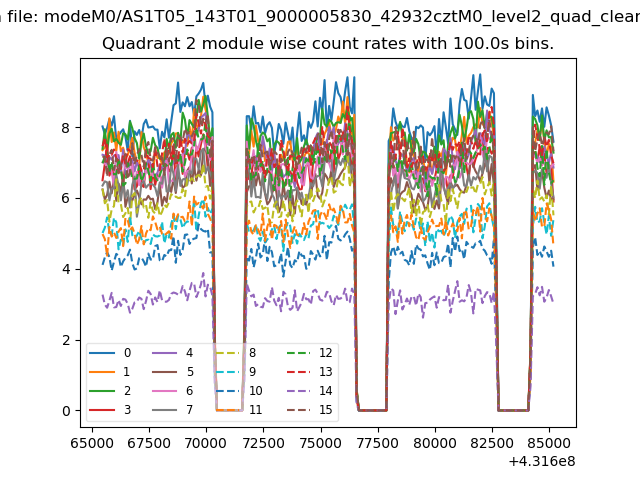
| Module-wise count rates for Quadrant B Data is divided into 100 sec bins |
 |
 |
| Module-wise count rates for Quadrant C Data is divided into 100 sec bins |
 |
 |
| Module-wise count rates for Quadrant D Data is divided into 100 sec bins |
 |
 |
| Parameter | Plot |
|---|---|
| CZT HV Monitor | 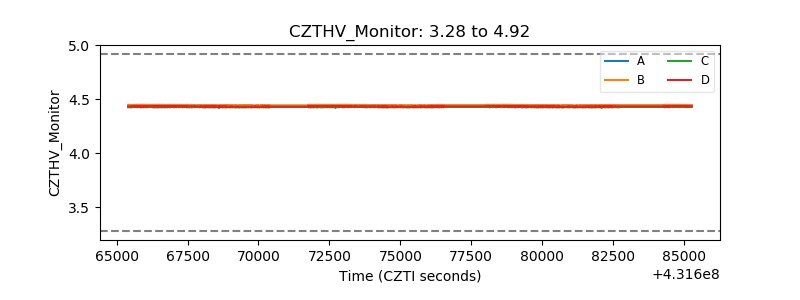 |
| D_VDD | 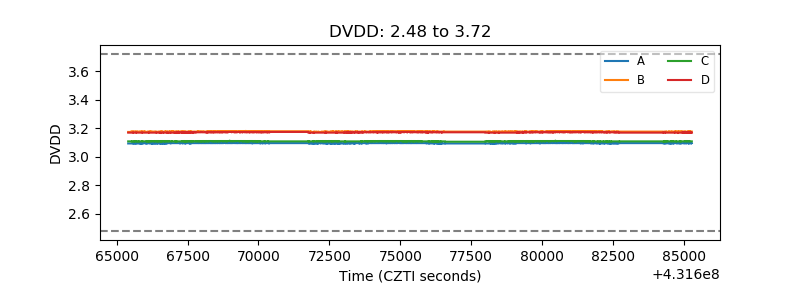 |
| Temperature 1 | 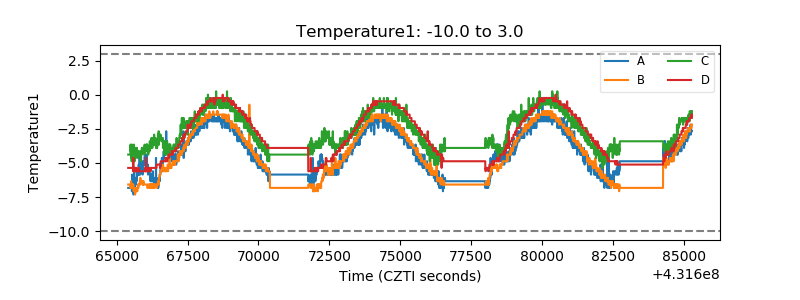 |
| Veto HV Monitor |  |
| Veto LLD | 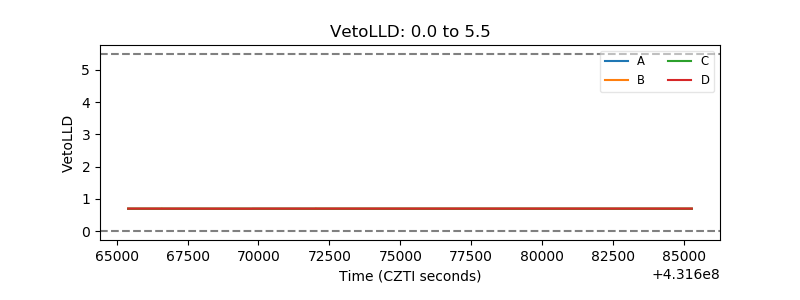 |
| Alpha Counter | 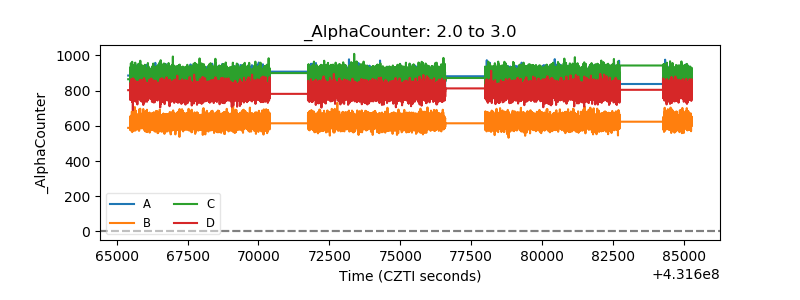 |
| _CPM_Rate | 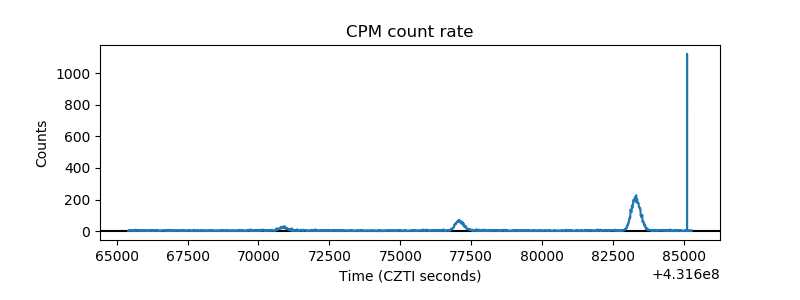 |
| CZT Counter | 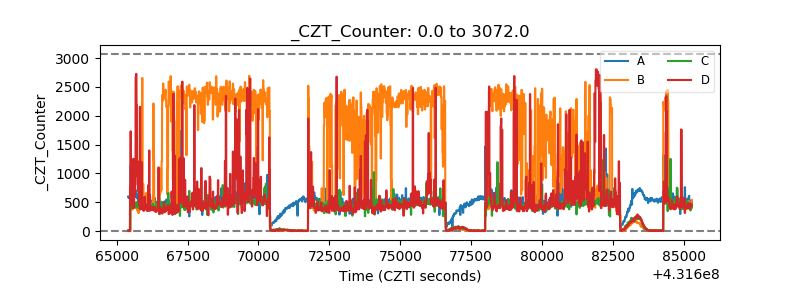 |
| +2.5 Volts monitor | 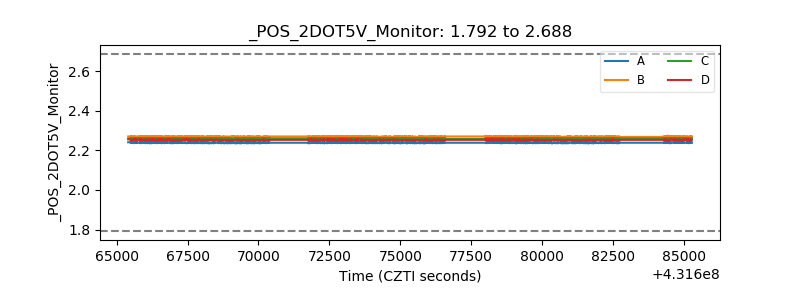 |
| +5 Volts monitor | 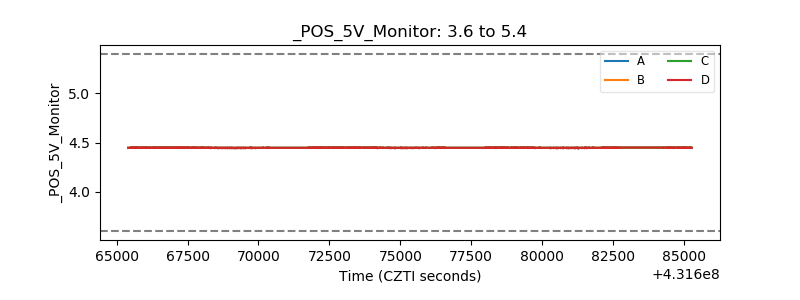 |
| _ROLL_ROT | 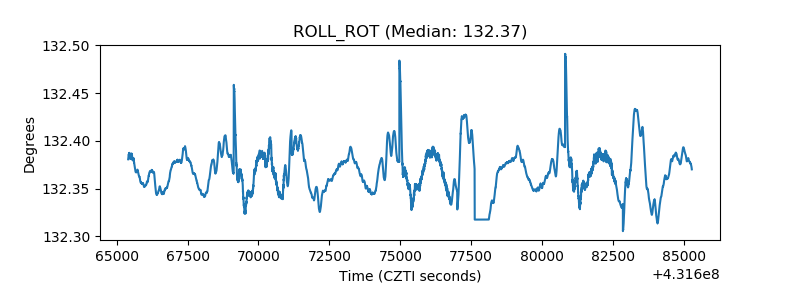 |
| _Roll_DEC | 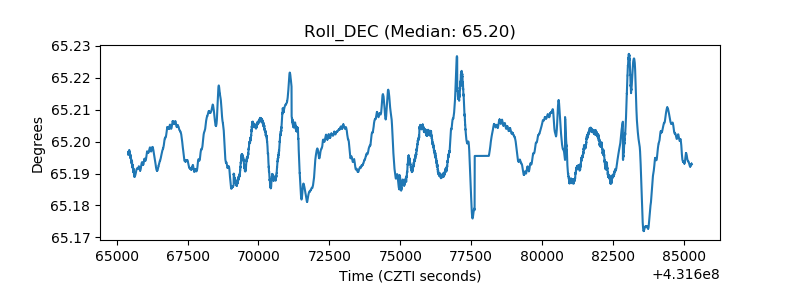 |
| _Roll_RA | 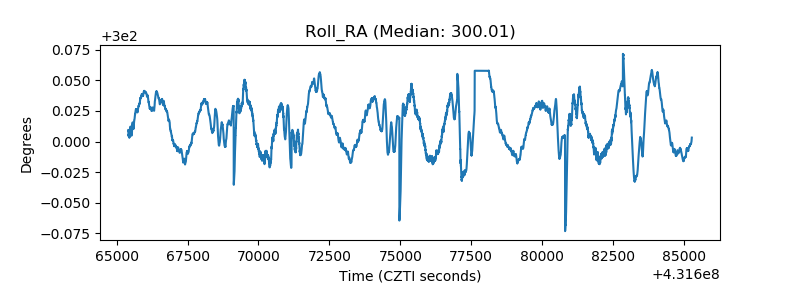 |
| Veto Counter | 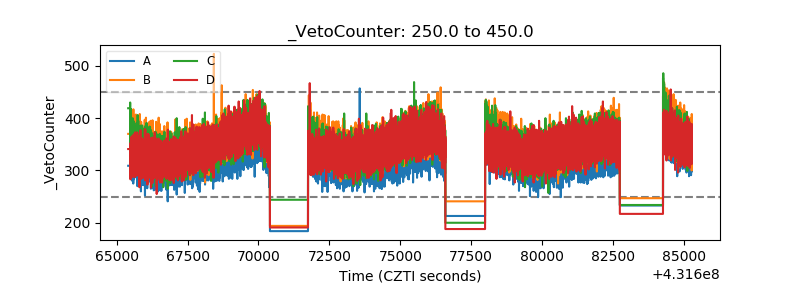 |