| Param | Original file | Final file |
|---|---|---|
| Filename | modeM0/AS1T05_143T01_9000005830_42933cztM0_level2.fits | modeM0/AS1T05_143T01_9000005830_42933cztM0_level2_quad_clean.evt |
| Size (bytes) | 559,008,000 | 77,878,080 |
| Size | 533.1 MB | 74.3 MB |
| Events in quadrant A | 3,577,460 | 621,106 |
| Events in quadrant B | 9,759,220 | 216,133 |
| Events in quadrant C | 2,877,299 | 596,000 |
| Events in quadrant D | 4,037,317 | 528,671 |
| Mode M0 | |||
|---|---|---|---|
| Quadrant | BADHDUFLAG | Total packets | Discarded packets |
| A | 0 | 14038 | 2 |
| B | 0 | 32892 | 2 |
| C | 0 | 12095 | 2 |
| D | 0 | 15863 | 2 |
| Mode M9 | |||
|---|---|---|---|
| Quadrant | BADHDUFLAG | Total packets | Discarded packets |
| A | 0 | 31 | 0 |
| B | 0 | 32 | 0 |
| C | 0 | 32 | 0 |
| D | 0 | 32 | 0 |
| Mode SS | |||
|---|---|---|---|
| Quadrant | BADHDUFLAG | Total packets | Discarded packets |
| A | 0 | 116 | 0 |
| B | 0 | 116 | 0 |
| C | 0 | 116 | 0 |
| D | 0 | 116 | 0 |
| Quadrant | Total seconds | Saturated seconds | Saturation percentage |
|---|---|---|---|
| A | 5665 | 151 | 2.665490% |
| B | 5665 | 3835 | 67.696381% |
| C | 5665 | 49 | 0.864960% |
| D | 5665 | 322 | 5.684025% |
Noise dominated data is calculated using 1-second bins in cleaned event files. If a bin has >2000 counts, and if more than 50% of those come from <1% of pixels, then it is considered to be noise-dominated and hence unusable.
| Quadrant | # 1 sec bins | Bins with >0 counts | Bins with >2000 counts | High rate bins dominated by noise | Noise dominated (total time) | Noise dominated (detector-on time) | Marked lightcurve |
|---|---|---|---|---|---|---|---|
| A | 7308 | 5666 | 141 | 141 | 1.93% | 2.49% | 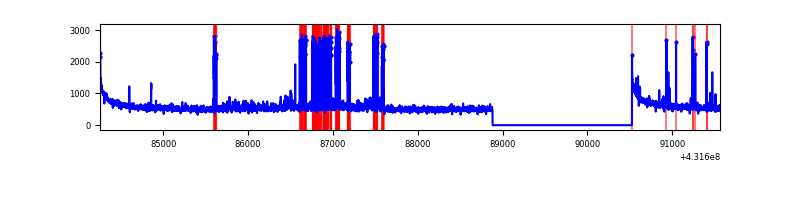 |
| B | 7307 | 5664 | 3481 | 3481 | 47.64% | 61.46% | 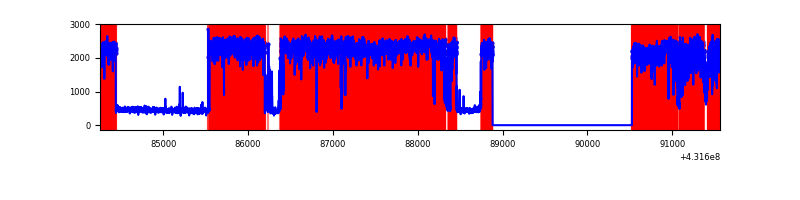 |
| C | 7308 | 5666 | 49 | 49 | 0.67% | 0.86% | 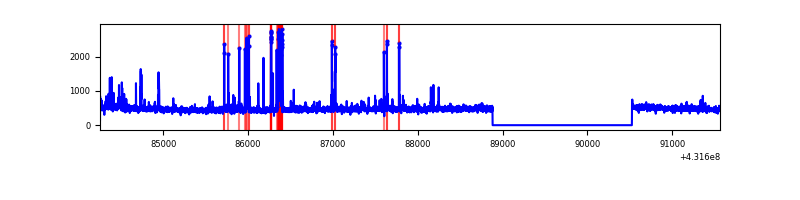 |
| D | 7308 | 5666 | 336 | 336 | 4.60% | 5.93% | 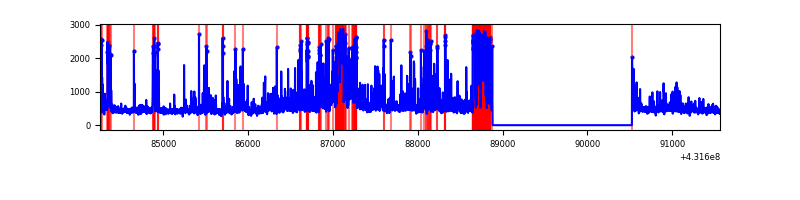 |
Top three noisy pixels from each quadrant. If the there are fewer than three noisy pixels in the level2.evt file, extra rows are filled as -1
| Pixel properties | Quadrant properties | ||||||
|---|---|---|---|---|---|---|---|
| Quadrant | DetID | PixID | Counts | Sigma | Mean | Median | Sigma |
| A | 10 | 83 | 625007 | 4852.46 | 624 | 612 | 128.7 |
| A | 15 | 222 | 523562 | 4064.08 | 624 | 612 | 128.7 |
| A | 13 | 6 | 12973 | 96.06 | 624 | 612 | 128.7 |
| B | 4 | 81 | 8324158 | 119065.19 | 355 | 345 | 69.9 |
| B | 4 | 171 | 8933 | 122.84 | 355 | 345 | 69.9 |
| B | 5 | 172 | 8753 | 120.27 | 355 | 345 | 69.9 |
| C | 15 | 214 | 250802 | 1780.36 | 602 | 607 | 140.5 |
| C | 14 | 254 | 232283 | 1648.58 | 602 | 607 | 140.5 |
| C | 12 | 249 | 36412 | 254.78 | 602 | 607 | 140.5 |
| D | 1 | 47 | 793232 | 5511.0 | 592 | 575 | 143.8 |
| D | 2 | 249 | 338540 | 2349.73 | 592 | 575 | 143.8 |
| D | 1 | 52 | 288347 | 2000.75 | 592 | 575 | 143.8 |
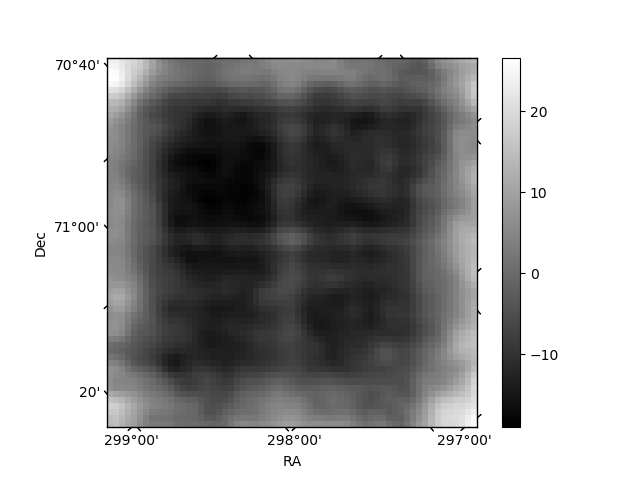
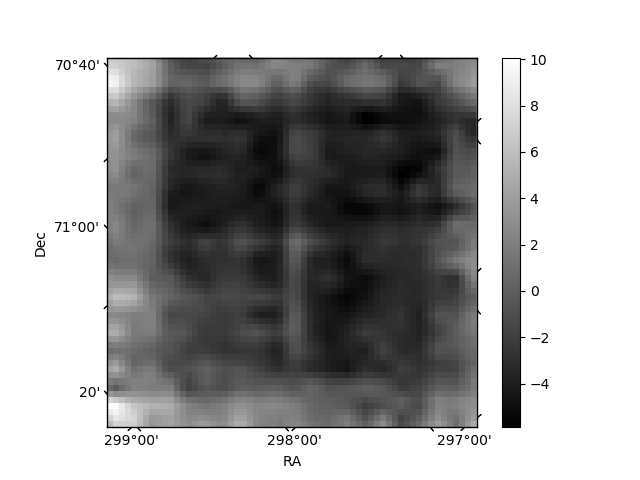
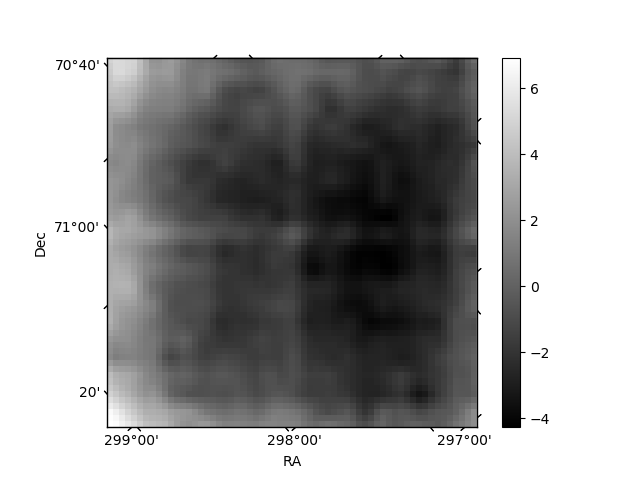
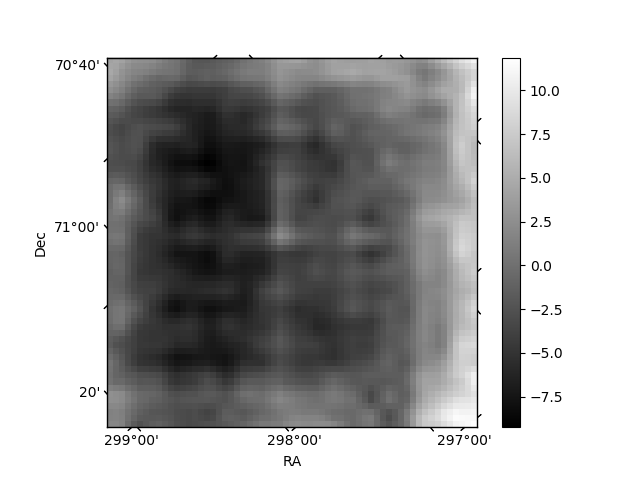
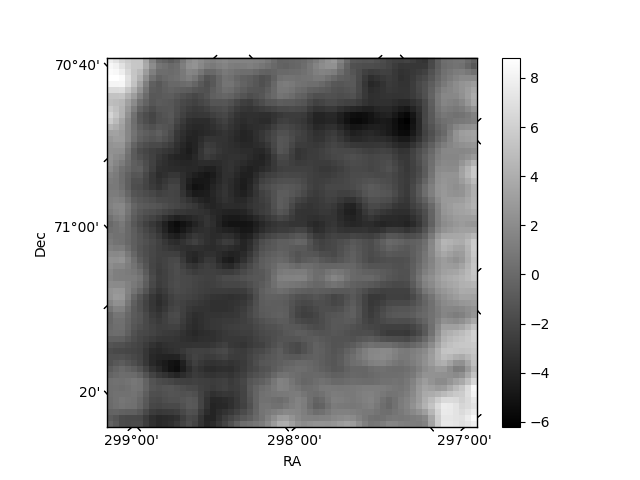
Histogram calculated using DETX and DETY for each event in the final _common_clean file
| Quadrant A | 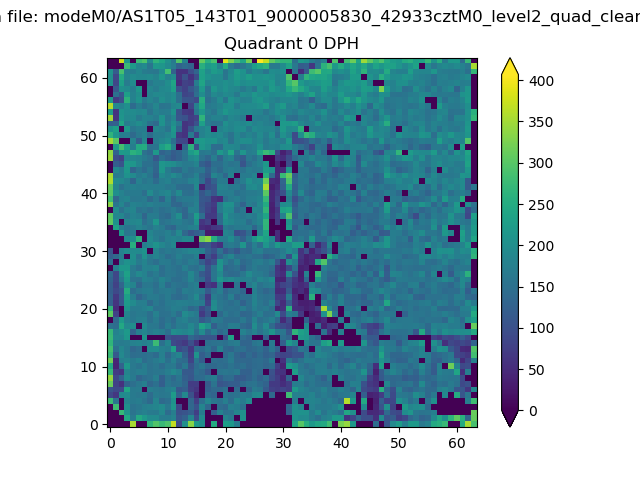 |
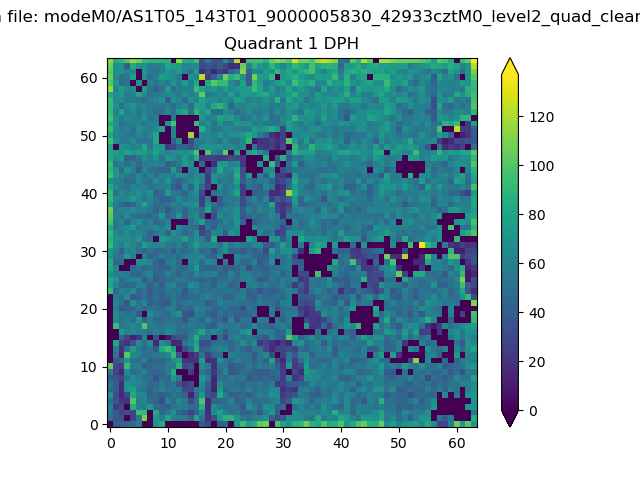 |
Quadrant B |
|---|---|---|---|
| Quadrant D | 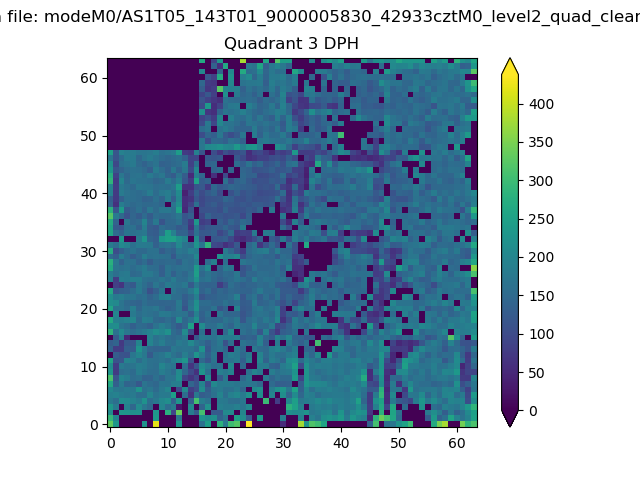 |
 |
Quadrant C |
| Plot type | Count rate plots | Images |
|---|---|---|
| Comparison with Poisson distribution Blue bars denote a histogram of data divided into 1 sec bins. Red curve is a Poisson curve with rate = median count rate of data. |
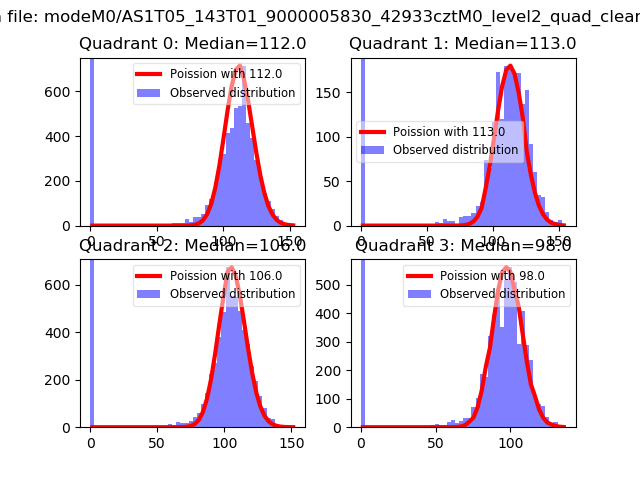 |
 |
| Quadrant-wise count rates Data is divided into 100 sec bins |
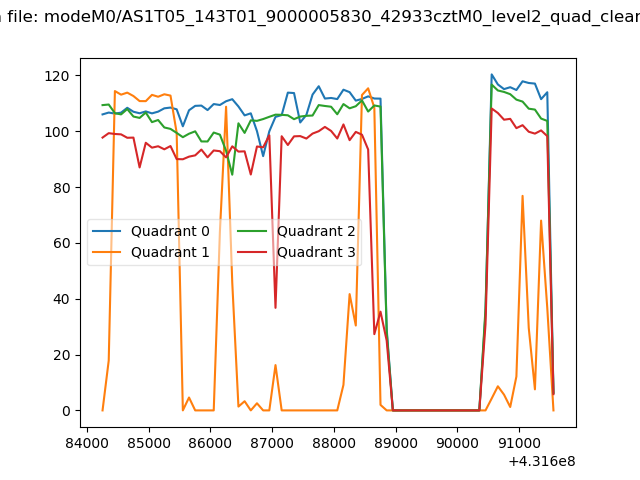 |
|
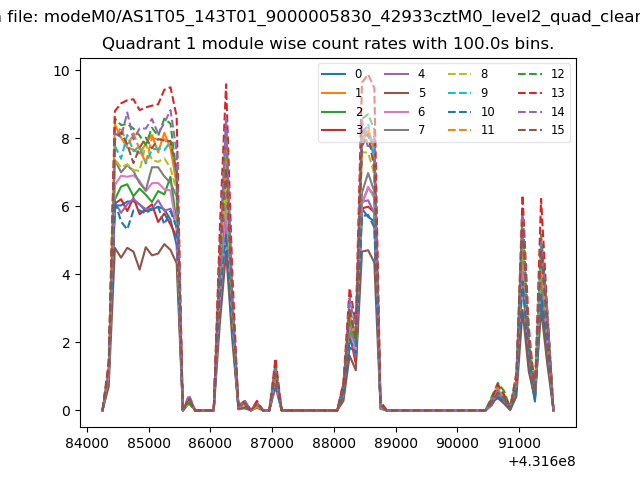
| Module-wise count rates for Quadrant A Data is divided into 100 sec bins |
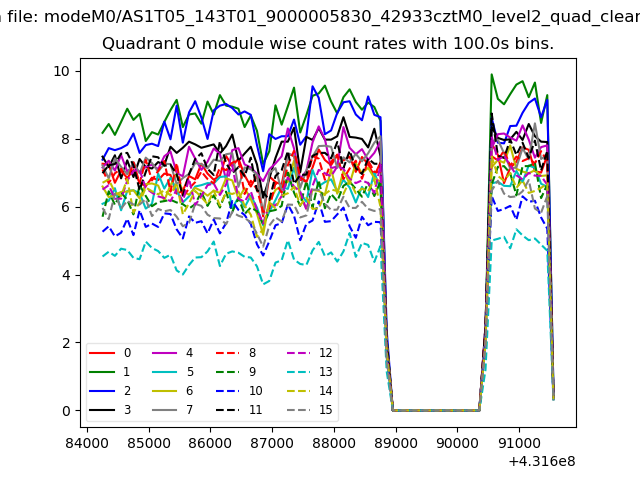 |
 |
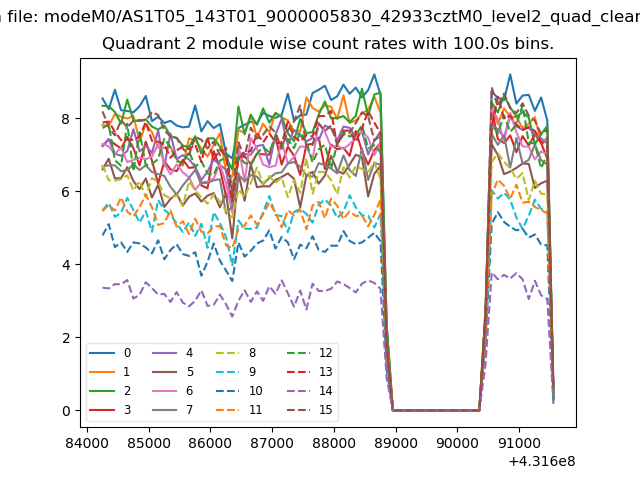
| Module-wise count rates for Quadrant B Data is divided into 100 sec bins |
 |
 |
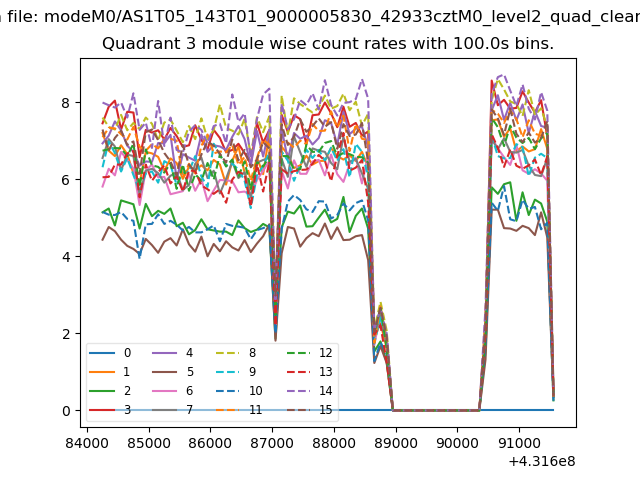
| Module-wise count rates for Quadrant C Data is divided into 100 sec bins |
 |
 |
| Module-wise count rates for Quadrant D Data is divided into 100 sec bins |
 |
 |
| Parameter | Plot |
|---|---|
| CZT HV Monitor | 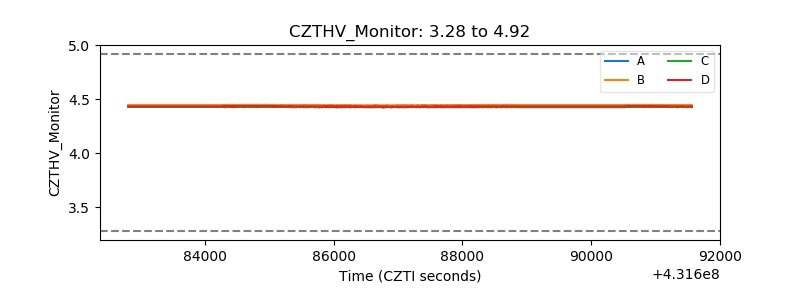 |
| D_VDD | 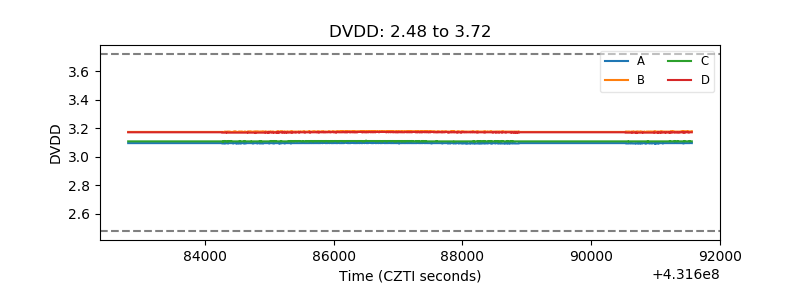 |
| Temperature 1 | 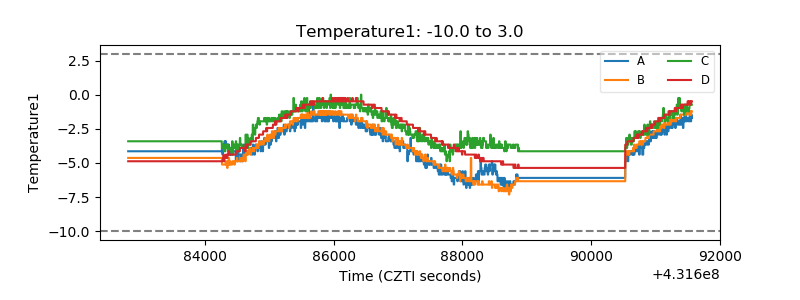 |
| Veto HV Monitor | 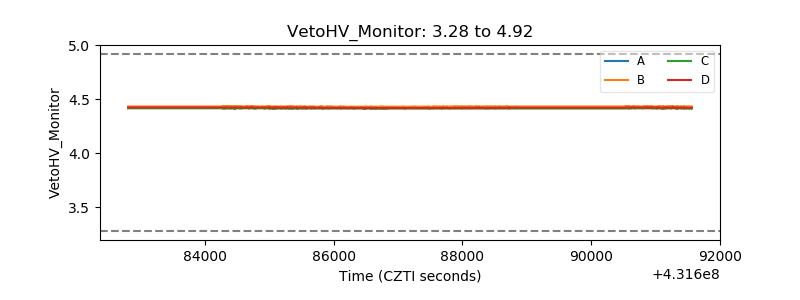 |
| Veto LLD | 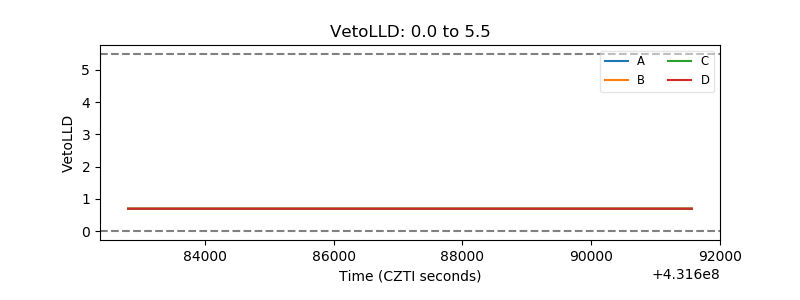 |
| Alpha Counter |  |
| _CPM_Rate | 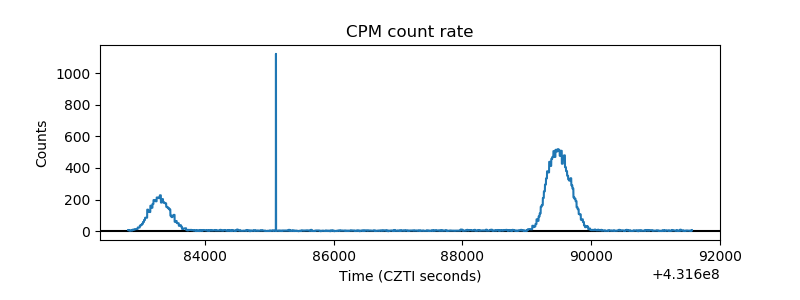 |
| CZT Counter | 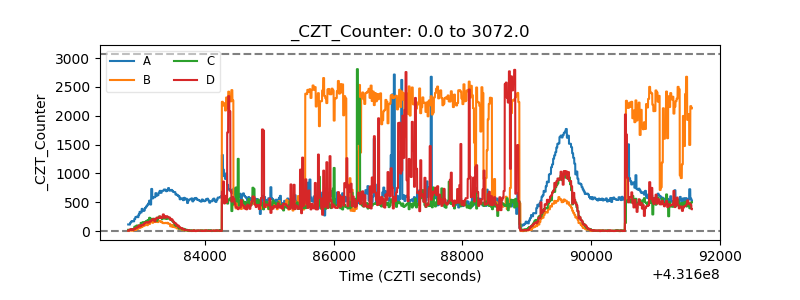 |
| +2.5 Volts monitor |  |
| +5 Volts monitor | 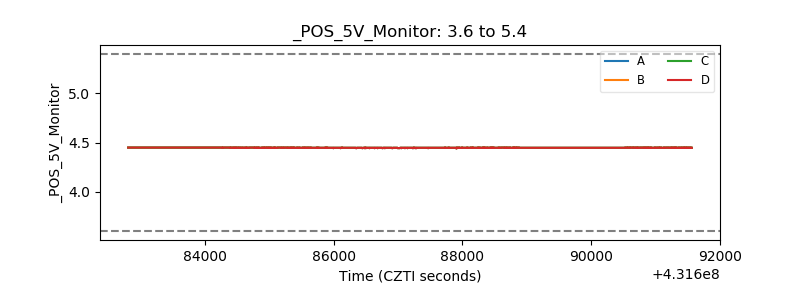 |
| _ROLL_ROT | 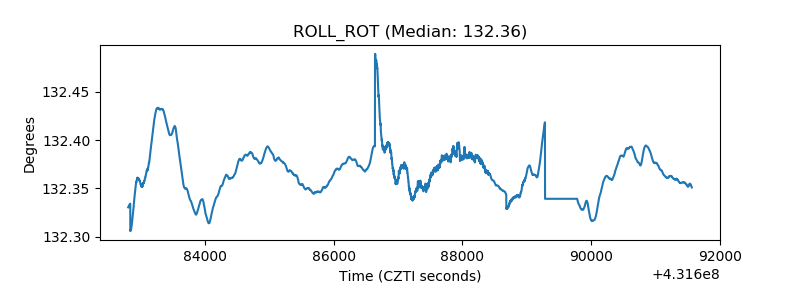 |
| _Roll_DEC | 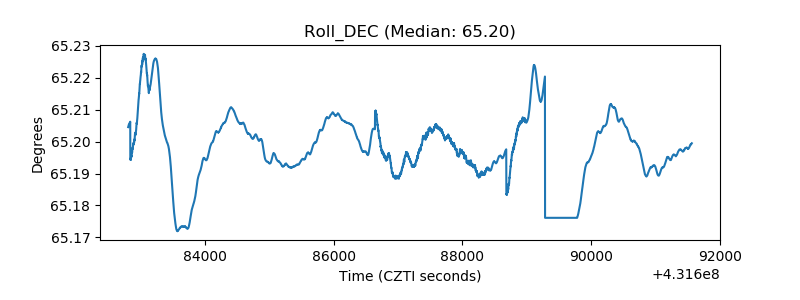 |
| _Roll_RA | 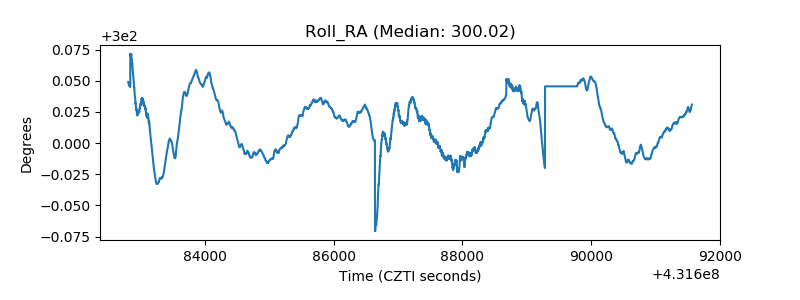 |
| Veto Counter | 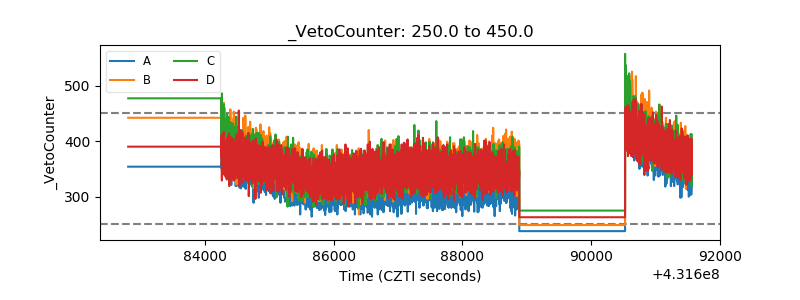 |