| Param | Original file | Final file |
|---|---|---|
| Filename | modeM0/AS1T05_143T01_9000005830_42935cztM0_level2.fits | modeM0/AS1T05_143T01_9000005830_42935cztM0_level2_quad_clean.evt |
| Size (bytes) | 452,024,640 | 86,564,160 |
| Size | 431.1 MB | 82.6 MB |
| Events in quadrant A | 3,304,837 | 644,514 |
| Events in quadrant B | 6,912,990 | 419,909 |
| Events in quadrant C | 2,674,092 | 611,092 |
| Events in quadrant D | 3,407,941 | 557,323 |
| Mode M0 | |||
|---|---|---|---|
| Quadrant | BADHDUFLAG | Total packets | Discarded packets |
| A | 0 | 13202 | 2 |
| B | 0 | 24271 | 2 |
| C | 0 | 11379 | 3 |
| D | 0 | 13888 | 2 |
| Mode M9 | |||
|---|---|---|---|
| Quadrant | BADHDUFLAG | Total packets | Discarded packets |
| A | 0 | 25 | 0 |
| B | 0 | 26 | 0 |
| C | 0 | 26 | 0 |
| D | 0 | 26 | 0 |
| Mode SS | |||
|---|---|---|---|
| Quadrant | BADHDUFLAG | Total packets | Discarded packets |
| A | 0 | 112 | 0 |
| B | 0 | 112 | 0 |
| C | 0 | 112 | 0 |
| D | 0 | 112 | 0 |
| Quadrant | Total seconds | Saturated seconds | Saturation percentage |
|---|---|---|---|
| A | 5553 | 77 | 1.386638% |
| B | 5553 | 2148 | 38.681794% |
| C | 5552 | 4 | 0.072046% |
| D | 5552 | 180 | 3.242075% |
Noise dominated data is calculated using 1-second bins in cleaned event files. If a bin has >2000 counts, and if more than 50% of those come from <1% of pixels, then it is considered to be noise-dominated and hence unusable.
| Quadrant | # 1 sec bins | Bins with >0 counts | Bins with >2000 counts | High rate bins dominated by noise | Noise dominated (total time) | Noise dominated (detector-on time) | Marked lightcurve |
|---|---|---|---|---|---|---|---|
| A | 7346 | 5554 | 55 | 55 | 0.75% | 0.99% | 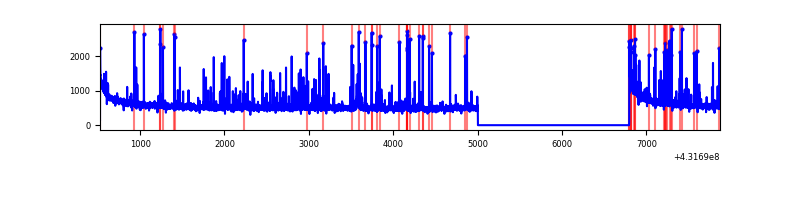 |
| B | 7346 | 5554 | 1883 | 1883 | 25.63% | 33.90% | 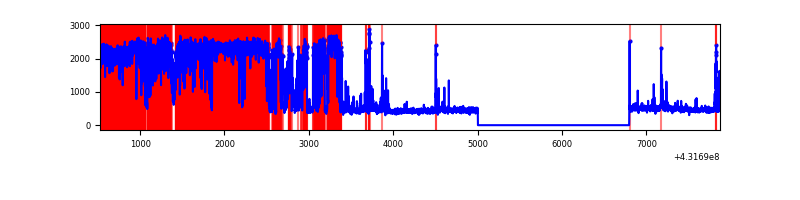 |
| C | 7345 | 5553 | 2 | 2 | 0.03% | 0.04% | 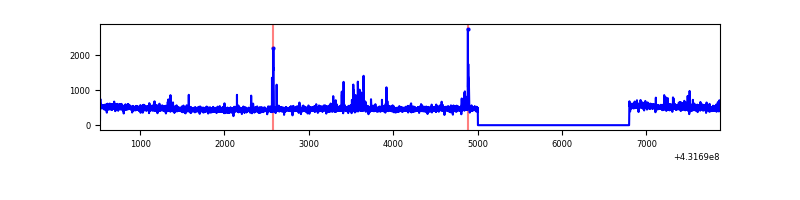 |
| D | 7345 | 5553 | 178 | 178 | 2.42% | 3.21% | 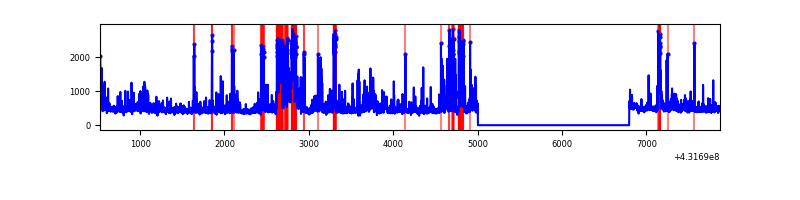 |
Top three noisy pixels from each quadrant. If the there are fewer than three noisy pixels in the level2.evt file, extra rows are filled as -1
| Pixel properties | Quadrant properties | ||||||
|---|---|---|---|---|---|---|---|
| Quadrant | DetID | PixID | Counts | Sigma | Mean | Median | Sigma |
| A | 10 | 83 | 613300 | 4772.61 | 622 | 607 | 128.4 |
| A | 15 | 222 | 239746 | 1862.79 | 622 | 607 | 128.4 |
| A | 13 | 248 | 42482 | 326.19 | 622 | 607 | 128.4 |
| B | 4 | 81 | 4826483 | 50969.39 | 491 | 477 | 94.7 |
| B | 5 | 172 | 75043 | 787.52 | 491 | 477 | 94.7 |
| B | 4 | 171 | 61596 | 645.5 | 491 | 477 | 94.7 |
| C | 15 | 214 | 243009 | 1729.06 | 602 | 605 | 140.2 |
| C | 14 | 254 | 63187 | 446.39 | 602 | 605 | 140.2 |
| C | 12 | 249 | 15522 | 106.4 | 602 | 605 | 140.2 |
| D | 10 | 118 | 286775 | 1946.06 | 599 | 581 | 147.1 |
| D | 1 | 52 | 197350 | 1337.99 | 599 | 581 | 147.1 |
| D | 12 | 6 | 189613 | 1285.38 | 599 | 581 | 147.1 |
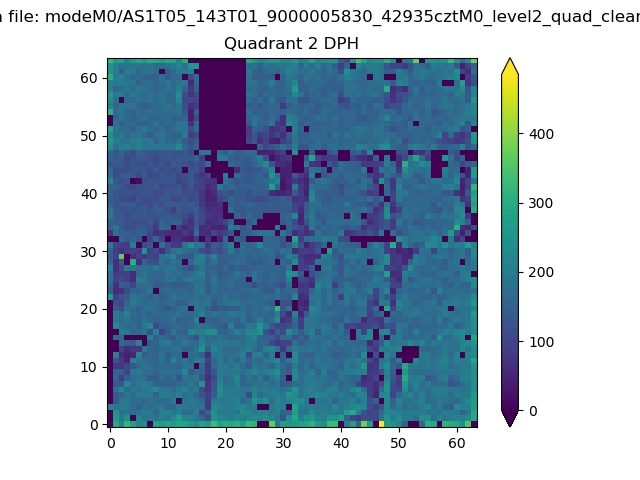
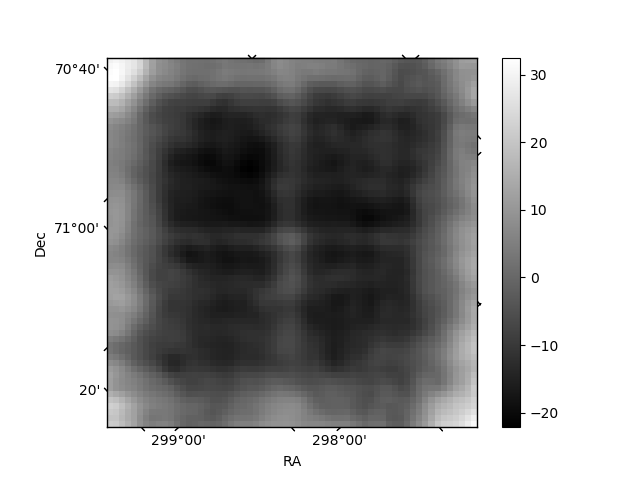
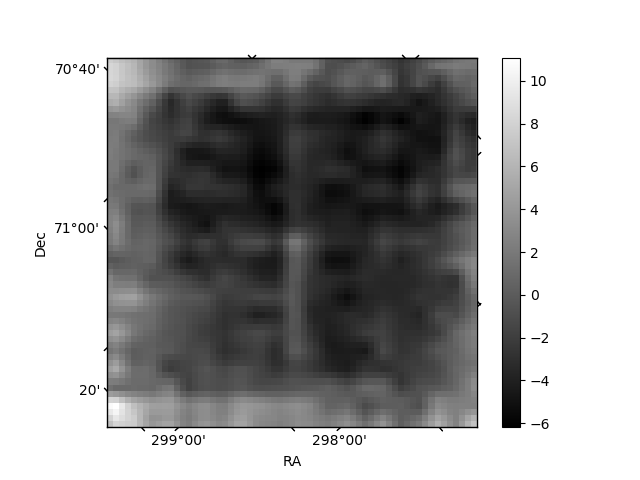
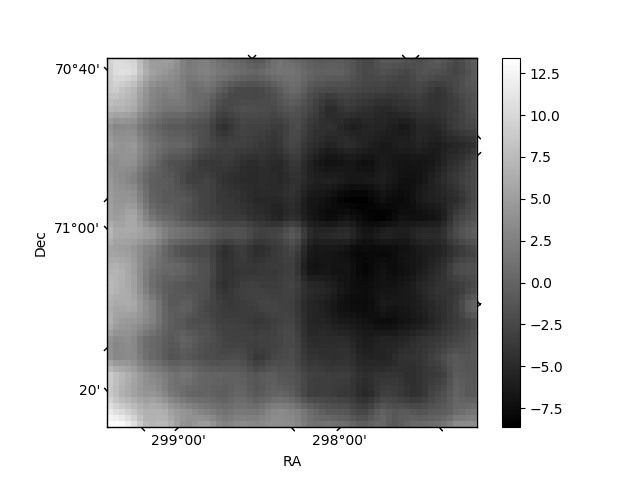
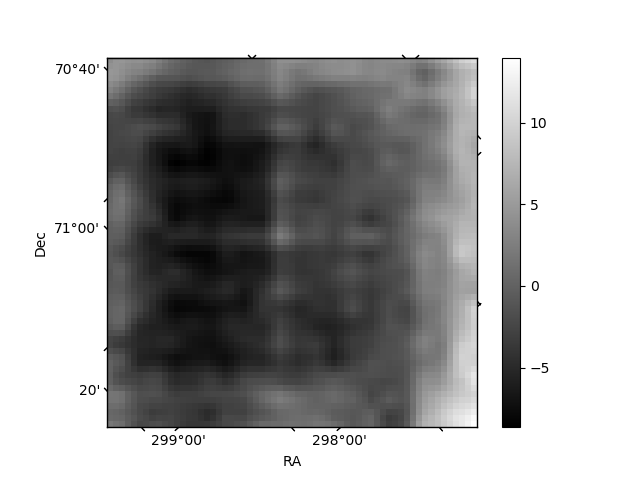
Histogram calculated using DETX and DETY for each event in the final _common_clean file
| Quadrant A | 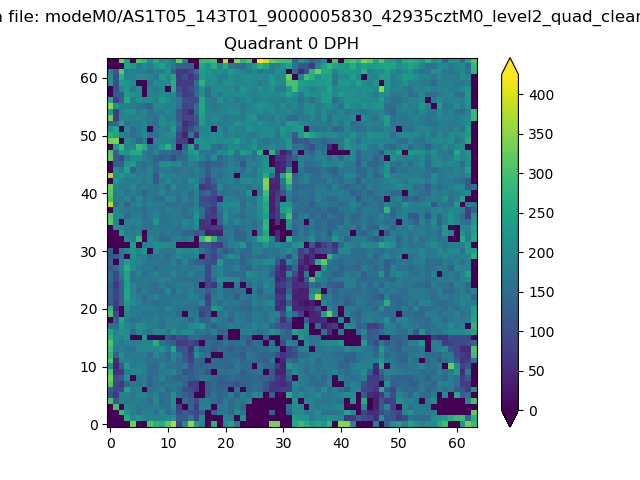 |
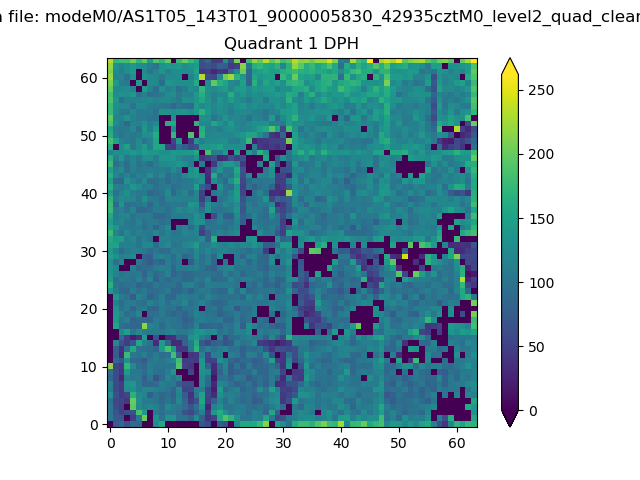 |
Quadrant B |
|---|---|---|---|
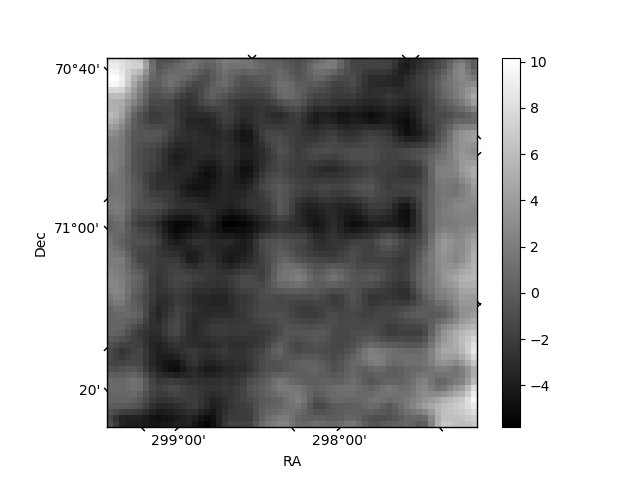
| Quadrant D | 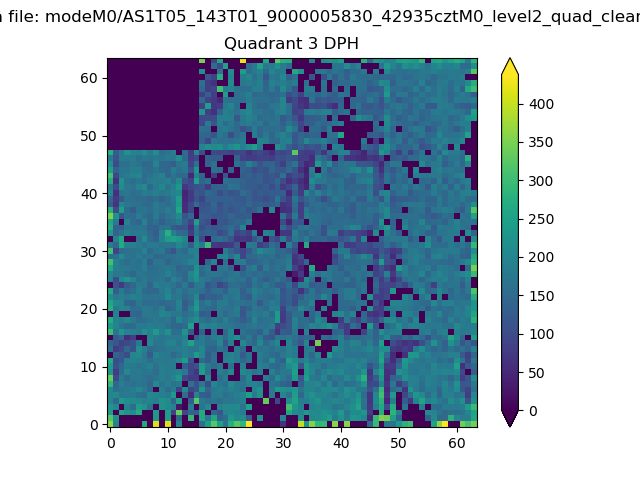 |
 |
Quadrant C |
| Plot type | Count rate plots | Images |
|---|---|---|
| Comparison with Poisson distribution Blue bars denote a histogram of data divided into 1 sec bins. Red curve is a Poisson curve with rate = median count rate of data. |
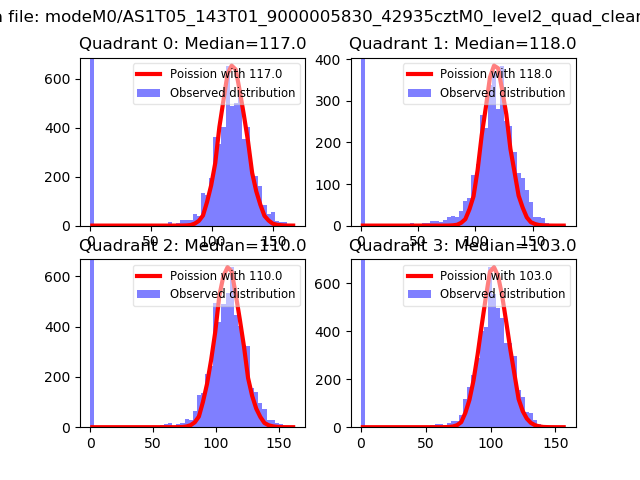 |
 |
| Quadrant-wise count rates Data is divided into 100 sec bins |
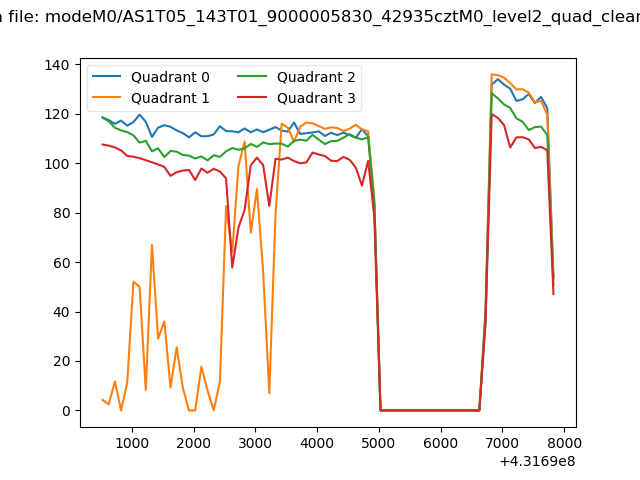 |
|
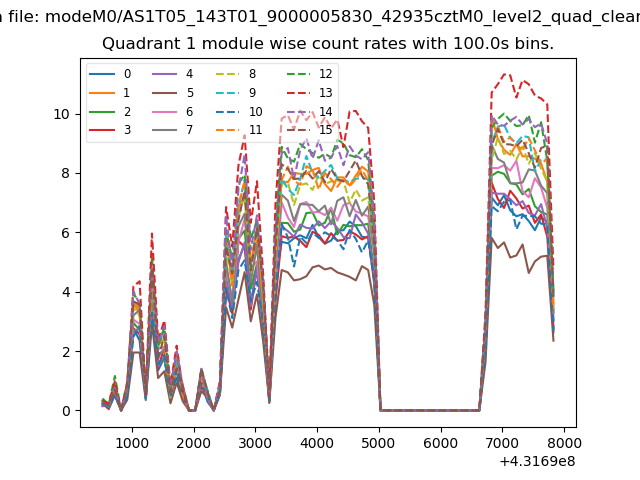
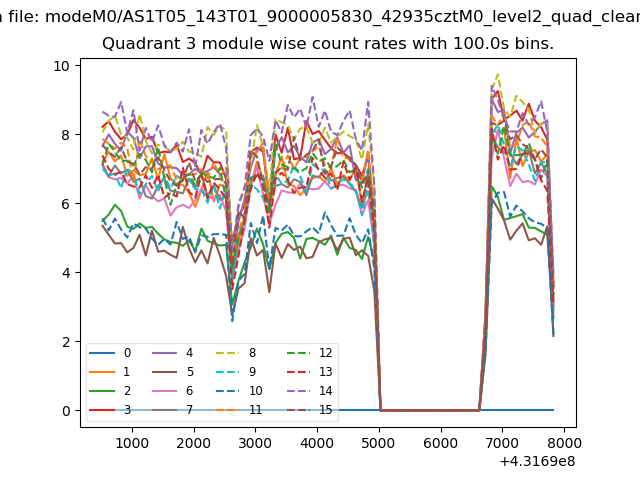
| Module-wise count rates for Quadrant A Data is divided into 100 sec bins |
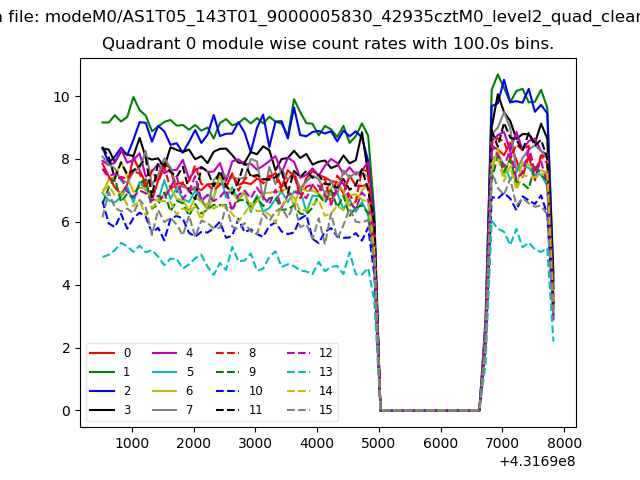 |
 |
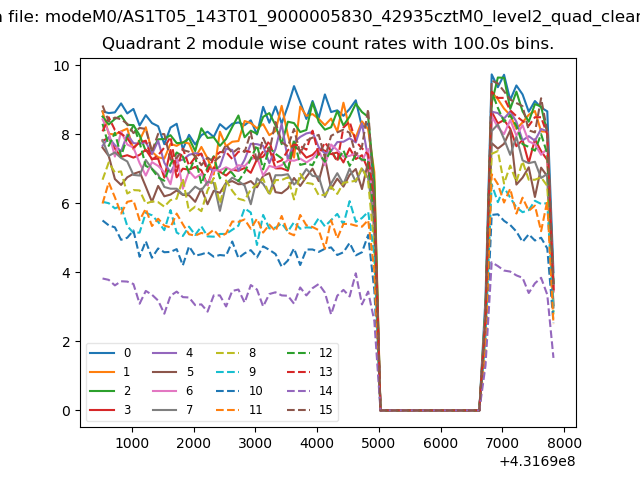
| Module-wise count rates for Quadrant B Data is divided into 100 sec bins |
 |
 |
| Module-wise count rates for Quadrant C Data is divided into 100 sec bins |
 |
 |
| Module-wise count rates for Quadrant D Data is divided into 100 sec bins |
 |
 |
| Parameter | Plot |
|---|---|
| CZT HV Monitor | 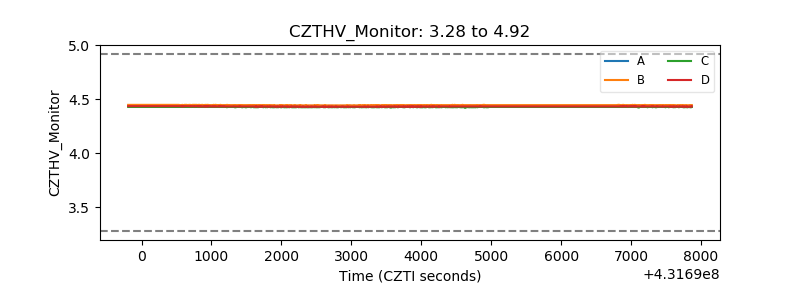 |
| D_VDD | 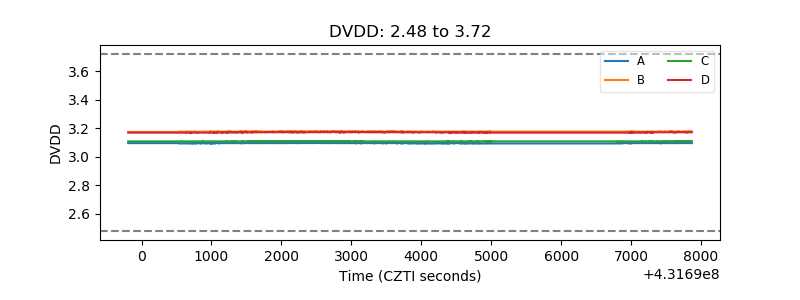 |
| Temperature 1 | 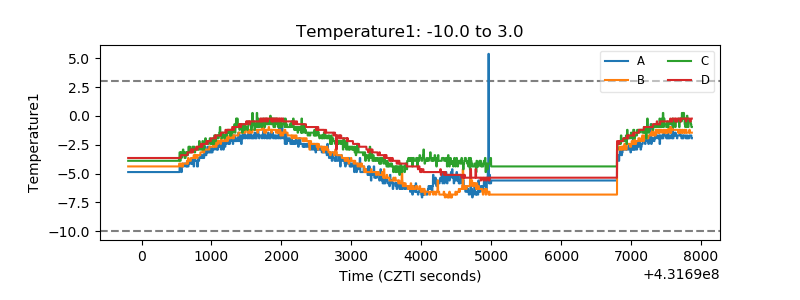 |
| Veto HV Monitor | 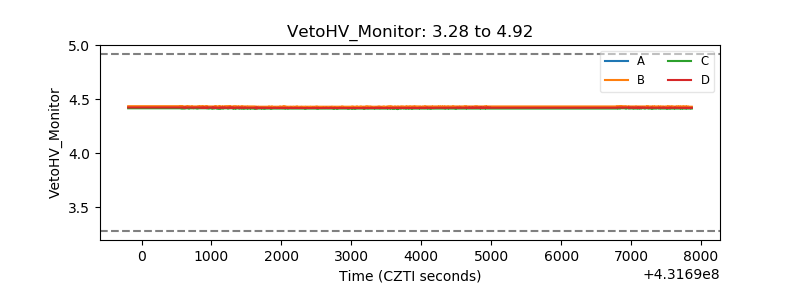 |
| Veto LLD | 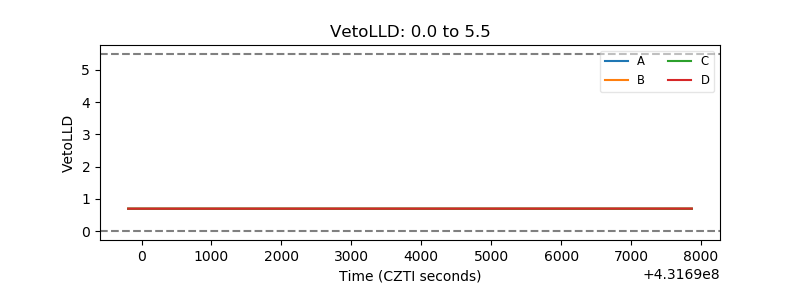 |
| Alpha Counter | 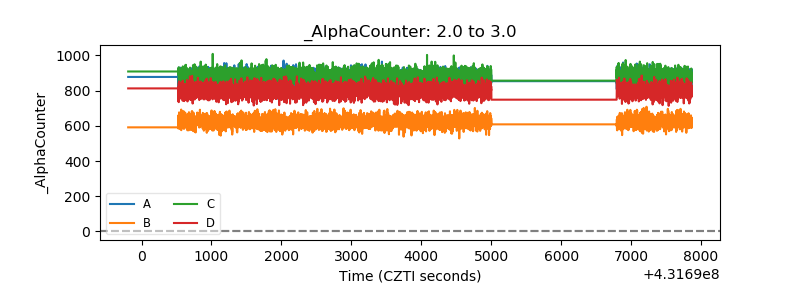 |
| _CPM_Rate | 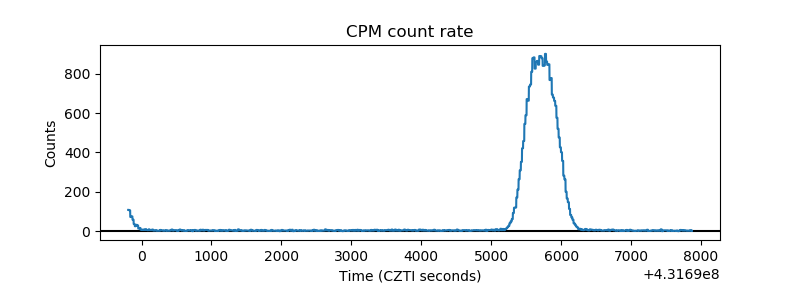 |
| CZT Counter | 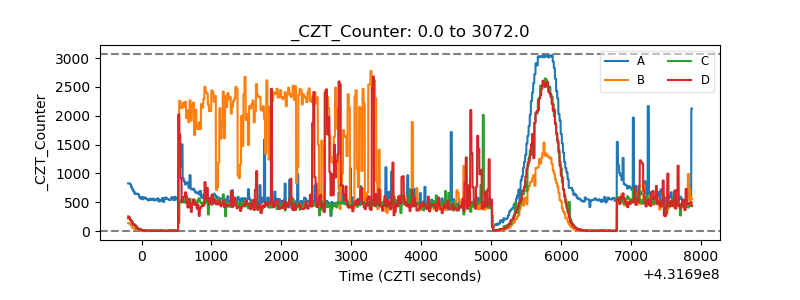 |
| +2.5 Volts monitor | 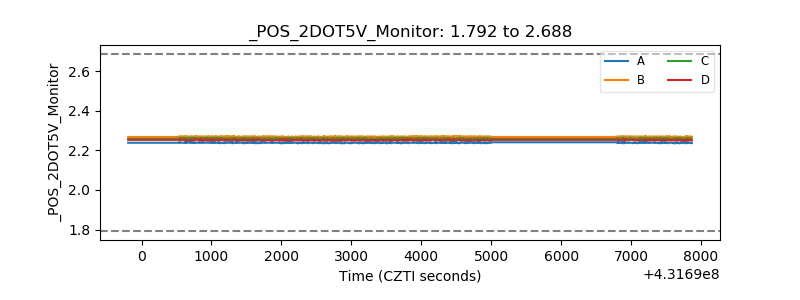 |
| +5 Volts monitor | 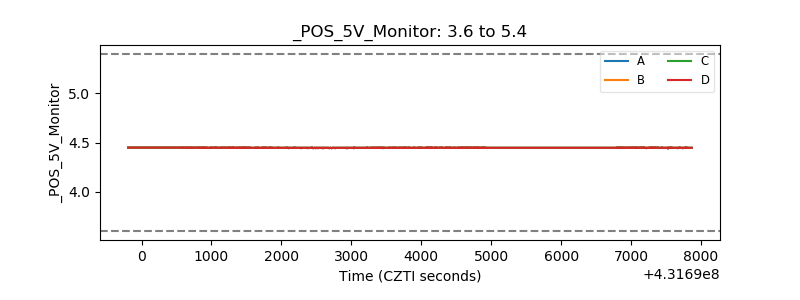 |
| _ROLL_ROT | 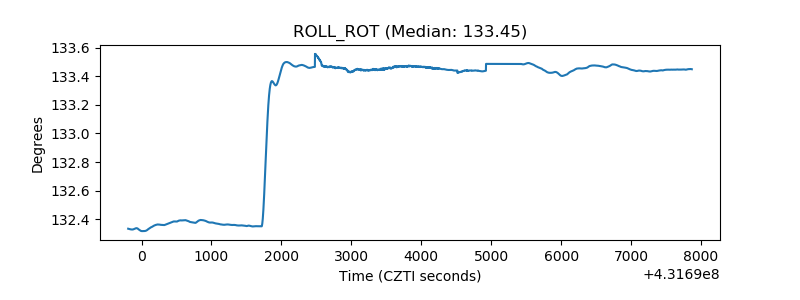 |
| _Roll_DEC | 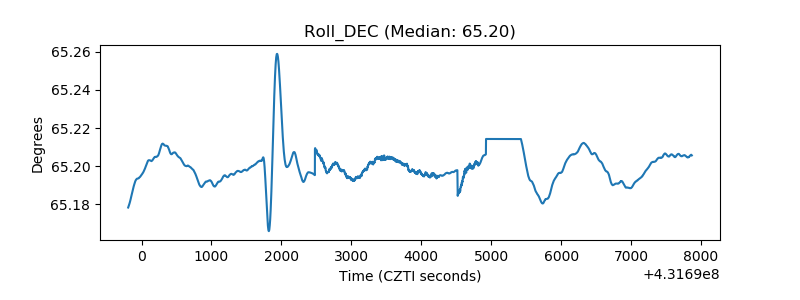 |
| _Roll_RA | 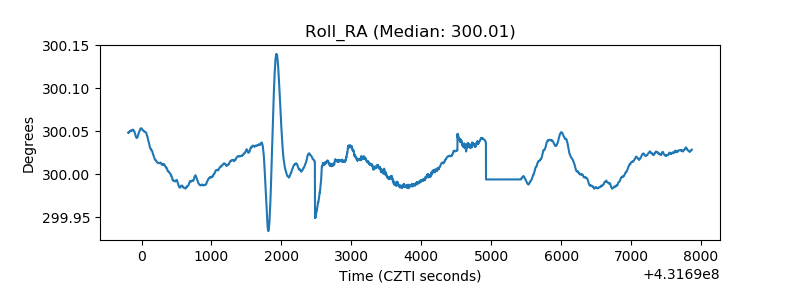 |
| Veto Counter | 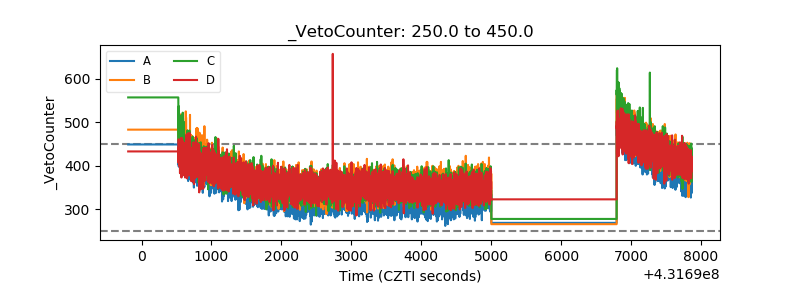 |