| Param | Original file | Final file |
|---|---|---|
| Filename | modeM0/AS1T05_143T01_9000005830_42936cztM0_level2.fits | modeM0/AS1T05_143T01_9000005830_42936cztM0_level2_quad_clean.evt |
| Size (bytes) | 341,703,360 | 96,131,520 |
| Size | 325.9 MB | 91.7 MB |
| Events in quadrant A | 3,190,056 | 663,702 |
| Events in quadrant B | 2,771,913 | 665,057 |
| Events in quadrant C | 2,678,808 | 625,560 |
| Events in quadrant D | 3,586,955 | 578,031 |
| Mode M0 | |||
|---|---|---|---|
| Quadrant | BADHDUFLAG | Total packets | Discarded packets |
| A | 0 | 12836 | 2 |
| B | 0 | 11804 | 2 |
| C | 0 | 11194 | 2 |
| D | 0 | 14264 | 2 |
| Mode M9 | |||
|---|---|---|---|
| Quadrant | BADHDUFLAG | Total packets | Discarded packets |
| A | 0 | 31 | 0 |
| B | 0 | 32 | 0 |
| C | 0 | 32 | 0 |
| D | 0 | 32 | 0 |
| Mode SS | |||
|---|---|---|---|
| Quadrant | BADHDUFLAG | Total packets | Discarded packets |
| A | 0 | 110 | 0 |
| B | 0 | 110 | 0 |
| C | 0 | 110 | 0 |
| D | 0 | 110 | 0 |
| Quadrant | Total seconds | Saturated seconds | Saturation percentage |
|---|---|---|---|
| A | 5409 | 58 | 1.072287% |
| B | 5409 | 71 | 1.312627% |
| C | 5409 | 15 | 0.277316% |
| D | 5409 | 103 | 1.904234% |
Noise dominated data is calculated using 1-second bins in cleaned event files. If a bin has >2000 counts, and if more than 50% of those come from <1% of pixels, then it is considered to be noise-dominated and hence unusable.
| Quadrant | # 1 sec bins | Bins with >0 counts | Bins with >2000 counts | High rate bins dominated by noise | Noise dominated (total time) | Noise dominated (detector-on time) | Marked lightcurve |
|---|---|---|---|---|---|---|---|
| A | 7292 | 5410 | 35 | 35 | 0.48% | 0.65% | 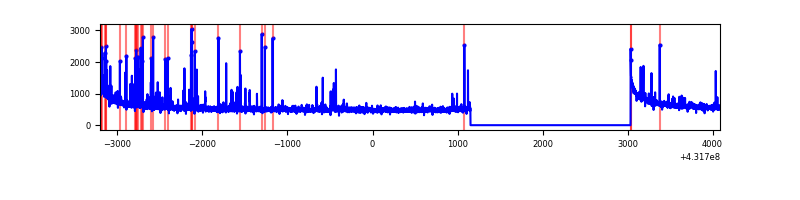 |
| B | 7292 | 5410 | 54 | 54 | 0.74% | 1.00% | 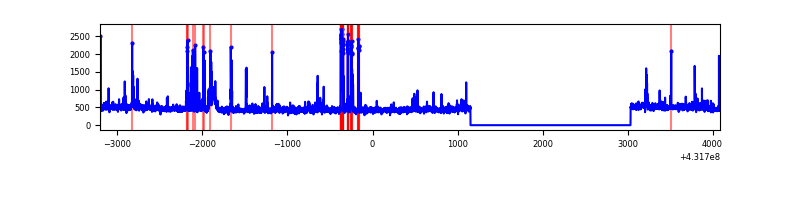 |
| C | 7292 | 5410 | 13 | 13 | 0.18% | 0.24% | 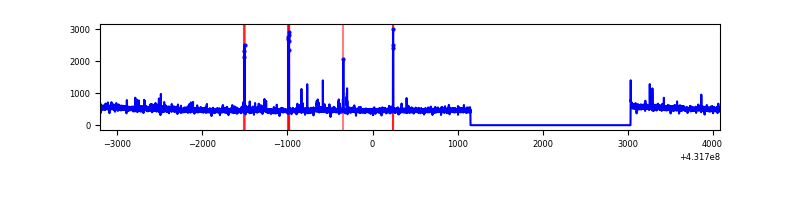 |
| D | 7292 | 5410 | 122 | 122 | 1.67% | 2.26% | 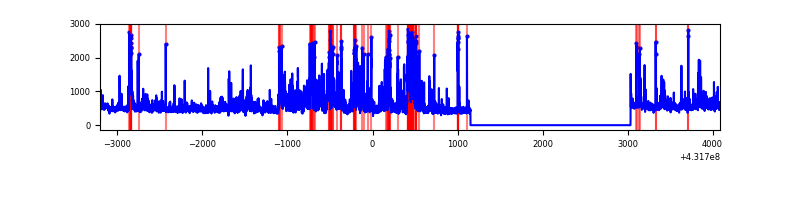 |
Top three noisy pixels from each quadrant. If the there are fewer than three noisy pixels in the level2.evt file, extra rows are filled as -1
| Pixel properties | Quadrant properties | ||||||
|---|---|---|---|---|---|---|---|
| Quadrant | DetID | PixID | Counts | Sigma | Mean | Median | Sigma |
| A | 10 | 83 | 609562 | 4804.15 | 620 | 609 | 126.8 |
| A | 15 | 222 | 155527 | 1222.18 | 620 | 609 | 126.8 |
| A | 13 | 248 | 27004 | 208.24 | 620 | 609 | 126.8 |
| B | 4 | 81 | 152041 | 1292.82 | 609 | 591 | 117.1 |
| B | 4 | 171 | 135468 | 1151.35 | 609 | 591 | 117.1 |
| B | 15 | 32 | 56507 | 477.32 | 609 | 591 | 117.1 |
| C | 15 | 214 | 235558 | 1681.15 | 601 | 605 | 139.8 |
| C | 12 | 249 | 50855 | 359.55 | 601 | 605 | 139.8 |
| C | 14 | 254 | 34253 | 240.76 | 601 | 605 | 139.8 |
| D | 1 | 47 | 474447 | 3267.37 | 601 | 584 | 145.0 |
| D | 12 | 233 | 351991 | 2423.02 | 601 | 584 | 145.0 |
| D | 12 | 6 | 190873 | 1312.08 | 601 | 584 | 145.0 |
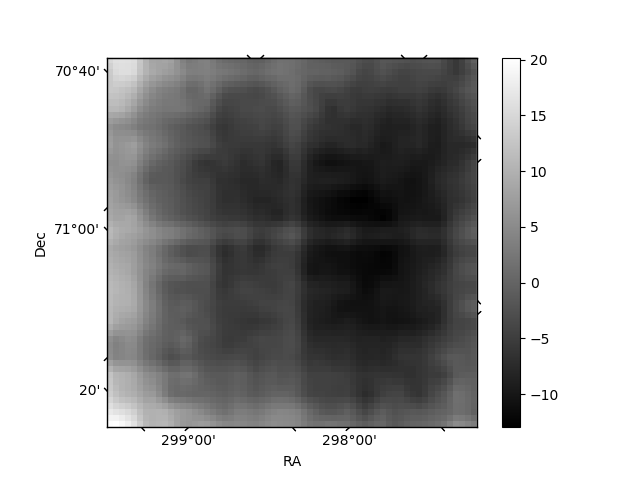
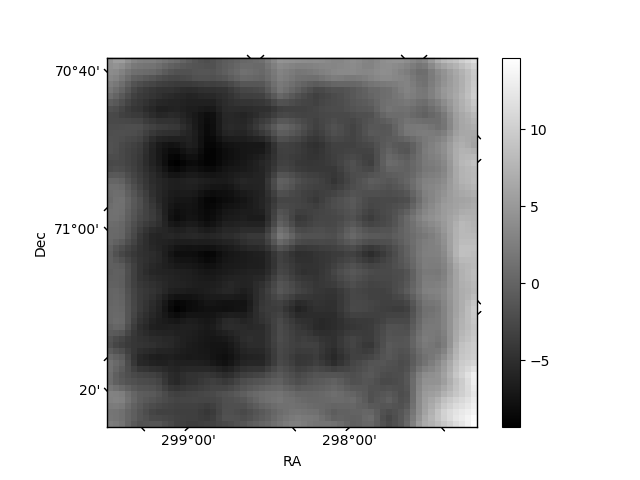
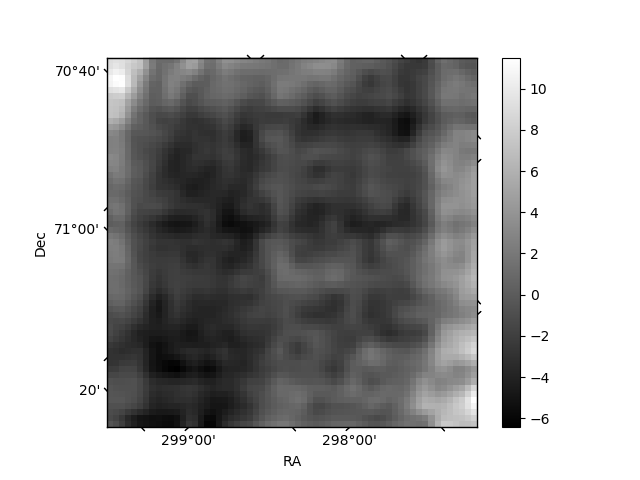
Histogram calculated using DETX and DETY for each event in the final _common_clean file
| Quadrant A | 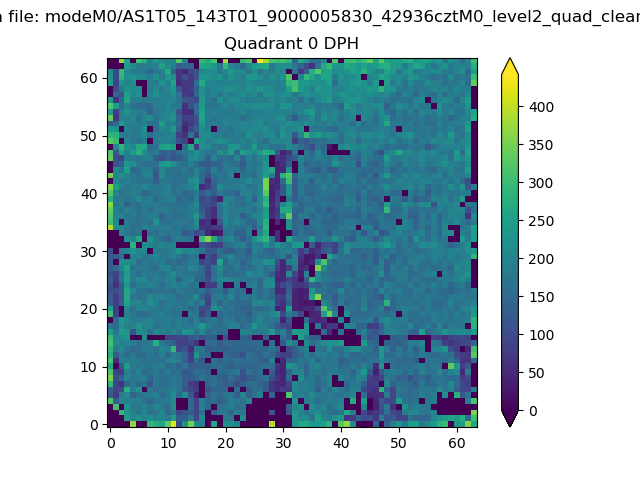 |
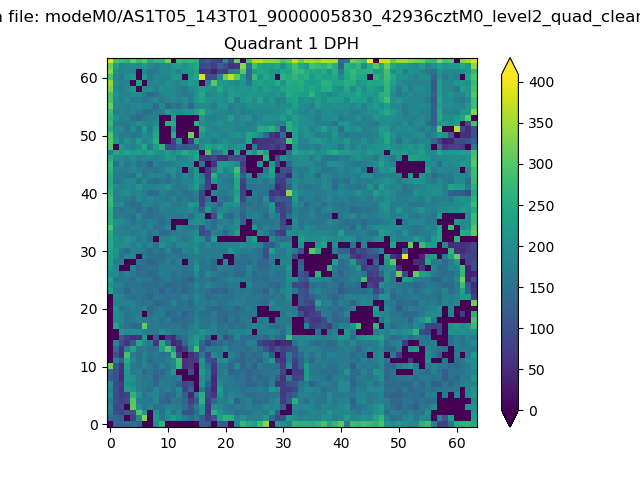 |
Quadrant B |
|---|---|---|---|
| Quadrant D | 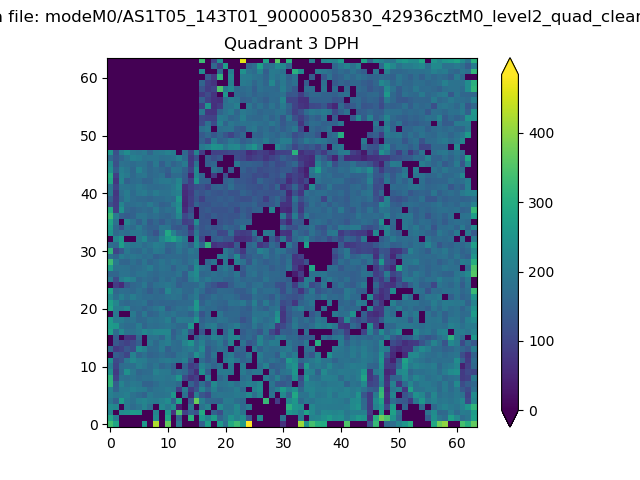 |
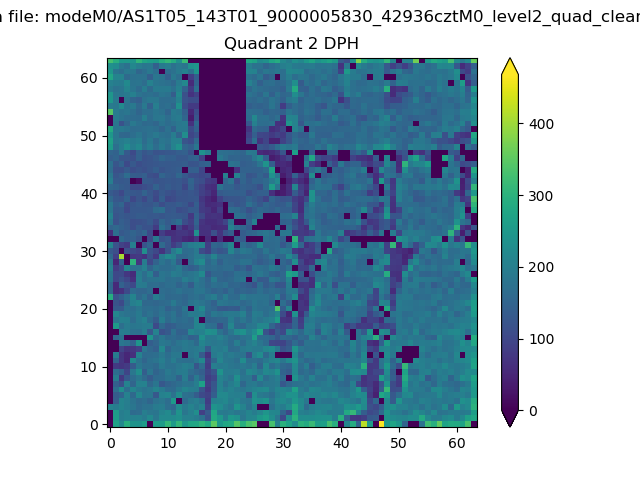 |
Quadrant C |
| Plot type | Count rate plots | Images |
|---|---|---|
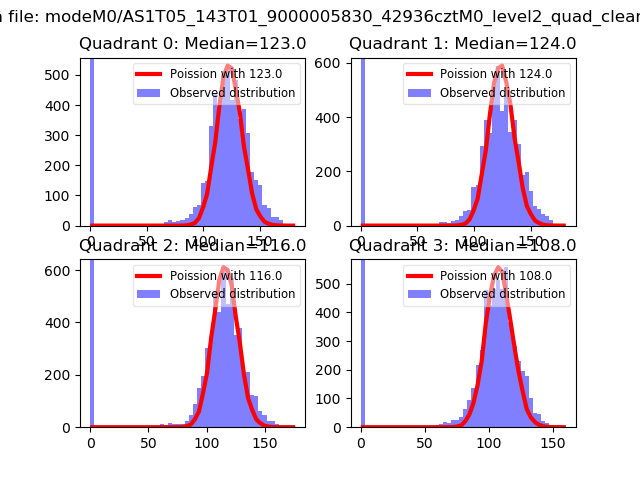
| Comparison with Poisson distribution Blue bars denote a histogram of data divided into 1 sec bins. Red curve is a Poisson curve with rate = median count rate of data. |
 |
 |
| Quadrant-wise count rates Data is divided into 100 sec bins |
 |
|
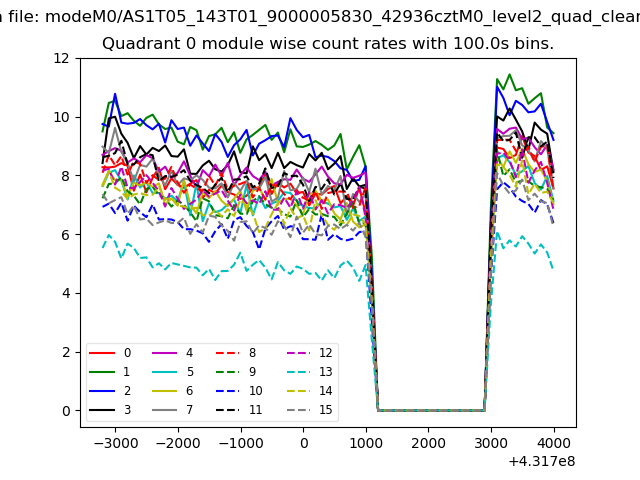
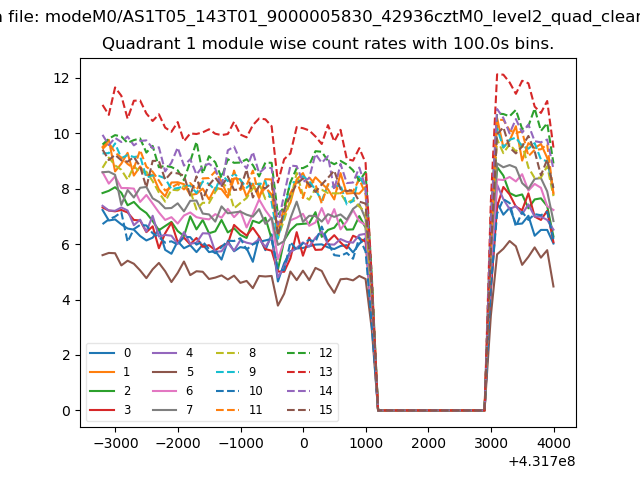
| Module-wise count rates for Quadrant A Data is divided into 100 sec bins |
 |
 |
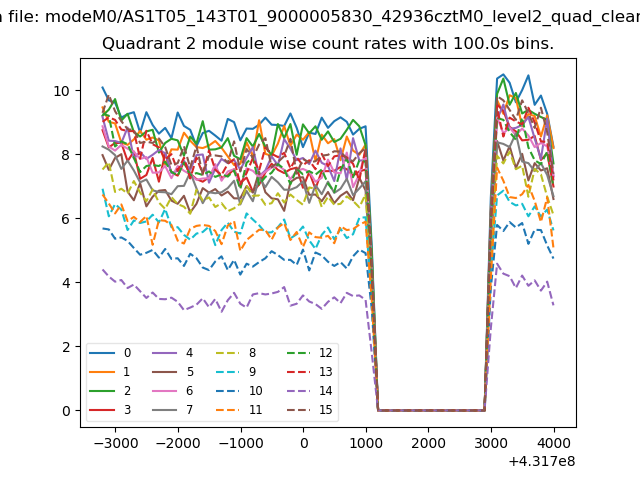
| Module-wise count rates for Quadrant B Data is divided into 100 sec bins |
 |
 |
| Module-wise count rates for Quadrant C Data is divided into 100 sec bins |
 |
 |
| Module-wise count rates for Quadrant D Data is divided into 100 sec bins |
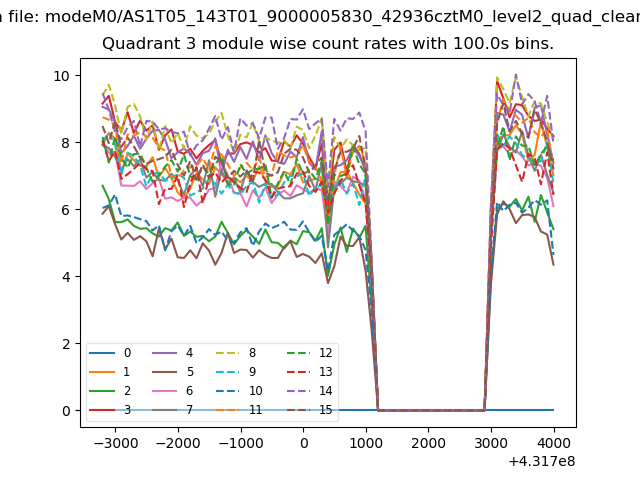 |
 |
| Parameter | Plot |
|---|---|
| CZT HV Monitor | 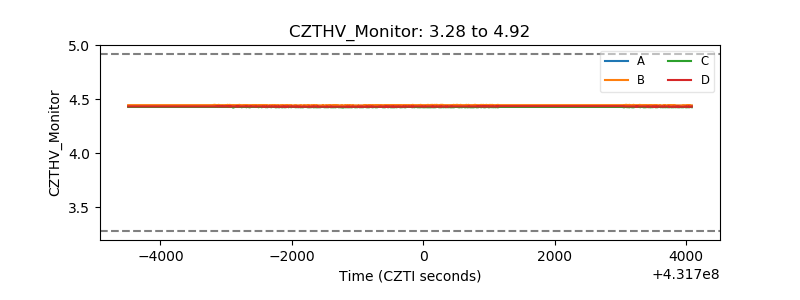 |
| D_VDD | 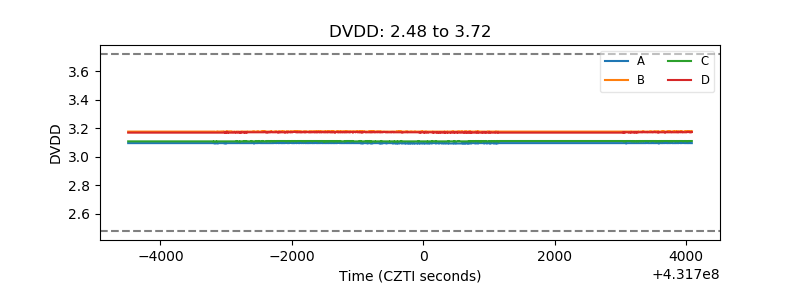 |
| Temperature 1 | 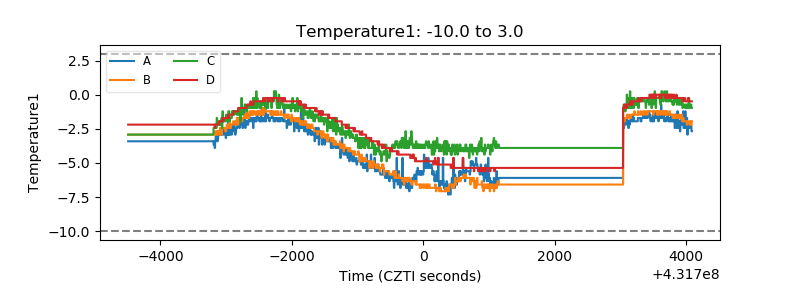 |
| Veto HV Monitor | 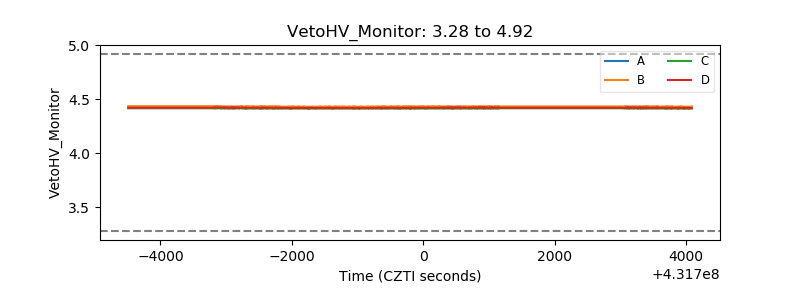 |
| Veto LLD | 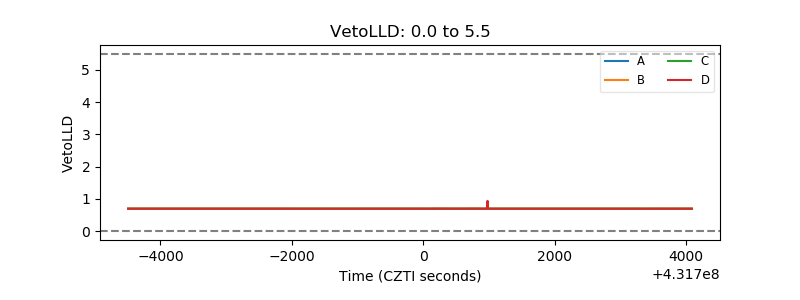 |
| Alpha Counter | 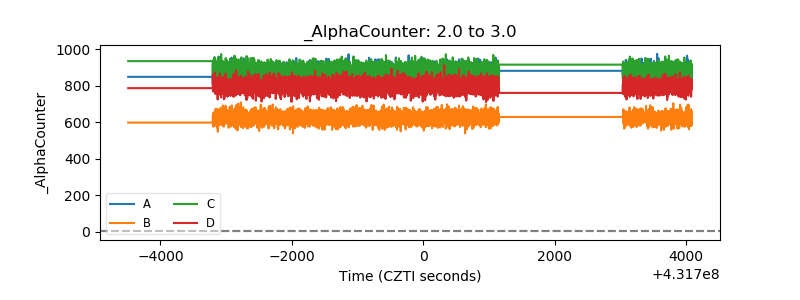 |
| _CPM_Rate | 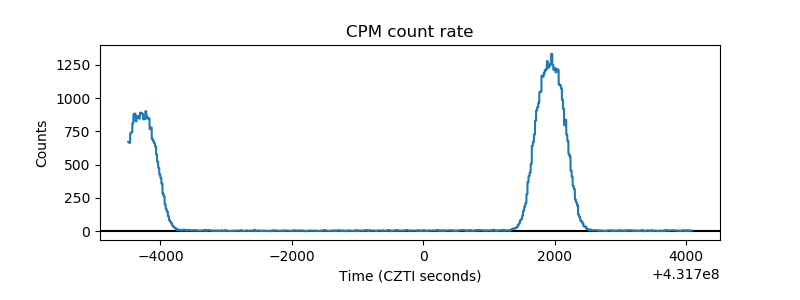 |
| CZT Counter | 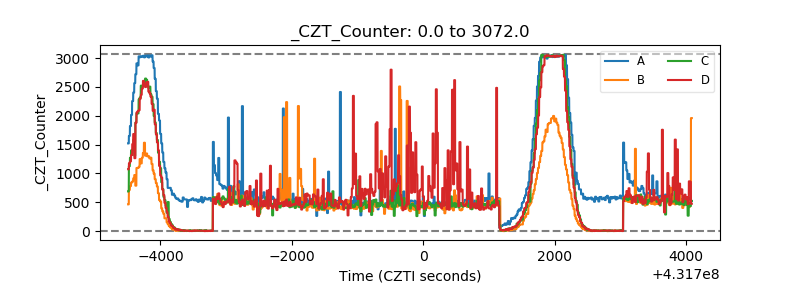 |
| +2.5 Volts monitor | 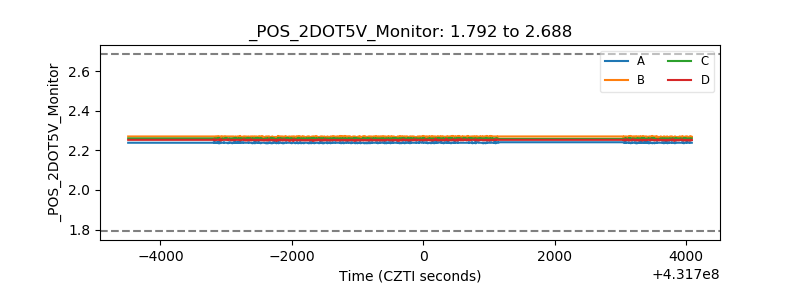 |
| +5 Volts monitor | 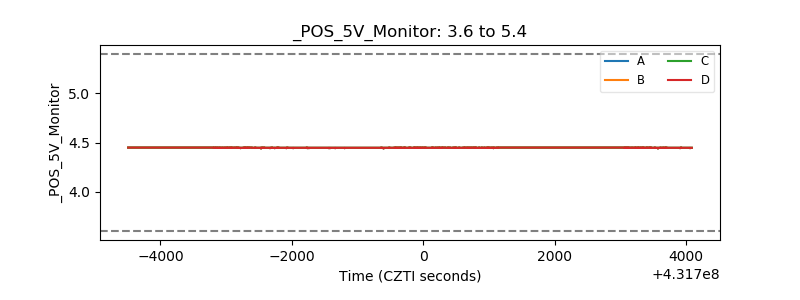 |
| _ROLL_ROT | 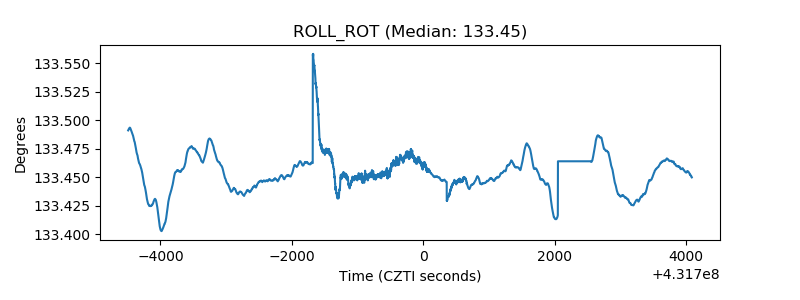 |
| _Roll_DEC | 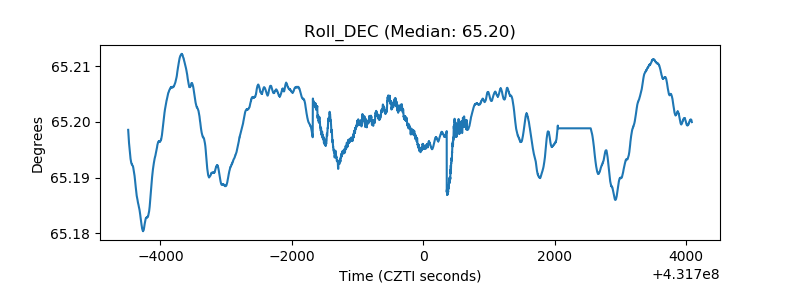 |
| _Roll_RA | 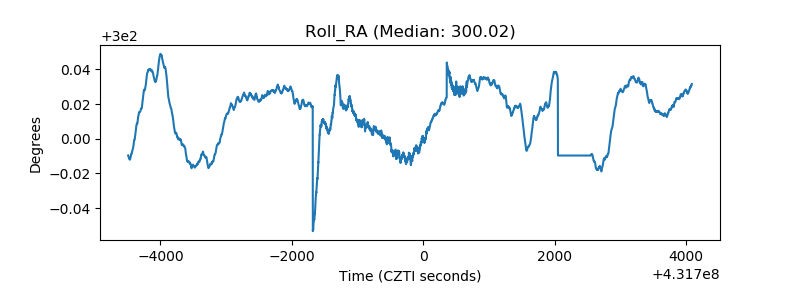 |
| Veto Counter | 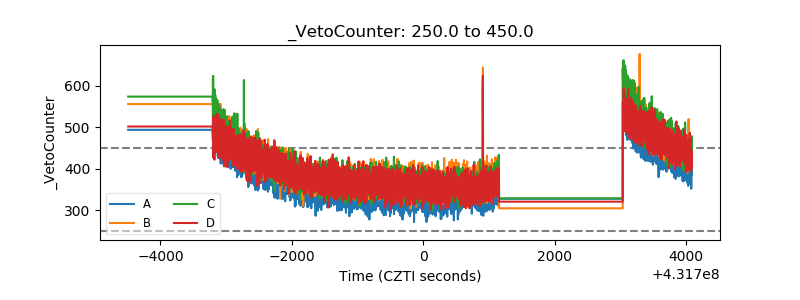 |