| Param | Original file | Final file |
|---|---|---|
| Filename | modeM0/AS1T05_143T01_9000005830_42937cztM0_level2.fits | modeM0/AS1T05_143T01_9000005830_42937cztM0_level2_quad_clean.evt |
| Size (bytes) | 379,425,600 | 92,917,440 |
| Size | 361.8 MB | 88.6 MB |
| Events in quadrant A | 3,141,042 | 654,739 |
| Events in quadrant B | 2,575,570 | 661,621 |
| Events in quadrant C | 2,627,665 | 626,488 |
| Events in quadrant D | 5,294,877 | 505,435 |
| Mode M0 | |||
|---|---|---|---|
| Quadrant | BADHDUFLAG | Total packets | Discarded packets |
| A | 0 | 12572 | 2 |
| B | 0 | 11074 | 2 |
| C | 0 | 10849 | 2 |
| D | 0 | 19268 | 6 |
| Mode M9 | |||
|---|---|---|---|
| Quadrant | BADHDUFLAG | Total packets | Discarded packets |
| A | 0 | 24 | 0 |
| B | 0 | 25 | 0 |
| C | 0 | 25 | 0 |
| D | 0 | 25 | 0 |
| Mode SS | |||
|---|---|---|---|
| Quadrant | BADHDUFLAG | Total packets | Discarded packets |
| A | 0 | 106 | 0 |
| B | 0 | 106 | 0 |
| C | 0 | 106 | 0 |
| D | 0 | 106 | 0 |
| Quadrant | Total seconds | Saturated seconds | Saturation percentage |
|---|---|---|---|
| A | 5215 | 32 | 0.613615% |
| B | 5215 | 32 | 0.613615% |
| C | 5215 | 16 | 0.306807% |
| D | 5214 | 810 | 15.535098% |
Noise dominated data is calculated using 1-second bins in cleaned event files. If a bin has >2000 counts, and if more than 50% of those come from <1% of pixels, then it is considered to be noise-dominated and hence unusable.
| Quadrant | # 1 sec bins | Bins with >0 counts | Bins with >2000 counts | High rate bins dominated by noise | Noise dominated (total time) | Noise dominated (detector-on time) | Marked lightcurve |
|---|---|---|---|---|---|---|---|
| A | 7218 | 5216 | 14 | 14 | 0.19% | 0.27% | 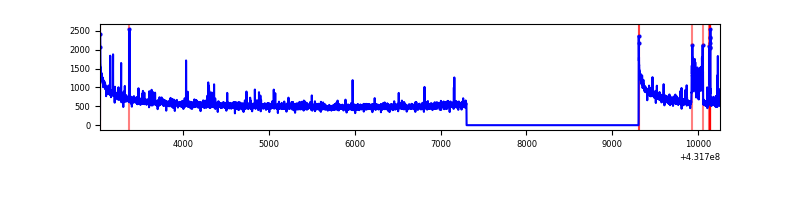 |
| B | 7218 | 5216 | 19 | 19 | 0.26% | 0.36% | 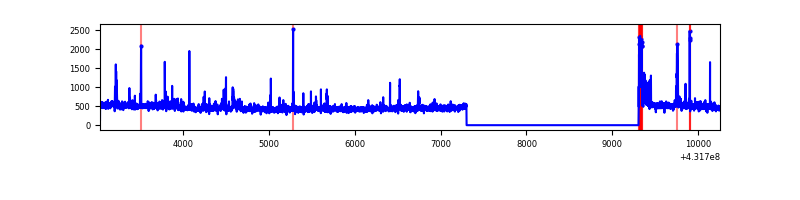 |
| C | 7218 | 5216 | 14 | 14 | 0.19% | 0.27% | 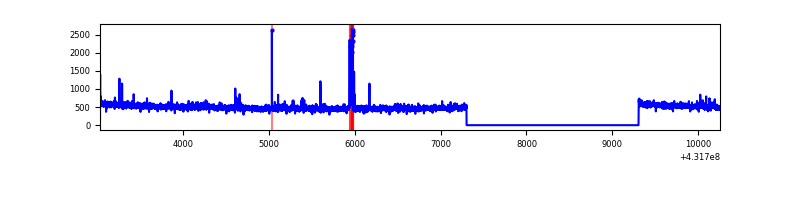 |
| D | 7216 | 5214 | 824 | 824 | 11.42% | 15.80% | 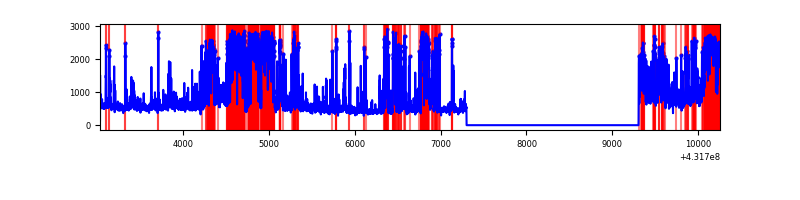 |
Top three noisy pixels from each quadrant. If the there are fewer than three noisy pixels in the level2.evt file, extra rows are filled as -1
| Pixel properties | Quadrant properties | ||||||
|---|---|---|---|---|---|---|---|
| Quadrant | DetID | PixID | Counts | Sigma | Mean | Median | Sigma |
| A | 10 | 83 | 608719 | 4901.79 | 605 | 594 | 124.1 |
| A | 15 | 222 | 168578 | 1354.04 | 605 | 594 | 124.1 |
| A | 13 | 248 | 13436 | 103.51 | 605 | 594 | 124.1 |
| B | 4 | 81 | 101725 | 877.32 | 598 | 581 | 115.3 |
| B | 4 | 171 | 53916 | 462.63 | 598 | 581 | 115.3 |
| B | 5 | 255 | 15297 | 127.65 | 598 | 581 | 115.3 |
| C | 15 | 214 | 229425 | 1695.91 | 591 | 595 | 134.9 |
| C | 14 | 254 | 65527 | 481.23 | 591 | 595 | 134.9 |
| C | 3 | 233 | 19249 | 138.25 | 591 | 595 | 134.9 |
| D | 1 | 52 | 1084425 | 7946.08 | 561 | 545 | 136.4 |
| D | 12 | 233 | 679658 | 4978.68 | 561 | 545 | 136.4 |
| D | 12 | 6 | 504628 | 3695.51 | 561 | 545 | 136.4 |
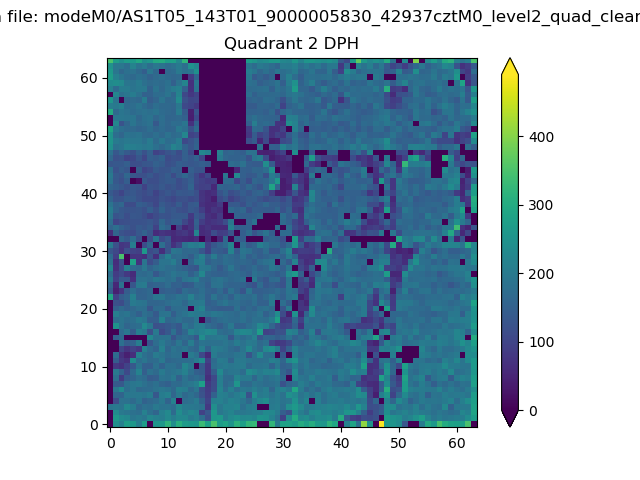
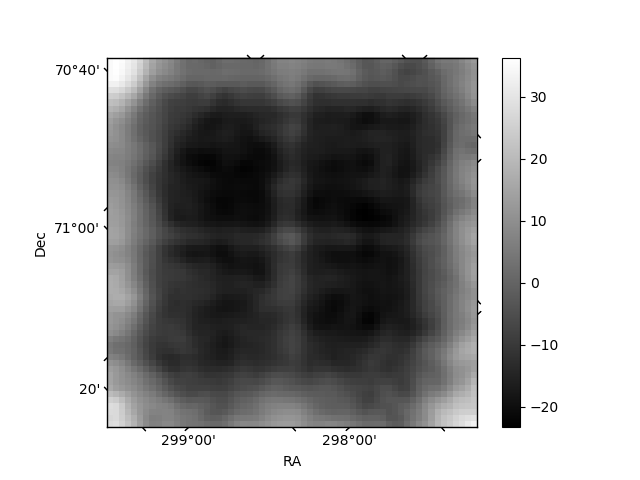
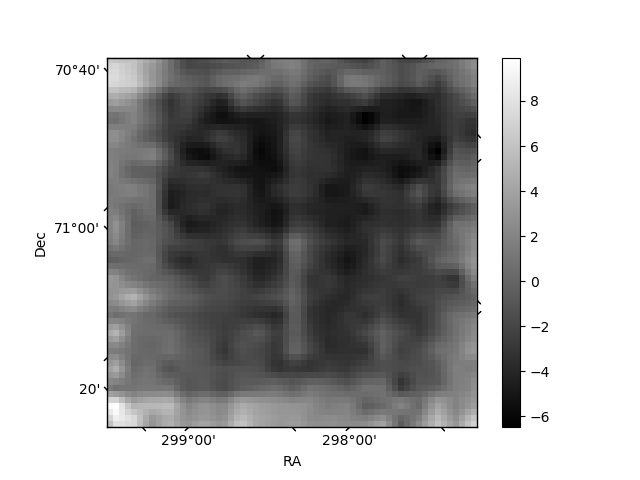
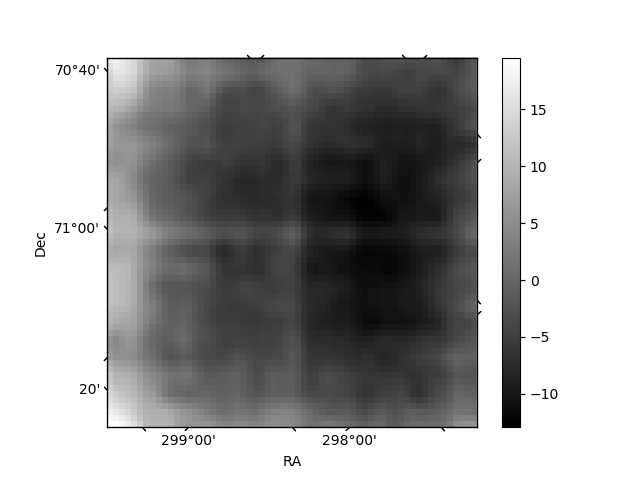
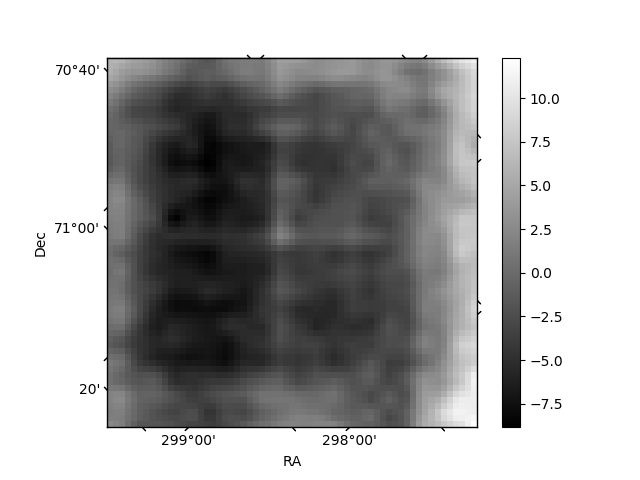
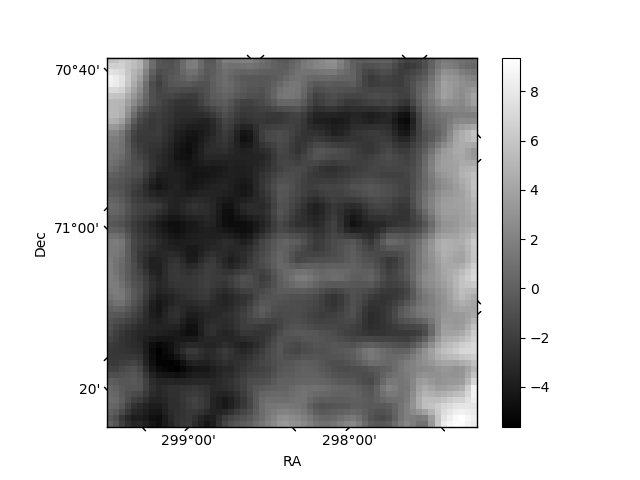
Histogram calculated using DETX and DETY for each event in the final _common_clean file
| Quadrant A | 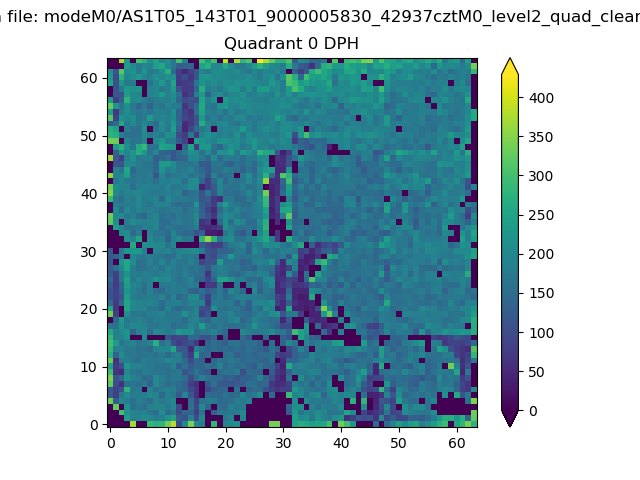 |
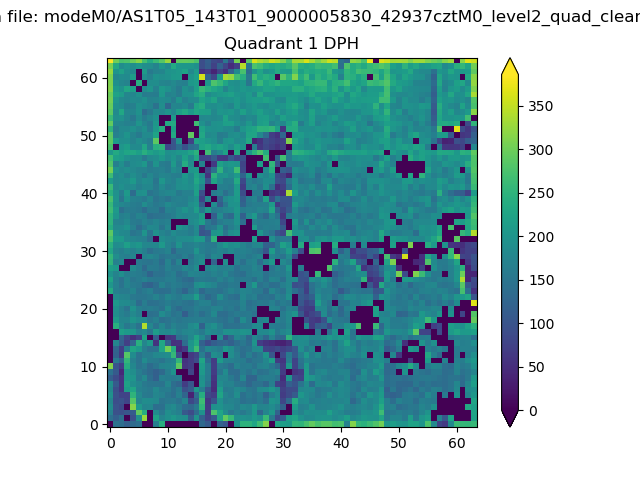 |
Quadrant B |
|---|---|---|---|
| Quadrant D | 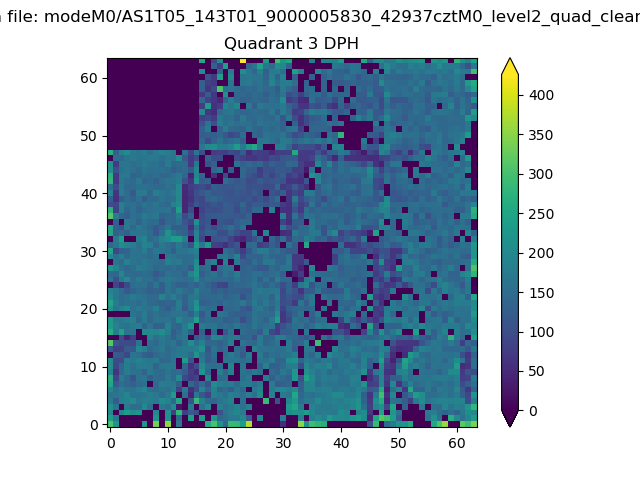 |
 |
Quadrant C |
| Plot type | Count rate plots | Images |
|---|---|---|
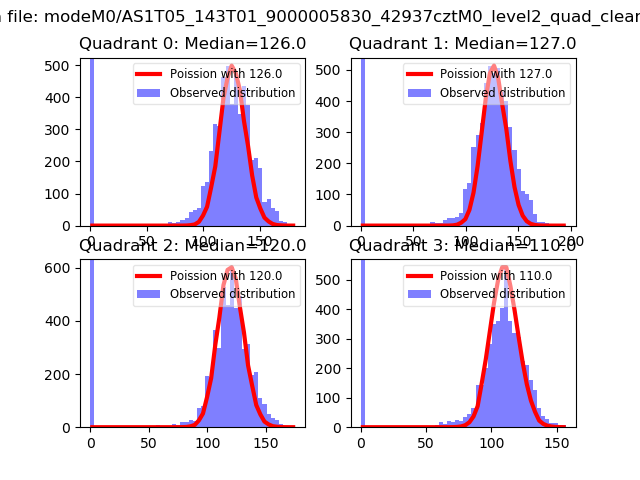
| Comparison with Poisson distribution Blue bars denote a histogram of data divided into 1 sec bins. Red curve is a Poisson curve with rate = median count rate of data. |
 |
 |
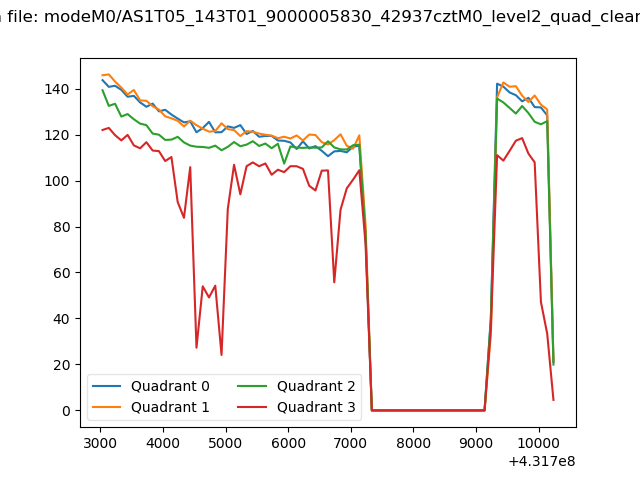
| Quadrant-wise count rates Data is divided into 100 sec bins |
 |
|
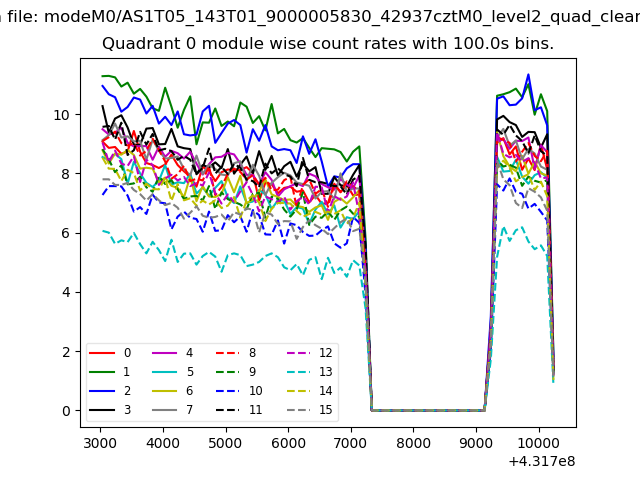
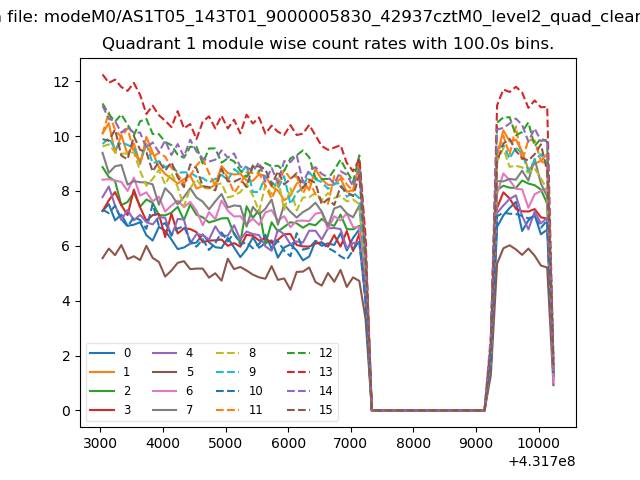
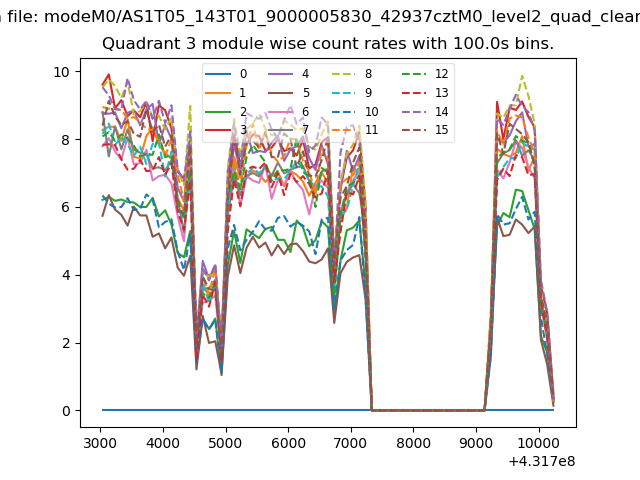
| Module-wise count rates for Quadrant A Data is divided into 100 sec bins |
 |
 |
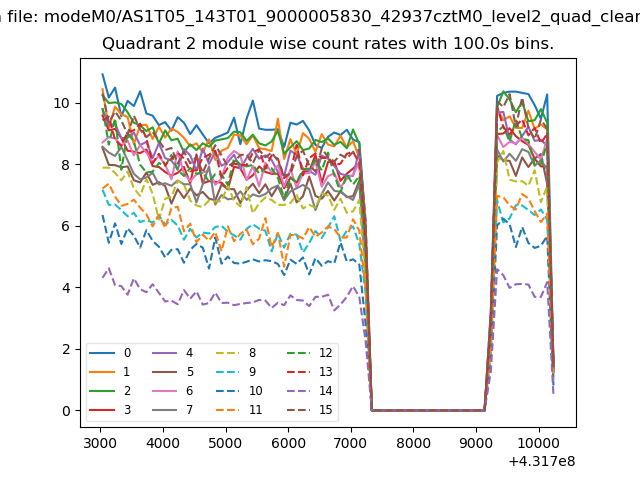
| Module-wise count rates for Quadrant B Data is divided into 100 sec bins |
 |
 |
| Module-wise count rates for Quadrant C Data is divided into 100 sec bins |
 |
 |
| Module-wise count rates for Quadrant D Data is divided into 100 sec bins |
 |
 |
| Parameter | Plot |
|---|---|
| CZT HV Monitor | 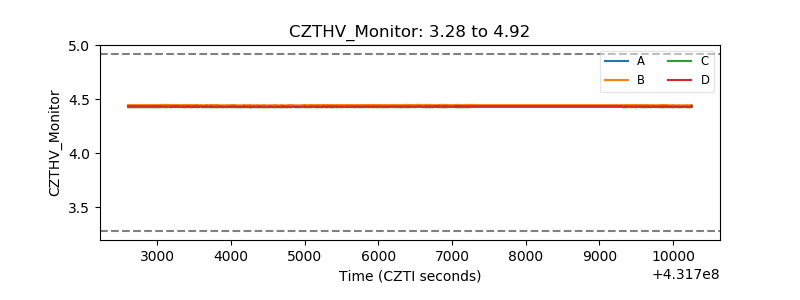 |
| D_VDD | 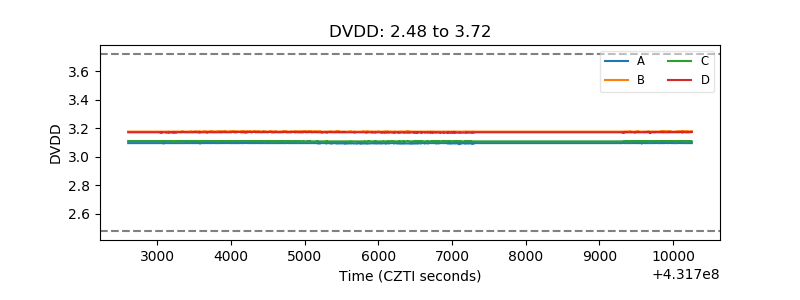 |
| Temperature 1 | 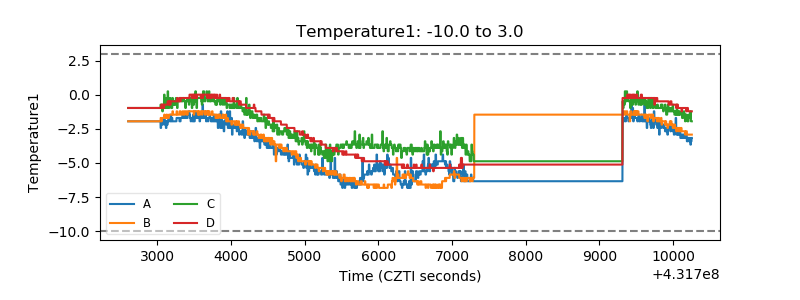 |
| Veto HV Monitor | 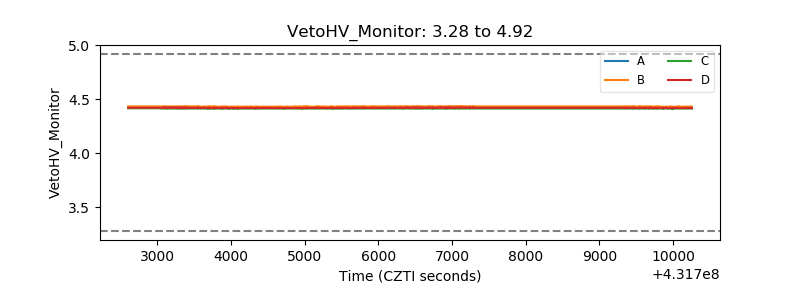 |
| Veto LLD | 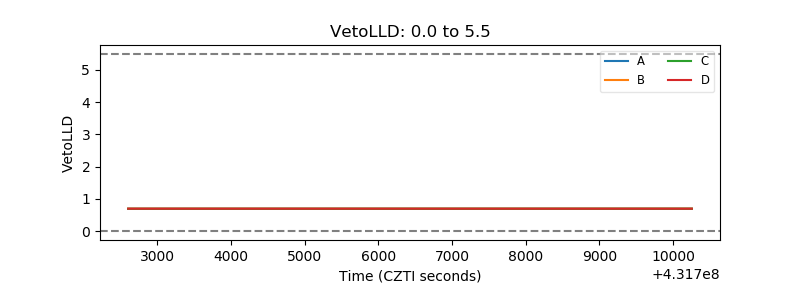 |
| Alpha Counter | 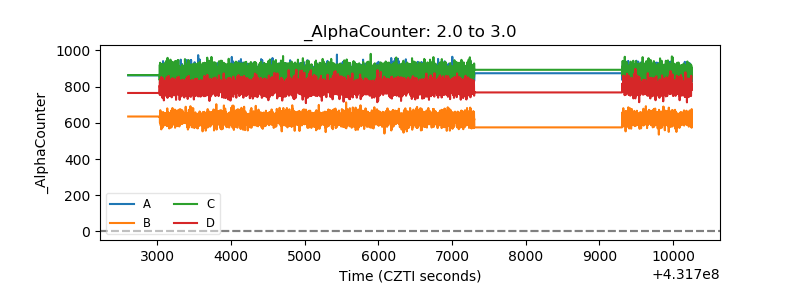 |
| _CPM_Rate | 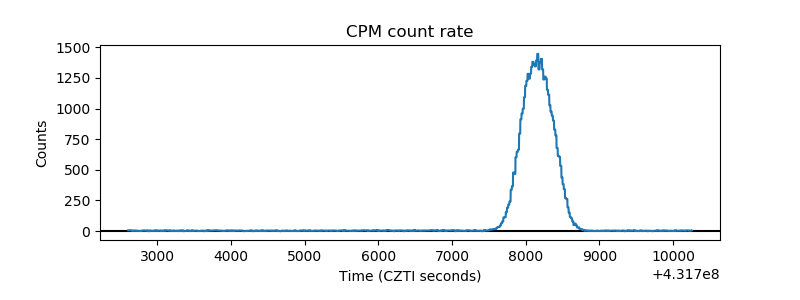 |
| CZT Counter | 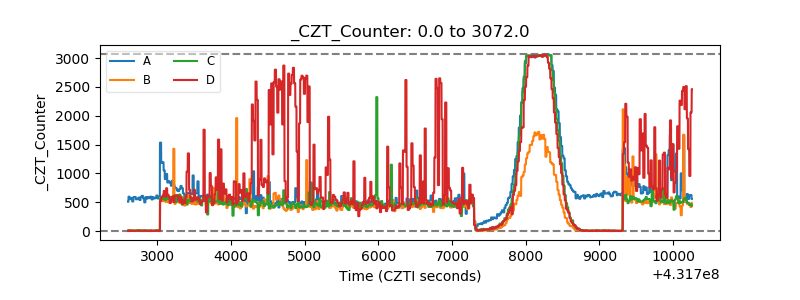 |
| +2.5 Volts monitor |  |
| +5 Volts monitor | 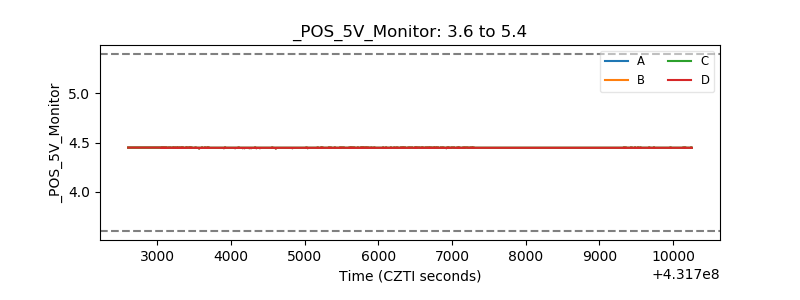 |
| _ROLL_ROT | 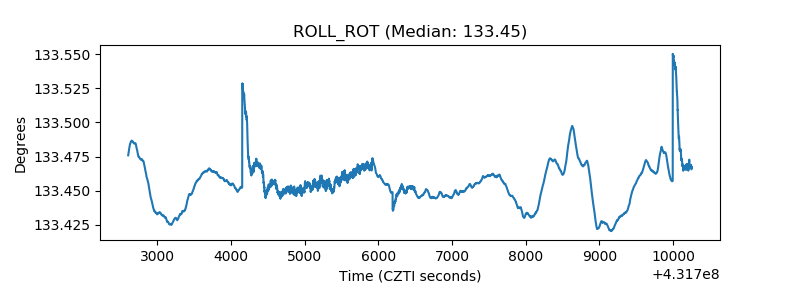 |
| _Roll_DEC | 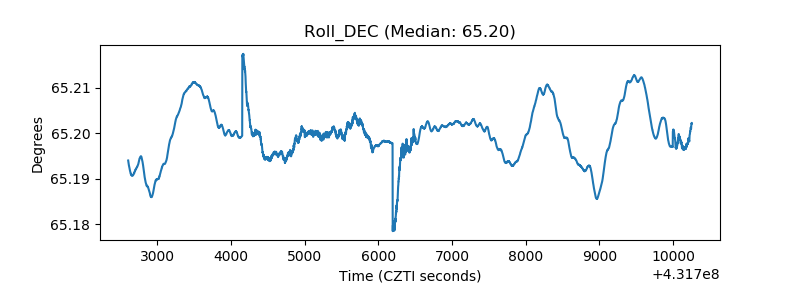 |
| _Roll_RA | 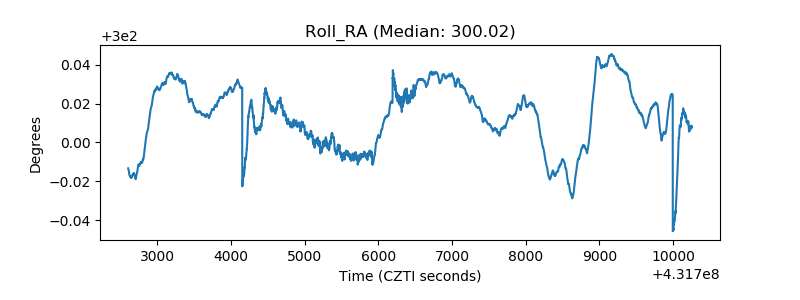 |
| Veto Counter | 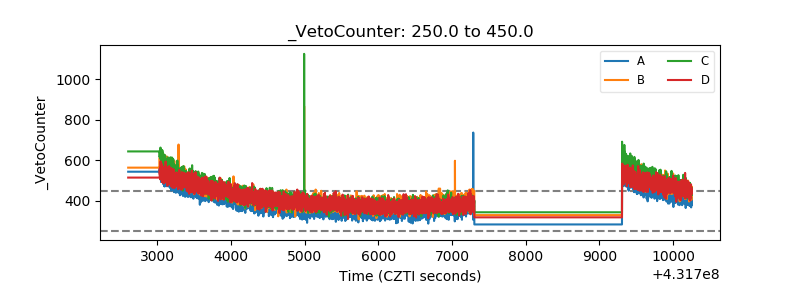 |