| Param | Original file | Final file |
|---|---|---|
| Filename | modeM0/AS1T05_143T01_9000005830_42939cztM0_level2.fits | modeM0/AS1T05_143T01_9000005830_42939cztM0_level2_quad_clean.evt |
| Size (bytes) | 339,062,400 | 85,026,240 |
| Size | 323.4 MB | 81.1 MB |
| Events in quadrant A | 3,277,496 | 579,181 |
| Events in quadrant B | 2,409,026 | 596,066 |
| Events in quadrant C | 2,378,573 | 573,067 |
| Events in quadrant D | 4,102,063 | 481,011 |
| Mode M0 | |||
|---|---|---|---|
| Quadrant | BADHDUFLAG | Total packets | Discarded packets |
| A | 0 | 12928 | 2 |
| B | 0 | 10517 | 2 |
| C | 0 | 10099 | 2 |
| D | 0 | 15798 | 2 |
| Mode M9 | |||
|---|---|---|---|
| Quadrant | BADHDUFLAG | Total packets | Discarded packets |
| A | 0 | 28 | 0 |
| B | 0 | 29 | 0 |
| C | 0 | 29 | 0 |
| D | 0 | 29 | 0 |
| Mode SS | |||
|---|---|---|---|
| Quadrant | BADHDUFLAG | Total packets | Discarded packets |
| A | 0 | 100 | 0 |
| B | 0 | 100 | 0 |
| C | 0 | 100 | 0 |
| D | 0 | 100 | 0 |
| Quadrant | Total seconds | Saturated seconds | Saturation percentage |
|---|---|---|---|
| A | 4927 | 67 | 1.359854% |
| B | 4927 | 53 | 1.075705% |
| C | 4927 | 18 | 0.365334% |
| D | 4926 | 553 | 11.226147% |
Noise dominated data is calculated using 1-second bins in cleaned event files. If a bin has >2000 counts, and if more than 50% of those come from <1% of pixels, then it is considered to be noise-dominated and hence unusable.
| Quadrant | # 1 sec bins | Bins with >0 counts | Bins with >2000 counts | High rate bins dominated by noise | Noise dominated (total time) | Noise dominated (detector-on time) | Marked lightcurve |
|---|---|---|---|---|---|---|---|
| A | 7079 | 4928 | 55 | 55 | 0.78% | 1.12% | 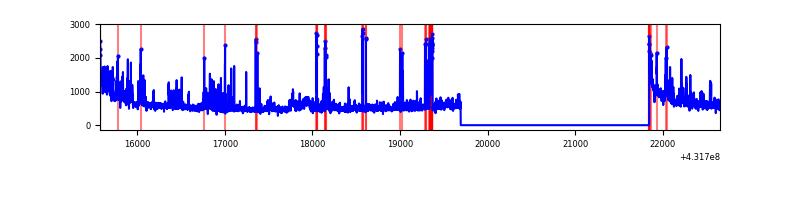 |
| B | 7079 | 4928 | 42 | 42 | 0.59% | 0.85% | 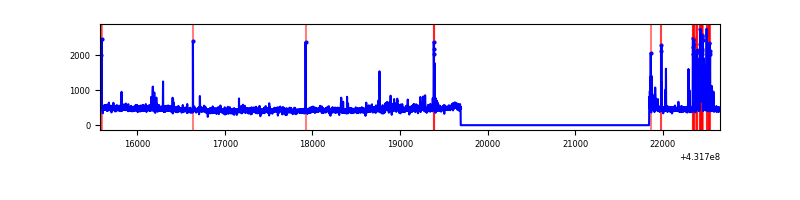 |
| C | 7079 | 4928 | 15 | 15 | 0.21% | 0.30% | 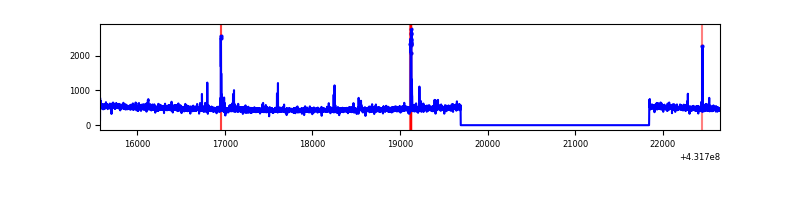 |
| D | 7078 | 4927 | 543 | 543 | 7.67% | 11.02% | 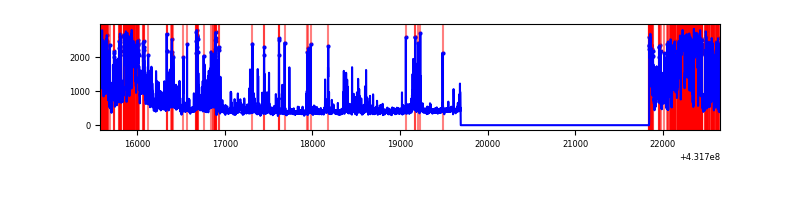 |
Top three noisy pixels from each quadrant. If the there are fewer than three noisy pixels in the level2.evt file, extra rows are filled as -1
| Pixel properties | Quadrant properties | ||||||
|---|---|---|---|---|---|---|---|
| Quadrant | DetID | PixID | Counts | Sigma | Mean | Median | Sigma |
| A | 10 | 83 | 571657 | 5236.34 | 537 | 526 | 109.1 |
| A | 15 | 222 | 335394 | 3070.19 | 537 | 526 | 109.1 |
| A | 15 | 237 | 238759 | 2184.21 | 537 | 526 | 109.1 |
| B | 4 | 81 | 163621 | 1587.84 | 538 | 523 | 102.7 |
| B | 5 | 172 | 56209 | 542.13 | 538 | 523 | 102.7 |
| B | 4 | 171 | 46805 | 450.58 | 538 | 523 | 102.7 |
| C | 15 | 214 | 214578 | 1723.26 | 537 | 539 | 124.2 |
| C | 14 | 254 | 63363 | 505.81 | 537 | 539 | 124.2 |
| C | 13 | 61 | 3611 | 24.73 | 537 | 539 | 124.2 |
| D | 10 | 118 | 893524 | 7314.16 | 507 | 495 | 122.1 |
| D | 12 | 233 | 485557 | 3972.8 | 507 | 495 | 122.1 |
| D | 1 | 52 | 327665 | 2679.62 | 507 | 495 | 122.1 |
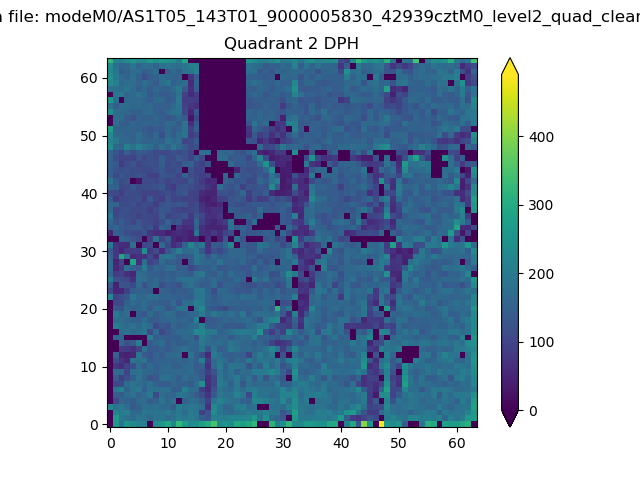
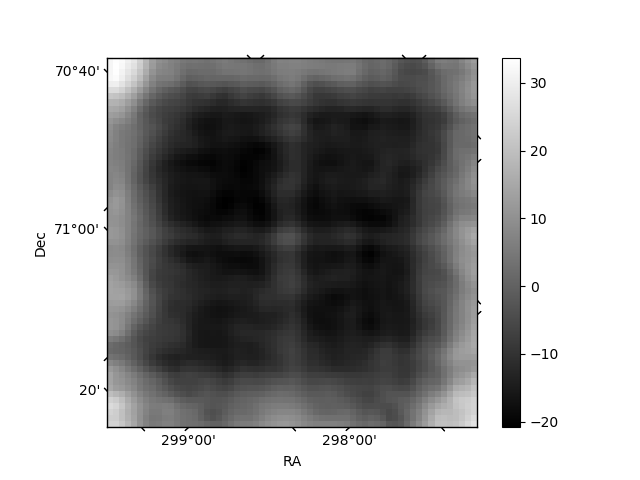
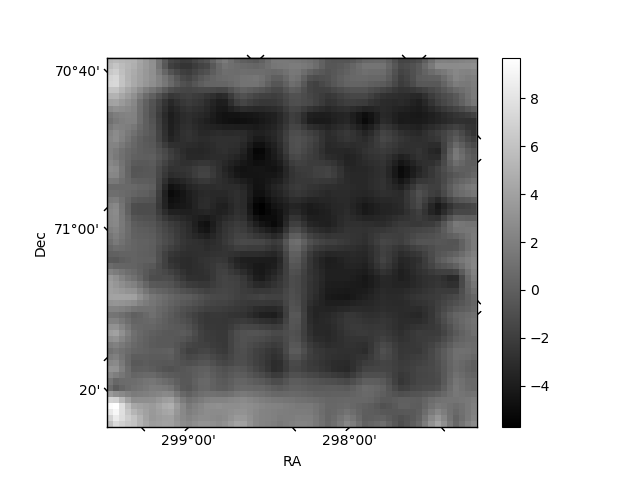
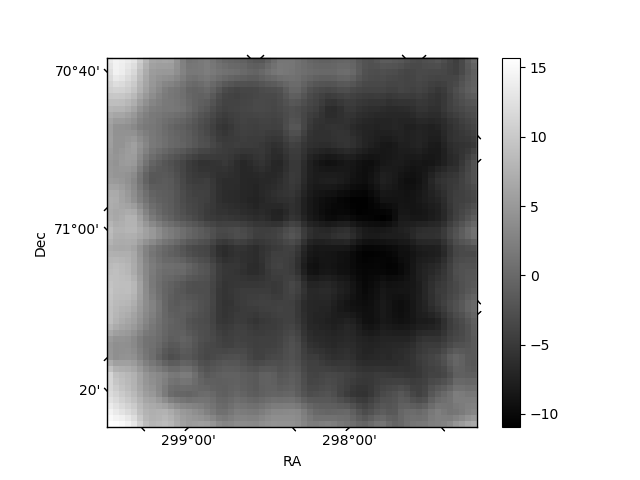
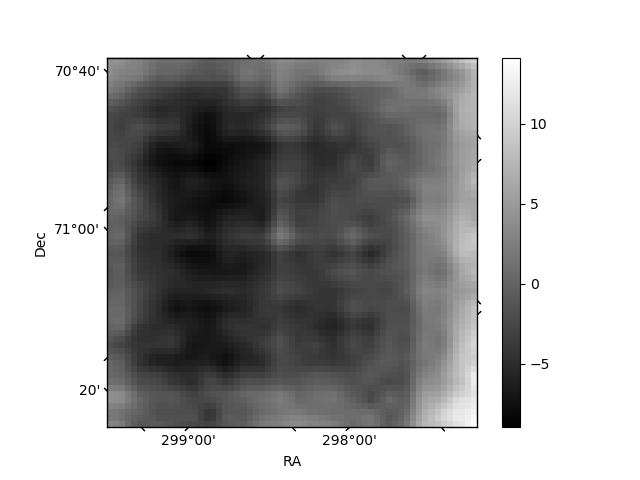
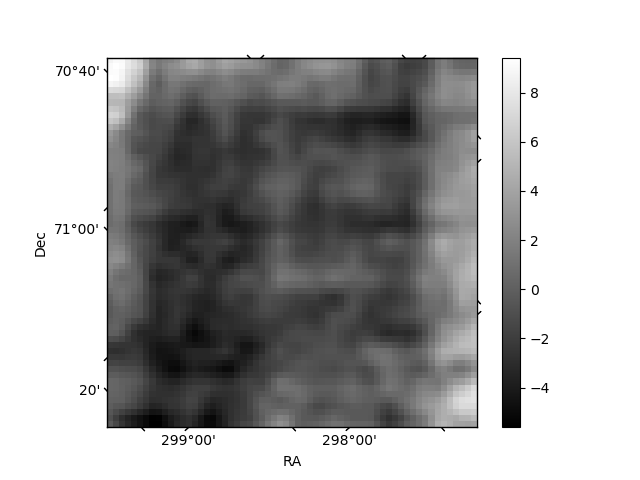
Histogram calculated using DETX and DETY for each event in the final _common_clean file
| Quadrant A | 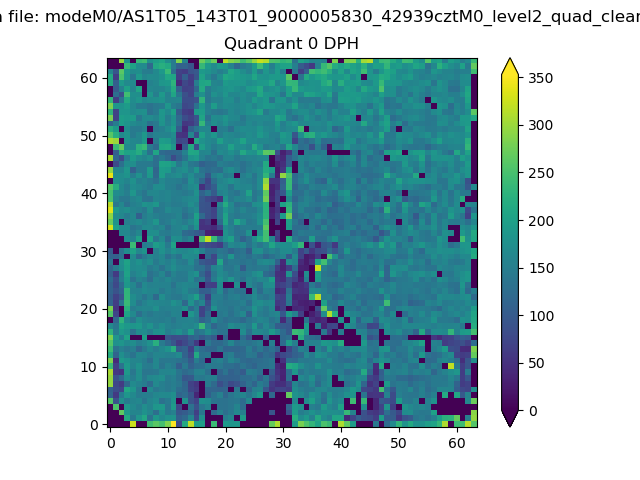 |
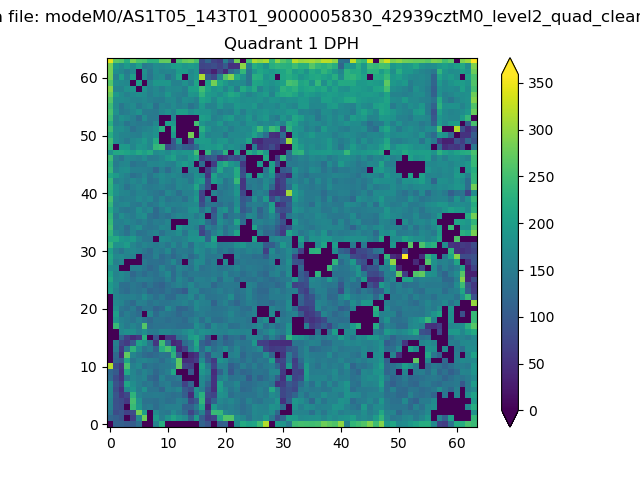 |
Quadrant B |
|---|---|---|---|
| Quadrant D | 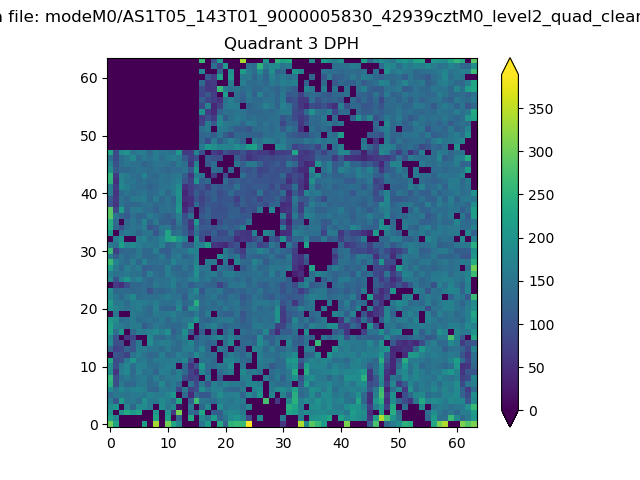 |
 |
Quadrant C |
| Plot type | Count rate plots | Images |
|---|---|---|
| Comparison with Poisson distribution Blue bars denote a histogram of data divided into 1 sec bins. Red curve is a Poisson curve with rate = median count rate of data. |
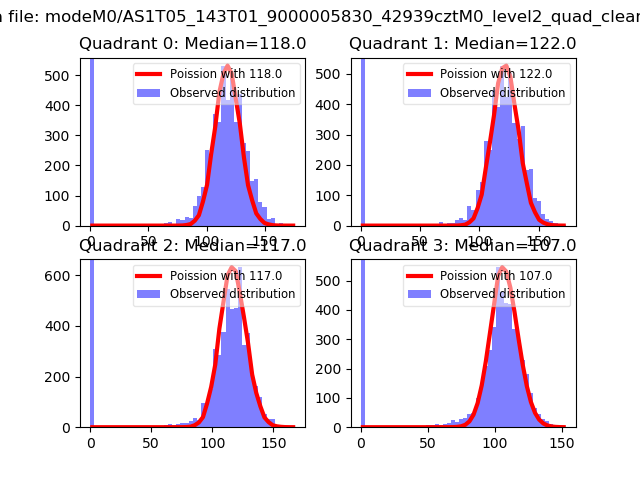 |
 |
| Quadrant-wise count rates Data is divided into 100 sec bins |
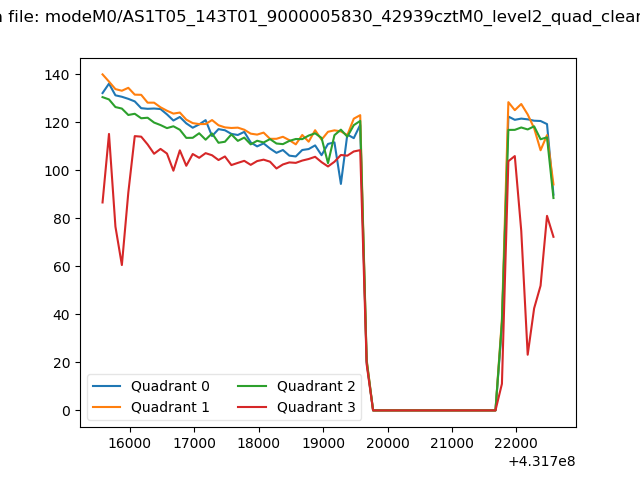 |
|
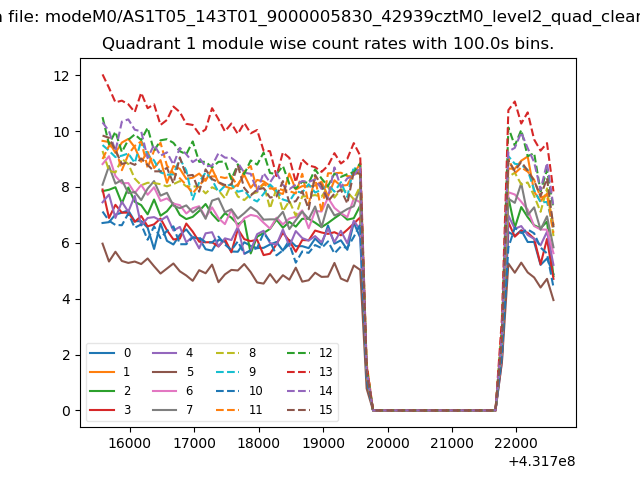
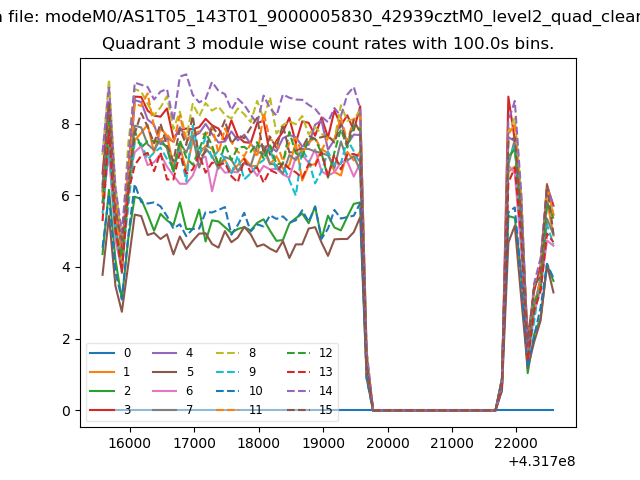
| Module-wise count rates for Quadrant A Data is divided into 100 sec bins |
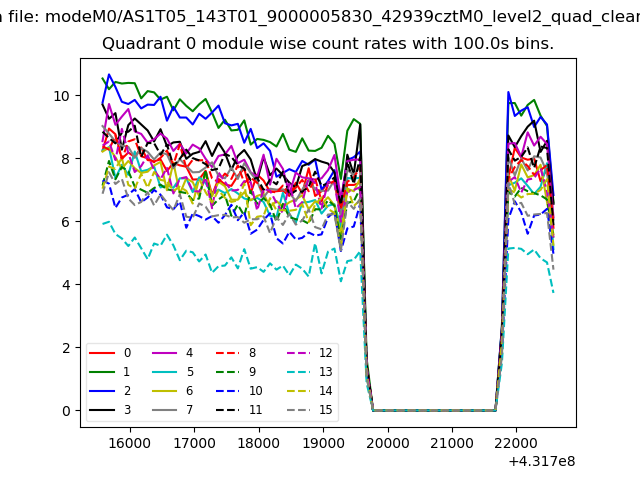 |
 |
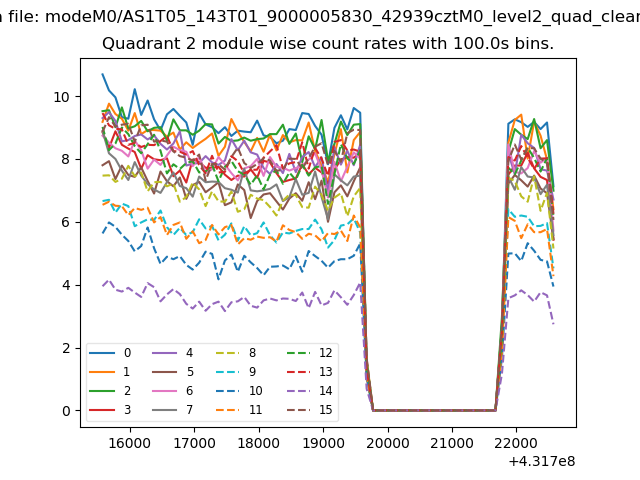
| Module-wise count rates for Quadrant B Data is divided into 100 sec bins |
 |
 |
| Module-wise count rates for Quadrant C Data is divided into 100 sec bins |
 |
 |
| Module-wise count rates for Quadrant D Data is divided into 100 sec bins |
 |
 |
| Parameter | Plot |
|---|---|
| CZT HV Monitor | 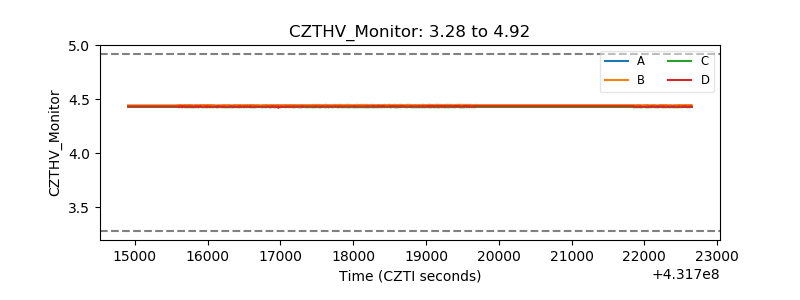 |
| D_VDD | 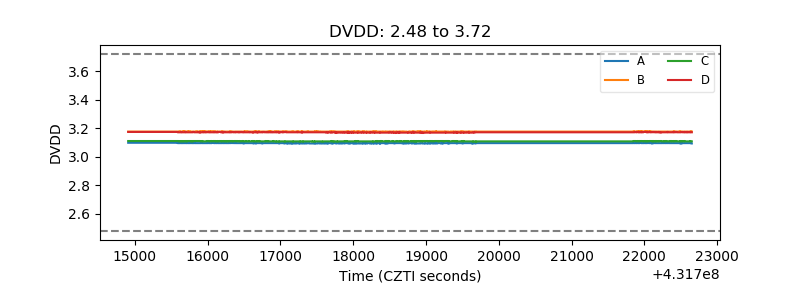 |
| Temperature 1 | 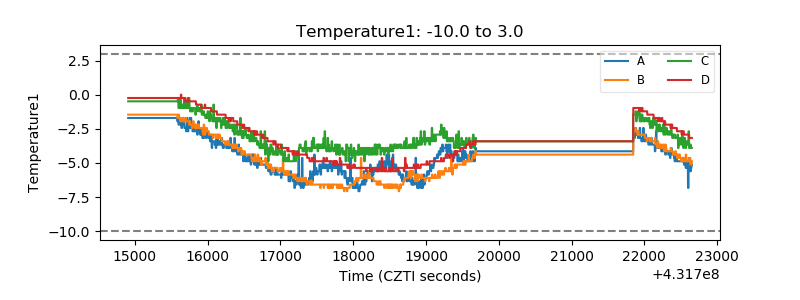 |
| Veto HV Monitor | 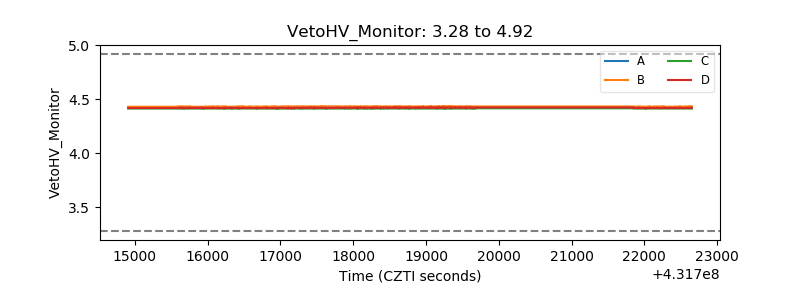 |
| Veto LLD | 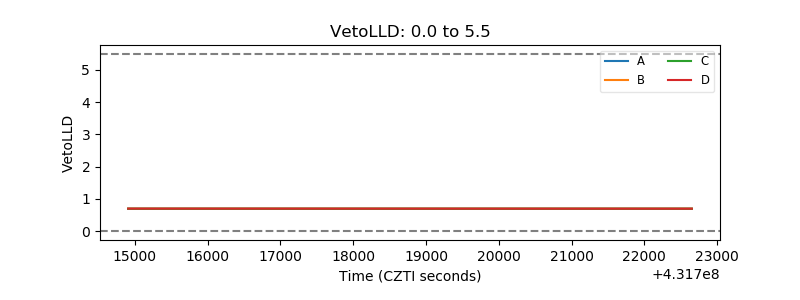 |
| Alpha Counter | 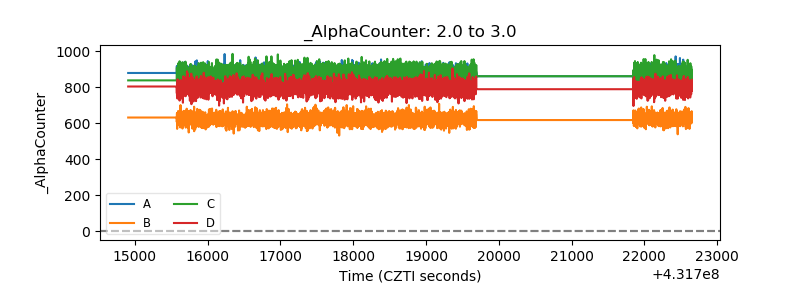 |
| _CPM_Rate | 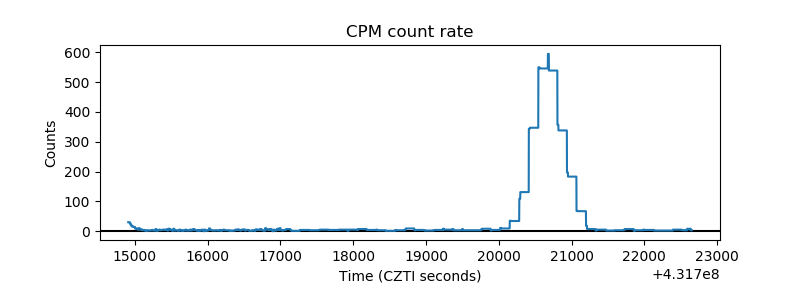 |
| CZT Counter | 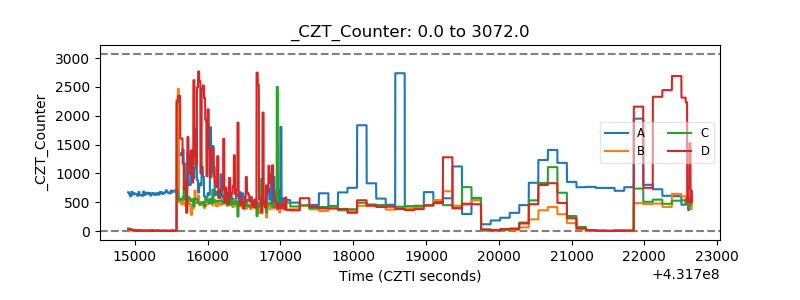 |
| +2.5 Volts monitor | 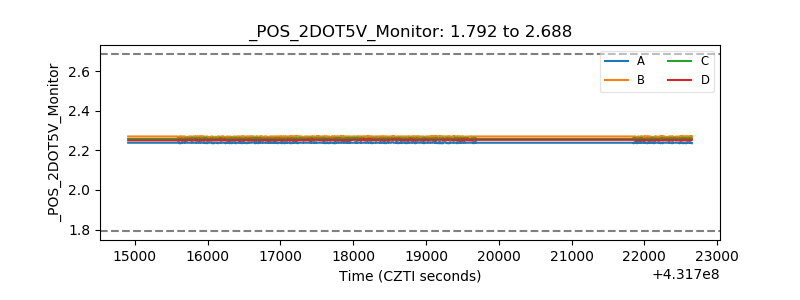 |
| +5 Volts monitor | 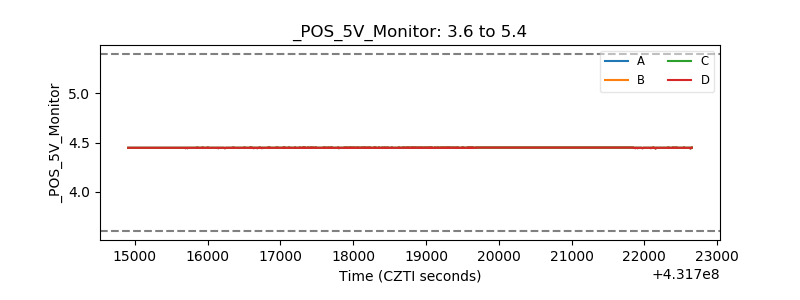 |
| _ROLL_ROT |  |
| _Roll_DEC | 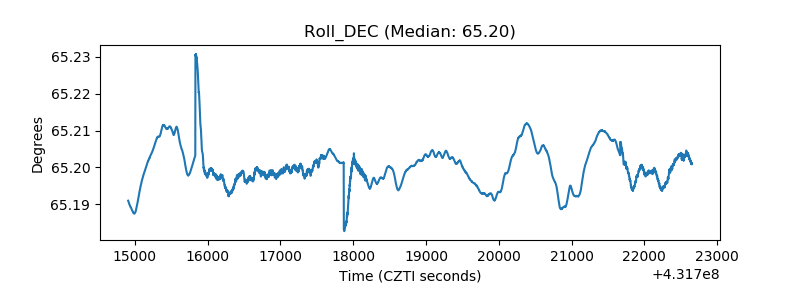 |
| _Roll_RA | 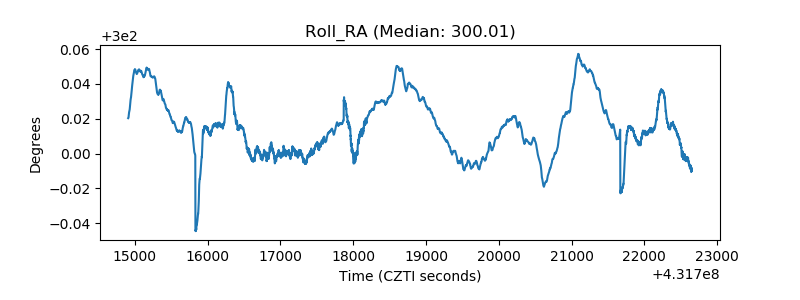 |
| Veto Counter | 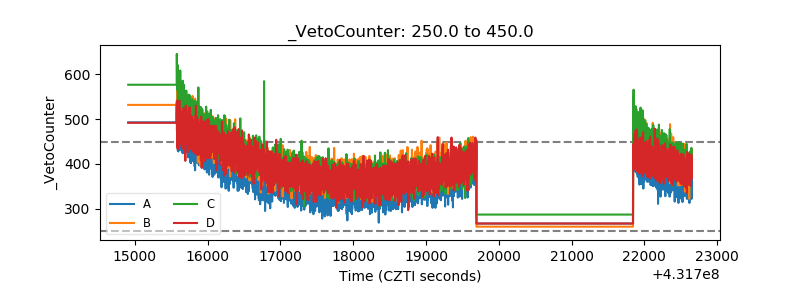 |