| Param | Original file | Final file |
|---|---|---|
| Filename | modeM0/AS1T05_143T01_9000005830_42940cztM0_level2.fits | modeM0/AS1T05_143T01_9000005830_42940cztM0_level2_quad_clean.evt |
| Size (bytes) | 91,563,840 | 16,764,480 |
| Size | 87.3 MB | 16.0 MB |
| Events in quadrant A | 772,569 | 119,172 |
| Events in quadrant B | 606,524 | 120,509 |
| Events in quadrant C | 495,290 | 114,957 |
| Events in quadrant D | 1,434,355 | 76,472 |
| Mode M0 | |||
|---|---|---|---|
| Quadrant | BADHDUFLAG | Total packets | Discarded packets |
| A | 0 | 2981 | 1 |
| B | 0 | 2474 | 1 |
| C | 0 | 2042 | 1 |
| D | 0 | 4961 | 1 |
| Mode M9 | |||
|---|---|---|---|
| Quadrant | BADHDUFLAG | Total packets | Discarded packets |
| A | 0 | 7 | 0 |
| B | 0 | 8 | 0 |
| C | 0 | 8 | 0 |
| D | 0 | 8 | 0 |
| Mode SS | |||
|---|---|---|---|
| Quadrant | BADHDUFLAG | Total packets | Discarded packets |
| A | 0 | 20 | 0 |
| B | 0 | 20 | 0 |
| C | 0 | 20 | 0 |
| D | 0 | 20 | 0 |
| Quadrant | Total seconds | Saturated seconds | Saturation percentage |
|---|---|---|---|
| A | 997 | 18 | 1.805416% |
| B | 997 | 41 | 4.112337% |
| C | 997 | 2 | 0.200602% |
| D | 997 | 341 | 34.202608% |
Noise dominated data is calculated using 1-second bins in cleaned event files. If a bin has >2000 counts, and if more than 50% of those come from <1% of pixels, then it is considered to be noise-dominated and hence unusable.
| Quadrant | # 1 sec bins | Bins with >0 counts | Bins with >2000 counts | High rate bins dominated by noise | Noise dominated (total time) | Noise dominated (detector-on time) | Marked lightcurve |
|---|---|---|---|---|---|---|---|
| A | 996 | 996 | 13 | 13 | 1.31% | 1.31% | 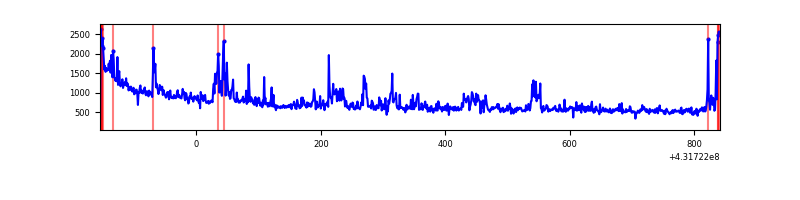 |
| B | 997 | 997 | 35 | 35 | 3.51% | 3.51% | 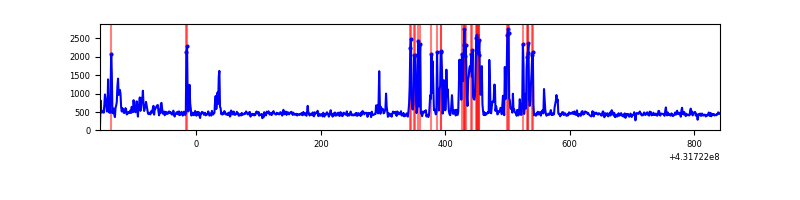 |
| C | 996 | 996 | 1 | 1 | 0.10% | 0.10% | 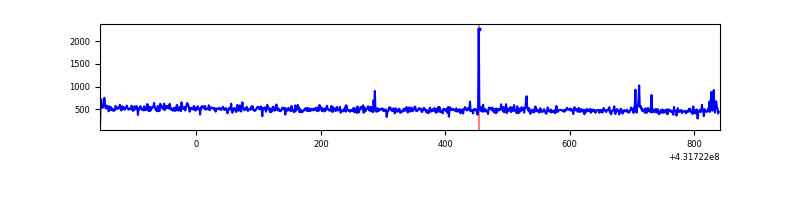 |
| D | 997 | 997 | 329 | 329 | 33.00% | 33.00% | 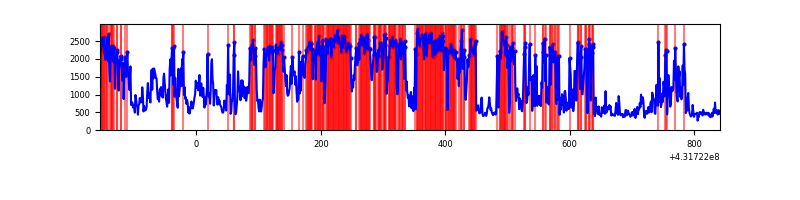 |
Top three noisy pixels from each quadrant. If the there are fewer than three noisy pixels in the level2.evt file, extra rows are filled as -1
| Pixel properties | Quadrant properties | ||||||
|---|---|---|---|---|---|---|---|
| Quadrant | DetID | PixID | Counts | Sigma | Mean | Median | Sigma |
| A | 10 | 83 | 185484 | 7580.82 | 110 | 108 | 24.5 |
| A | 15 | 222 | 130442 | 5329.92 | 110 | 108 | 24.5 |
| A | 15 | 237 | 10906 | 441.58 | 110 | 108 | 24.5 |
| B | 4 | 81 | 98865 | 4330.55 | 110 | 107 | 22.8 |
| B | 5 | 172 | 53537 | 2342.91 | 110 | 107 | 22.8 |
| B | 15 | 85 | 10058 | 436.35 | 110 | 107 | 22.8 |
| C | 15 | 214 | 46678 | 1681.26 | 111 | 112 | 27.7 |
| C | 14 | 254 | 9591 | 342.24 | 111 | 112 | 27.7 |
| C | 12 | 249 | 1324 | 43.76 | 111 | 112 | 27.7 |
| D | 10 | 118 | 618905 | 24848.8 | 95 | 91 | 24.9 |
| D | 12 | 233 | 278004 | 11159.74 | 95 | 91 | 24.9 |
| D | 1 | 52 | 65257 | 2616.77 | 95 | 91 | 24.9 |
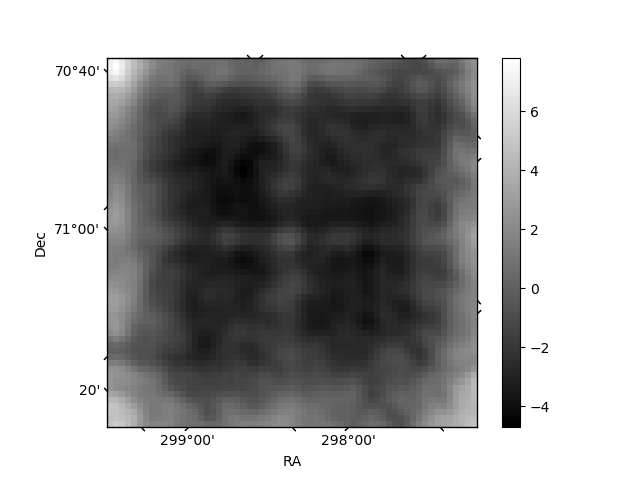
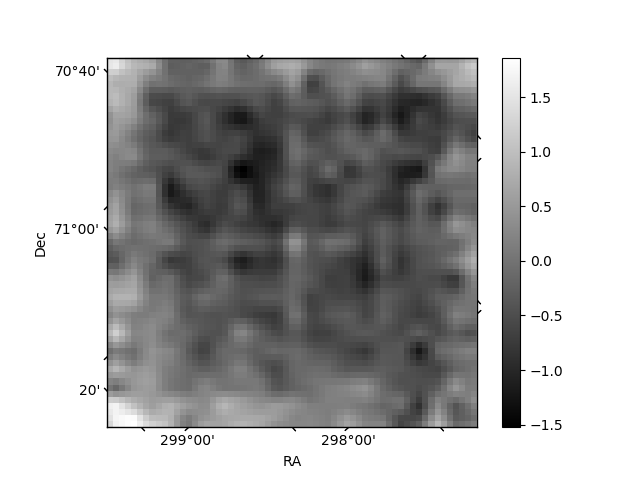
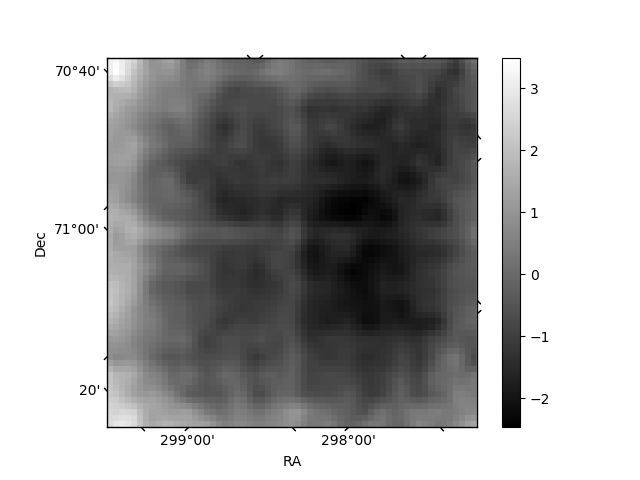
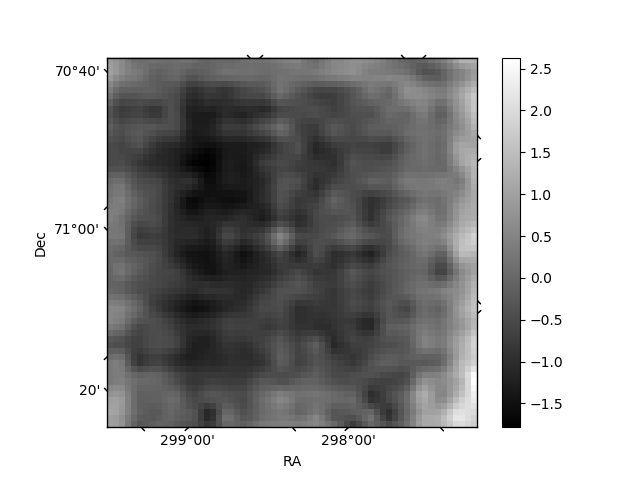
Histogram calculated using DETX and DETY for each event in the final _common_clean file
| Quadrant A | 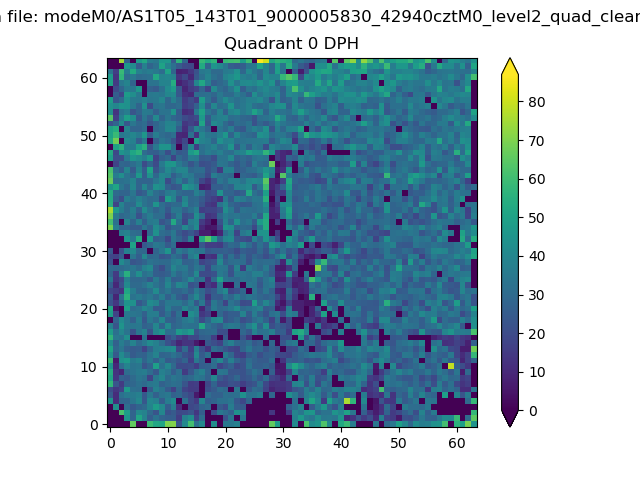 |
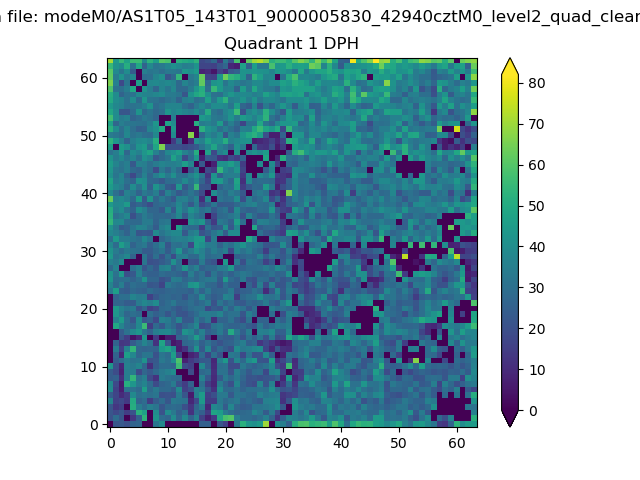 |
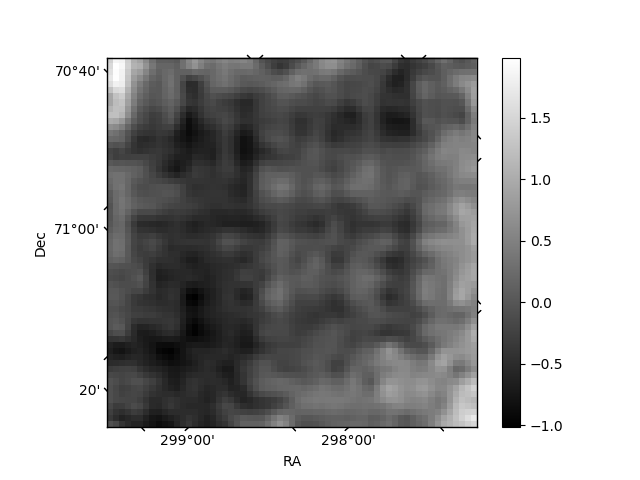
Quadrant B |
|---|---|---|---|
| Quadrant D | 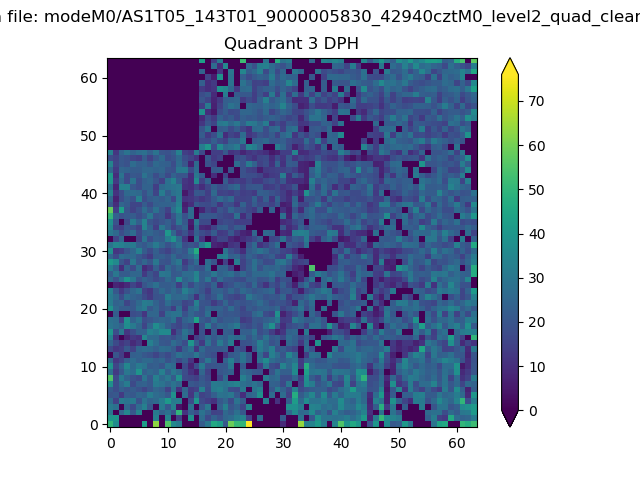 |
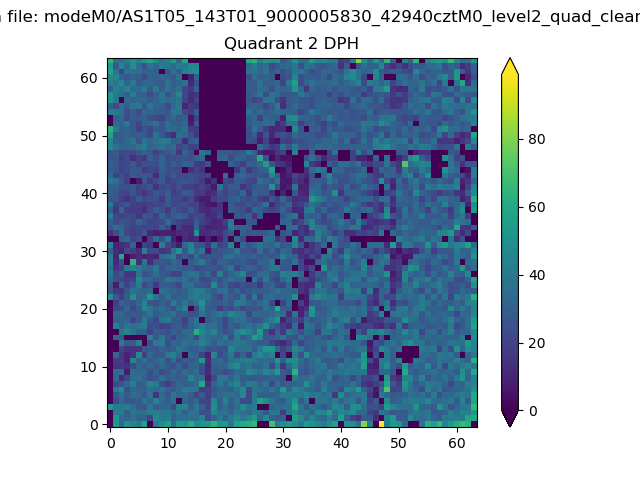 |
Quadrant C |
| Plot type | Count rate plots | Images |
|---|---|---|
| Comparison with Poisson distribution Blue bars denote a histogram of data divided into 1 sec bins. Red curve is a Poisson curve with rate = median count rate of data. |
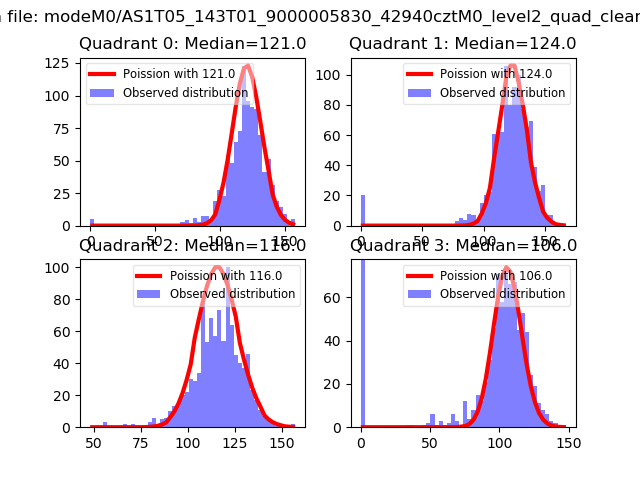 |
 |
| Quadrant-wise count rates Data is divided into 100 sec bins |
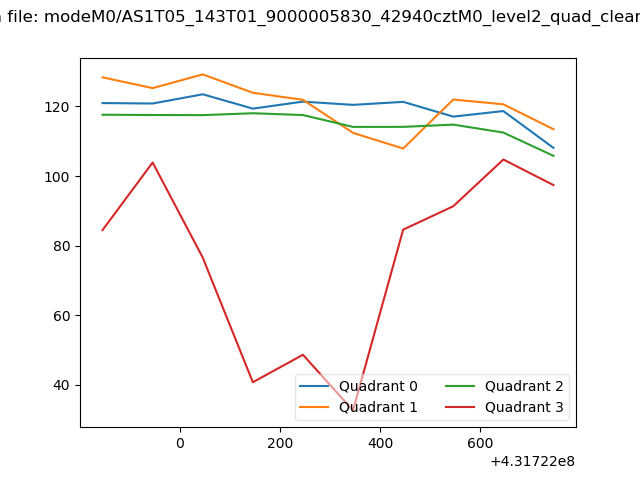 |
|
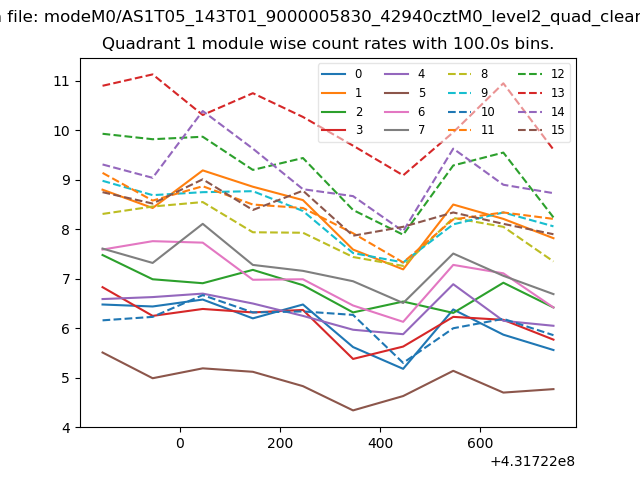
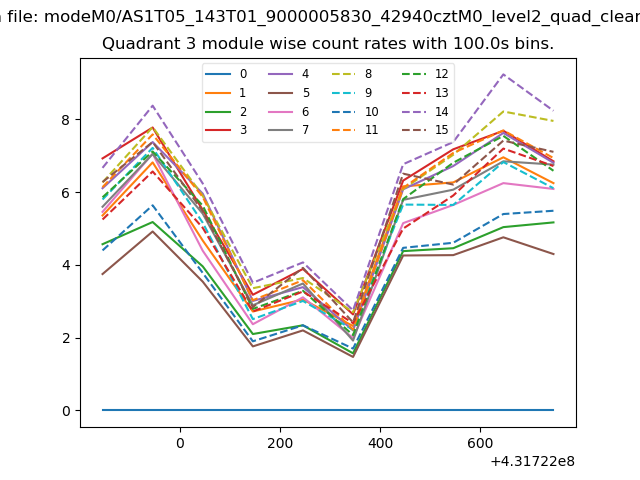
| Module-wise count rates for Quadrant A Data is divided into 100 sec bins |
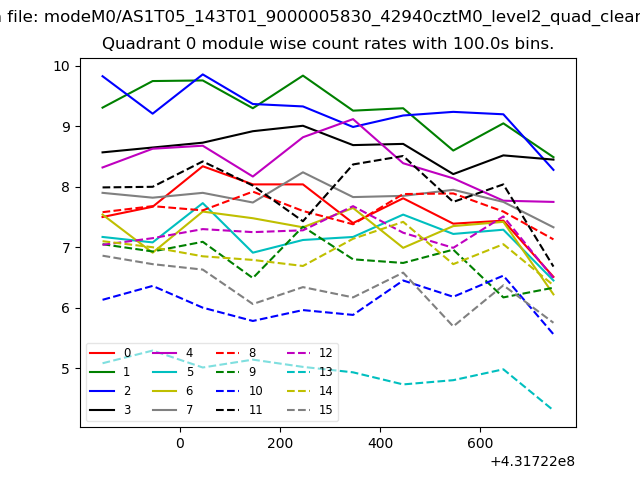 |
 |
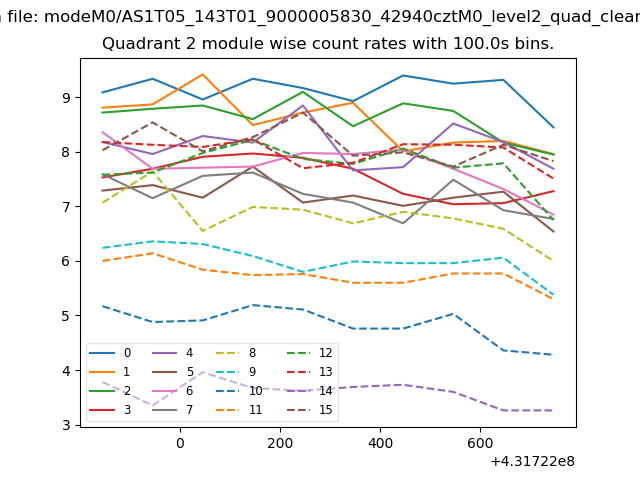
| Module-wise count rates for Quadrant B Data is divided into 100 sec bins |
 |
 |
| Module-wise count rates for Quadrant C Data is divided into 100 sec bins |
 |
 |
| Module-wise count rates for Quadrant D Data is divided into 100 sec bins |
 |
 |
| Parameter | Plot |
|---|---|
| CZT HV Monitor | 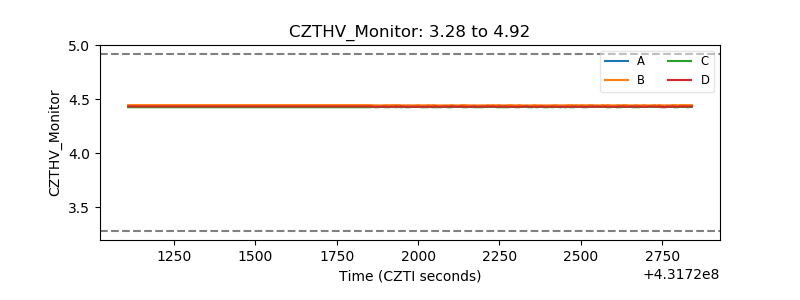 |
| D_VDD | 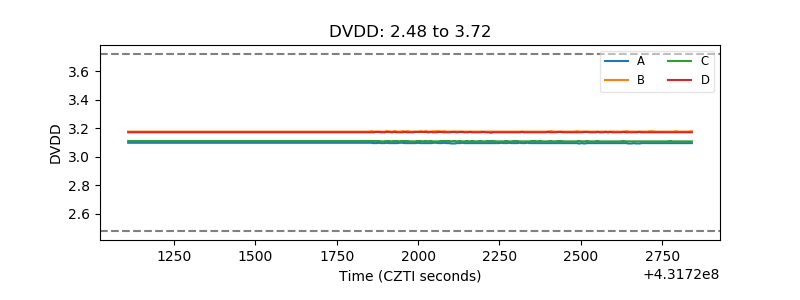 |
| Temperature 1 | 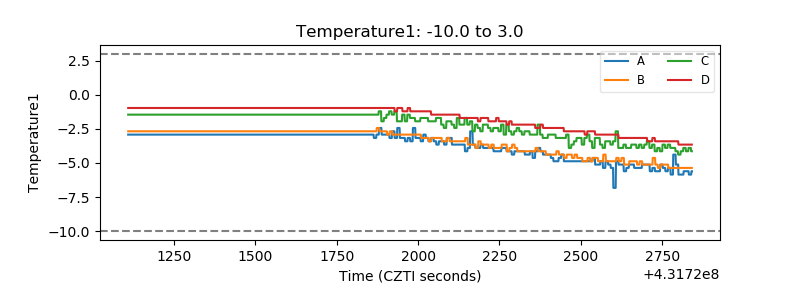 |
| Veto HV Monitor | 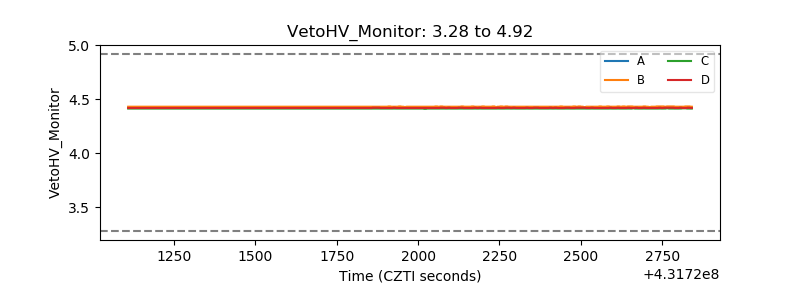 |
| Veto LLD | 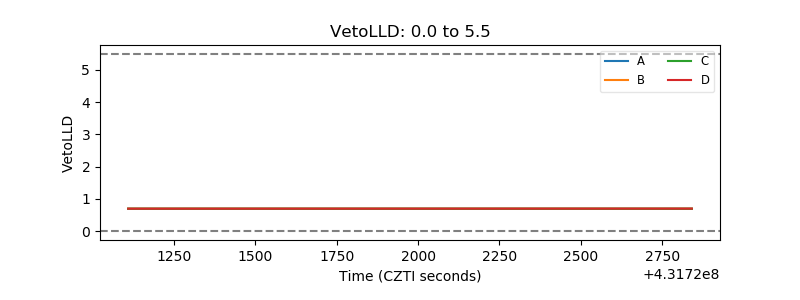 |
| Alpha Counter | 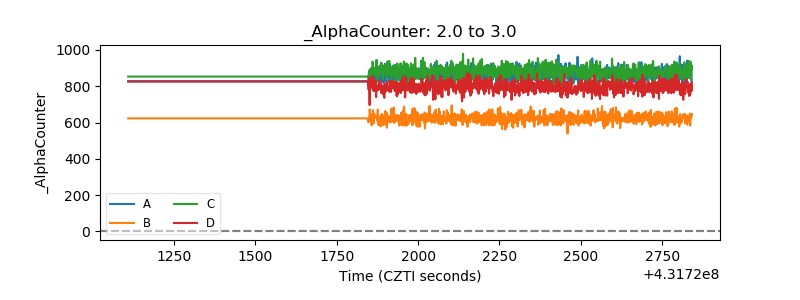 |
| _CPM_Rate | 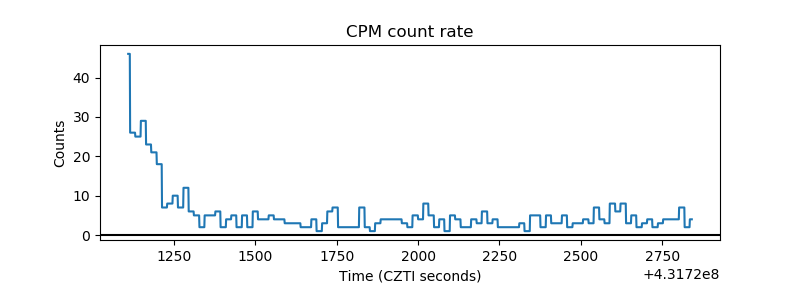 |
| CZT Counter | 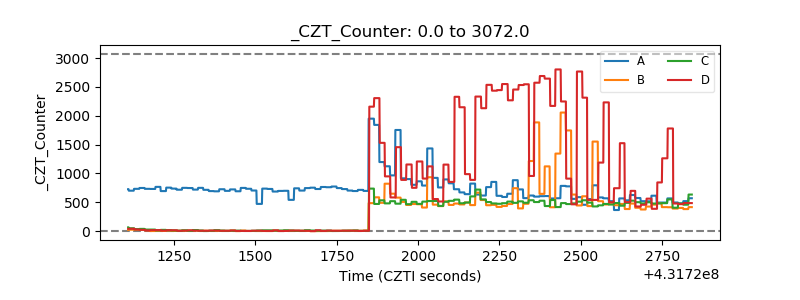 |
| +2.5 Volts monitor | 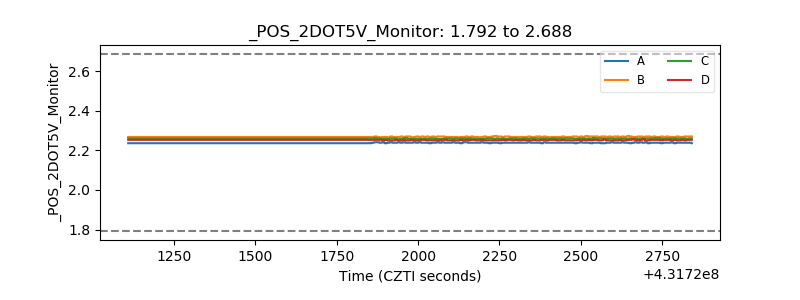 |
| +5 Volts monitor | 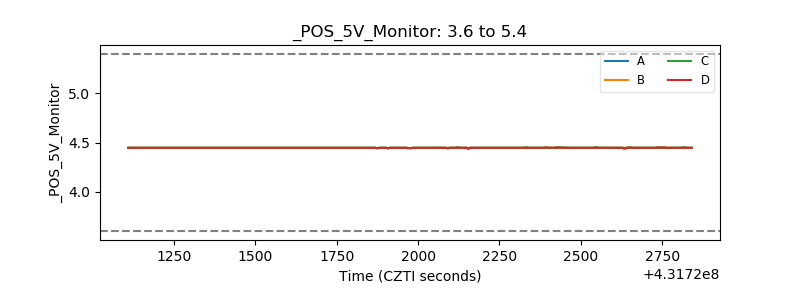 |
| _ROLL_ROT | 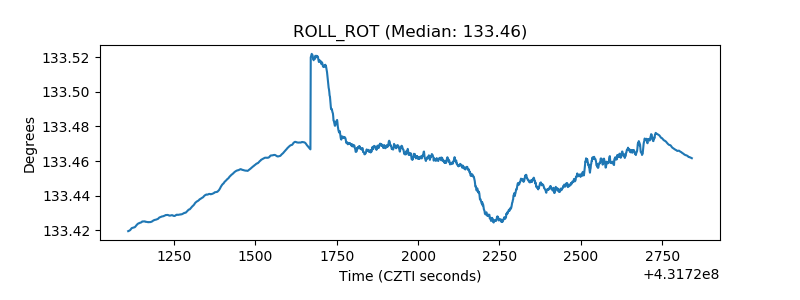 |
| _Roll_DEC | 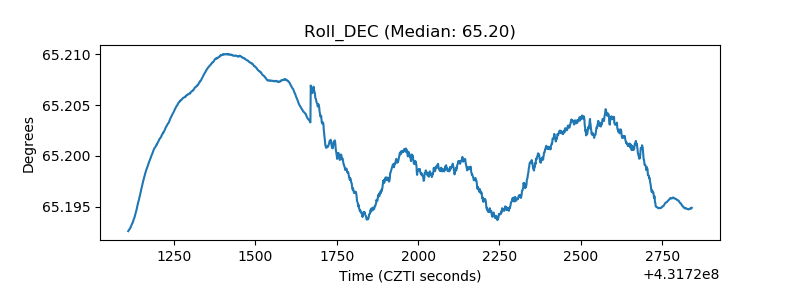 |
| _Roll_RA | 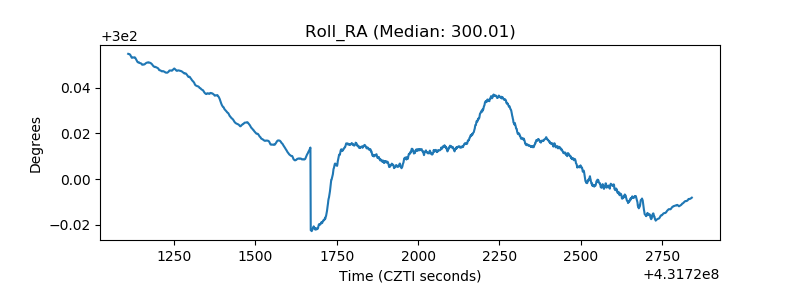 |
| Veto Counter | 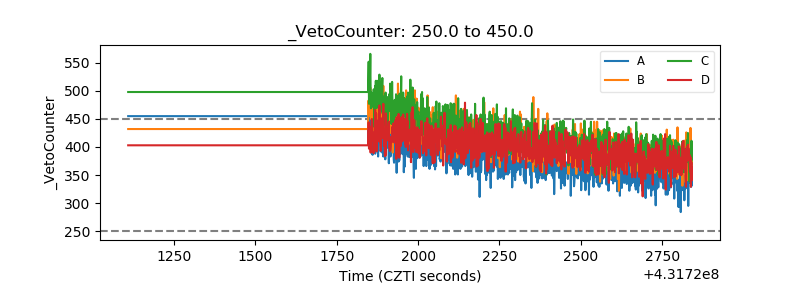 |