| Param | Original file | Final file |
|---|---|---|
| Filename | modeM0/AS1A09_036T05_9000005832_42941cztM0_level2.fits | modeM0/AS1A09_036T05_9000005832_42941cztM0_level2_quad_clean.evt |
| Size (bytes) | 329,454,720 | 83,733,120 |
| Size | 314.2 MB | 79.9 MB |
| Events in quadrant A | 2,975,594 | 559,465 |
| Events in quadrant B | 3,037,084 | 560,682 |
| Events in quadrant C | 2,354,811 | 555,147 |
| Events in quadrant D | 3,424,328 | 497,693 |
| Mode M0 | |||
|---|---|---|---|
| Quadrant | BADHDUFLAG | Total packets | Discarded packets |
| A | 0 | 12059 | 2 |
| B | 0 | 12890 | 2 |
| C | 0 | 10474 | 2 |
| D | 0 | 13956 | 2 |
| Mode M9 | |||
|---|---|---|---|
| Quadrant | BADHDUFLAG | Total packets | Discarded packets |
| A | 0 | 30 | 0 |
| B | 0 | 31 | 0 |
| C | 0 | 31 | 0 |
| D | 0 | 31 | 0 |
| Mode SS | |||
|---|---|---|---|
| Quadrant | BADHDUFLAG | Total packets | Discarded packets |
| A | 0 | 104 | 0 |
| B | 0 | 104 | 0 |
| C | 0 | 104 | 0 |
| D | 0 | 104 | 0 |
| Quadrant | Total seconds | Saturated seconds | Saturation percentage |
|---|---|---|---|
| A | 5176 | 90 | 1.738794% |
| B | 5176 | 205 | 3.960587% |
| C | 5176 | 3 | 0.057960% |
| D | 5176 | 249 | 4.810665% |
Noise dominated data is calculated using 1-second bins in cleaned event files. If a bin has >2000 counts, and if more than 50% of those come from <1% of pixels, then it is considered to be noise-dominated and hence unusable.
| Quadrant | # 1 sec bins | Bins with >0 counts | Bins with >2000 counts | High rate bins dominated by noise | Noise dominated (total time) | Noise dominated (detector-on time) | Marked lightcurve |
|---|---|---|---|---|---|---|---|
| A | 6968 | 5176 | 48 | 48 | 0.69% | 0.93% | 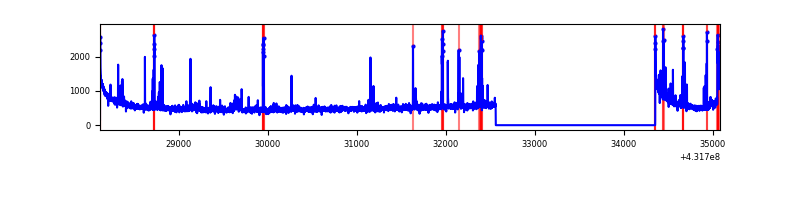 |
| B | 6969 | 5177 | 156 | 156 | 2.24% | 3.01% | 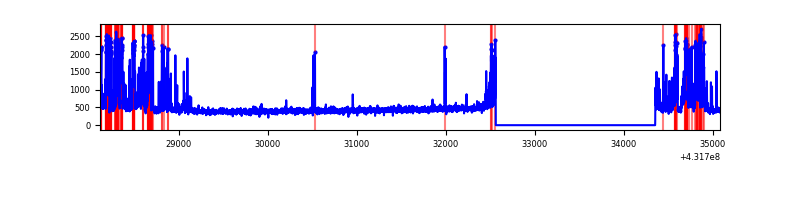 |
| C | 6968 | 5176 | 0 | 0 | 0.00% | 0.00% | 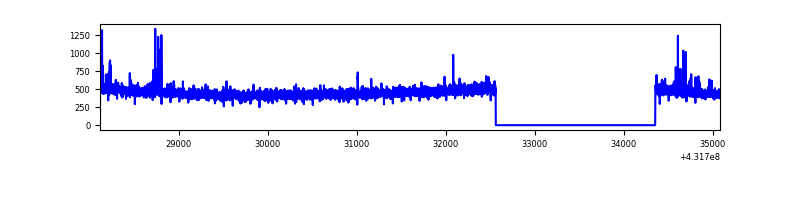 |
| D | 6968 | 5176 | 257 | 257 | 3.69% | 4.97% | 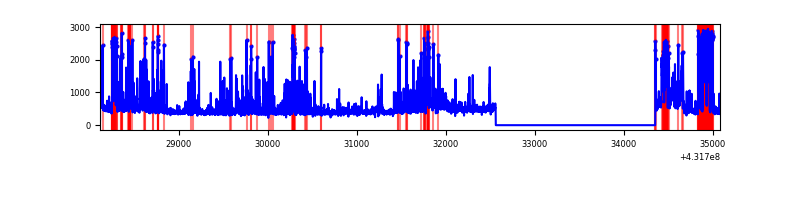 |
Top three noisy pixels from each quadrant. If the there are fewer than three noisy pixels in the level2.evt file, extra rows are filled as -1
| Pixel properties | Quadrant properties | ||||||
|---|---|---|---|---|---|---|---|
| Quadrant | DetID | PixID | Counts | Sigma | Mean | Median | Sigma |
| A | 10 | 83 | 554779 | 4972.46 | 540 | 529 | 111.5 |
| A | 15 | 237 | 241170 | 2158.91 | 540 | 529 | 111.5 |
| A | 15 | 222 | 48389 | 429.38 | 540 | 529 | 111.5 |
| B | 4 | 81 | 823832 | 7949.71 | 537 | 521 | 103.6 |
| B | 0 | 229 | 56606 | 541.54 | 537 | 521 | 103.6 |
| B | 5 | 172 | 27047 | 256.13 | 537 | 521 | 103.6 |
| C | 15 | 214 | 224882 | 1793.89 | 535 | 538 | 125.1 |
| C | 14 | 254 | 33796 | 265.94 | 535 | 538 | 125.1 |
| C | 12 | 249 | 6320 | 46.23 | 535 | 538 | 125.1 |
| D | 1 | 52 | 696755 | 5437.54 | 521 | 505 | 128.0 |
| D | 2 | 249 | 303991 | 2370.15 | 521 | 505 | 128.0 |
| D | 12 | 233 | 97240 | 755.48 | 521 | 505 | 128.0 |
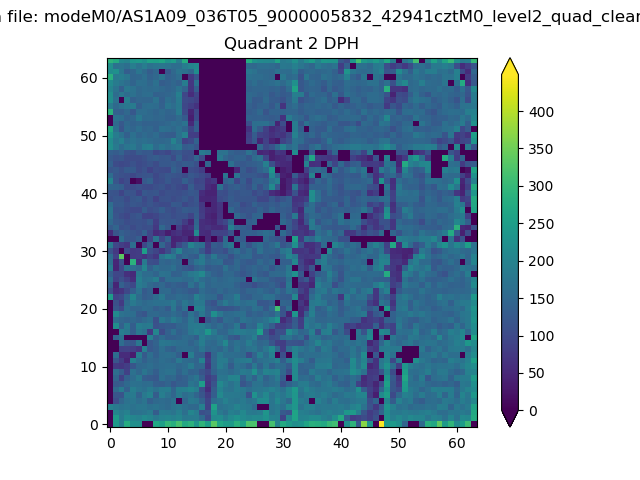
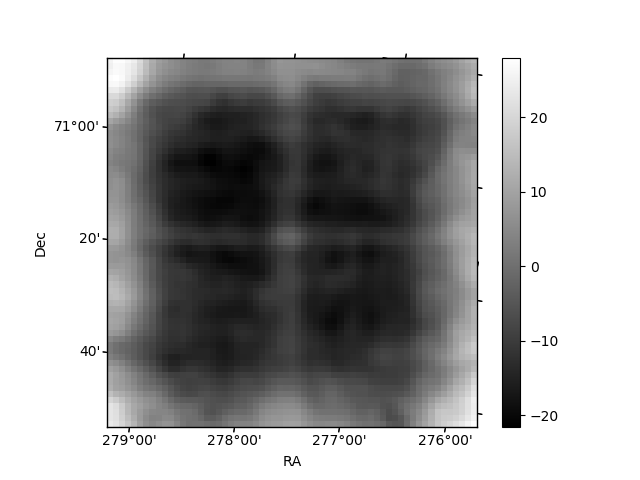
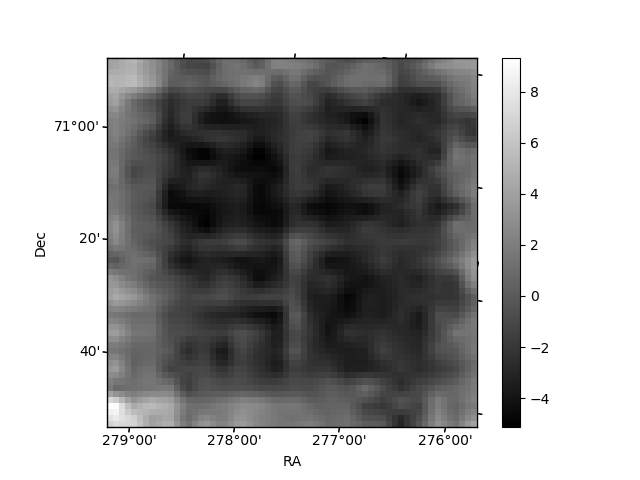
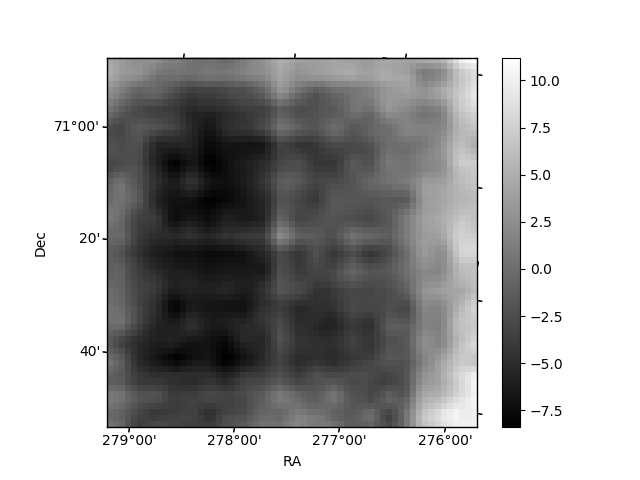
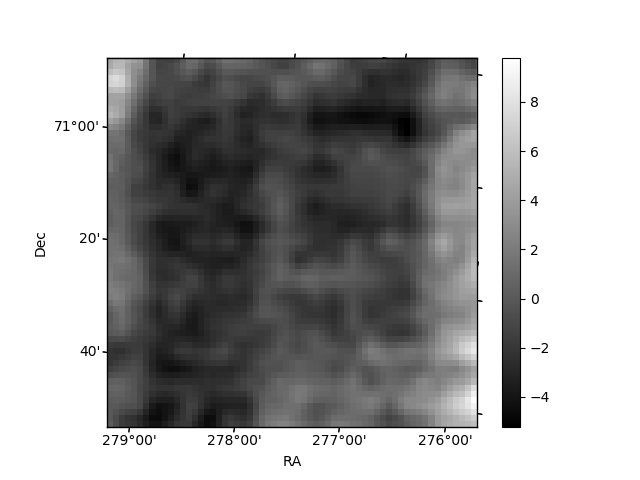
Histogram calculated using DETX and DETY for each event in the final _common_clean file
| Quadrant A | 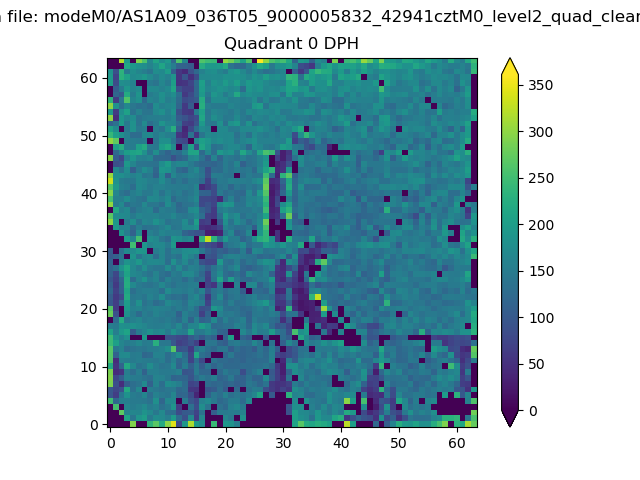 |
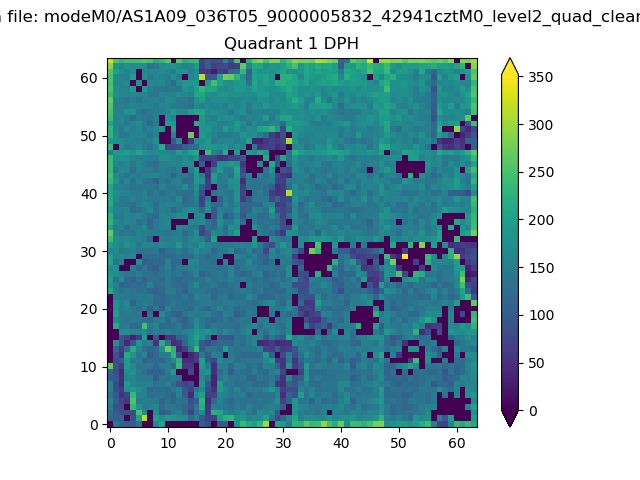 |
Quadrant B |
|---|---|---|---|
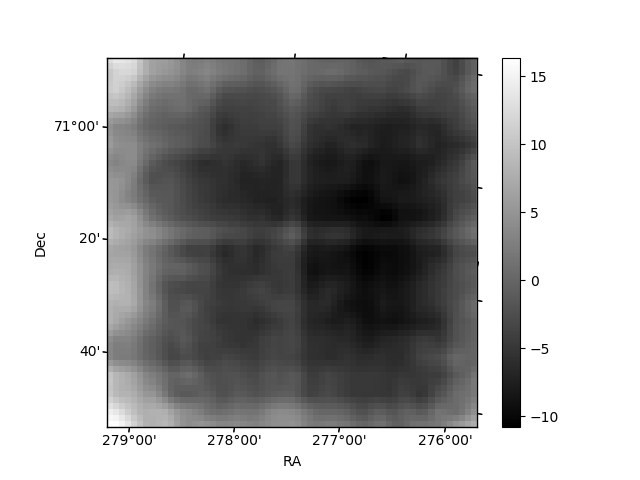
| Quadrant D | 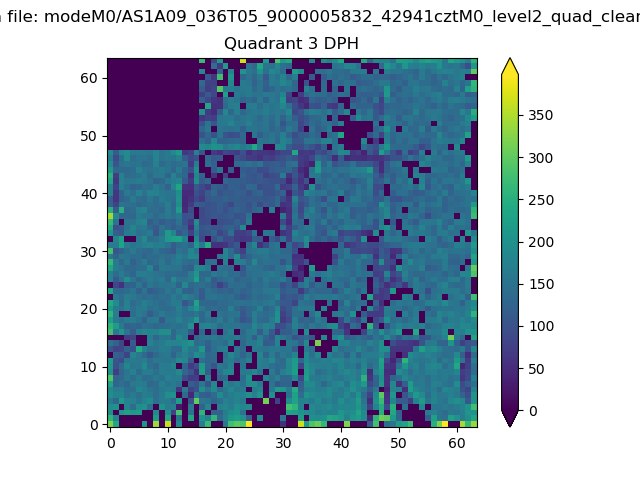 |
 |
Quadrant C |
| Plot type | Count rate plots | Images |
|---|---|---|
| Comparison with Poisson distribution Blue bars denote a histogram of data divided into 1 sec bins. Red curve is a Poisson curve with rate = median count rate of data. |
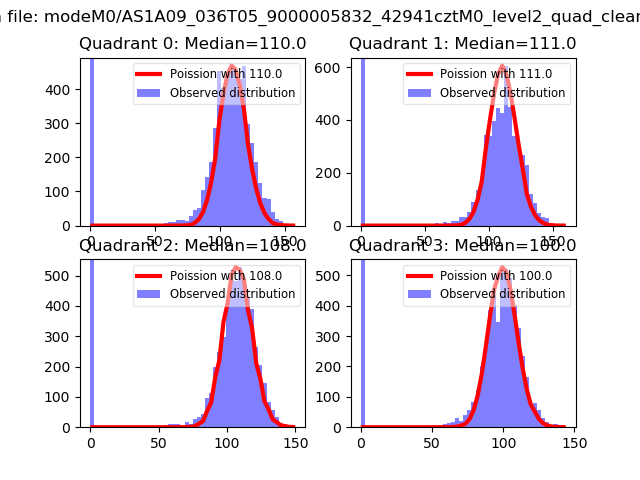 |
 |
| Quadrant-wise count rates Data is divided into 100 sec bins |
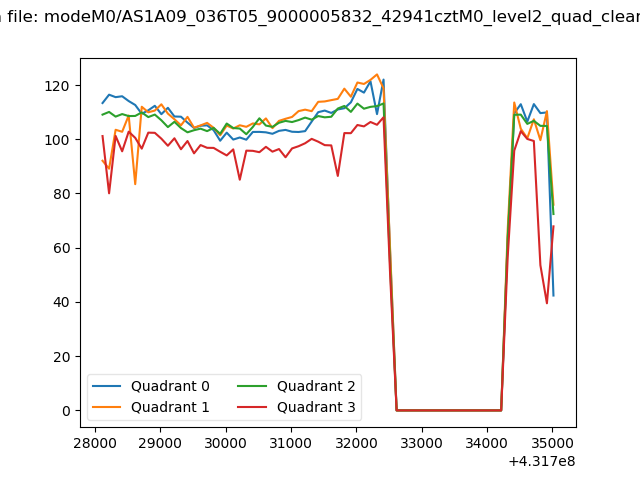 |
|
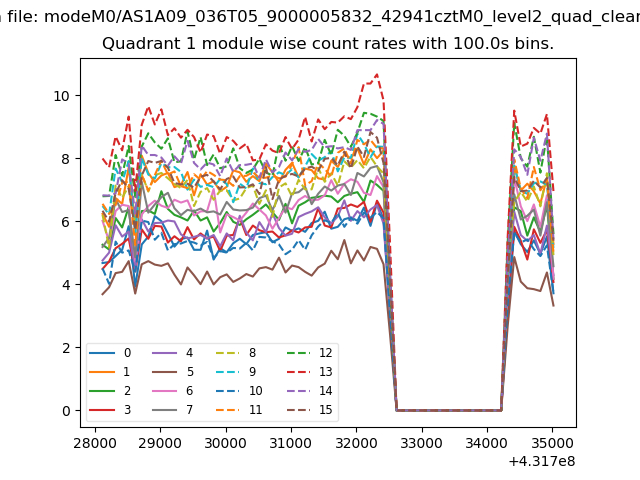
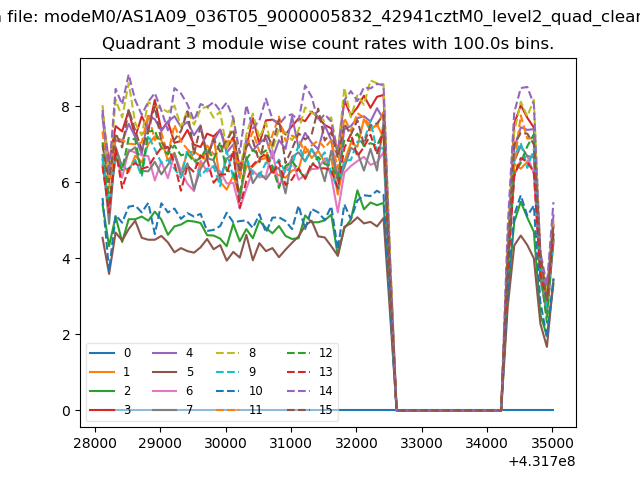
| Module-wise count rates for Quadrant A Data is divided into 100 sec bins |
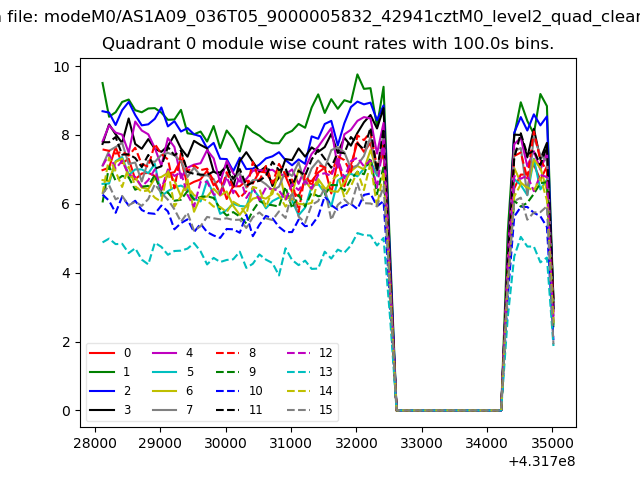 |
 |
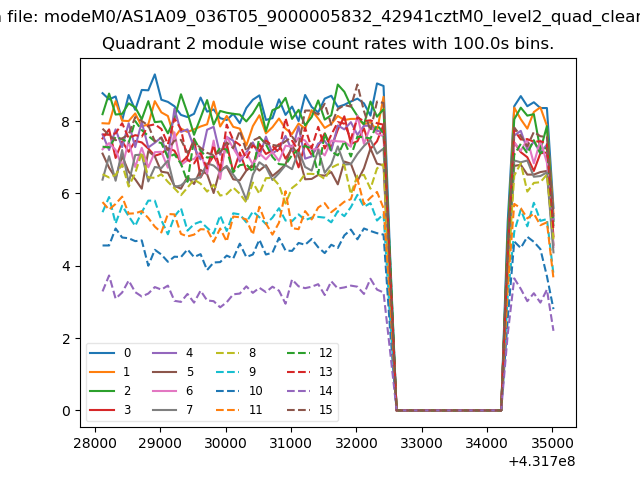
| Module-wise count rates for Quadrant B Data is divided into 100 sec bins |
 |
 |
| Module-wise count rates for Quadrant C Data is divided into 100 sec bins |
 |
 |
| Module-wise count rates for Quadrant D Data is divided into 100 sec bins |
 |
 |
| Parameter | Plot |
|---|---|
| CZT HV Monitor |  |
| D_VDD | 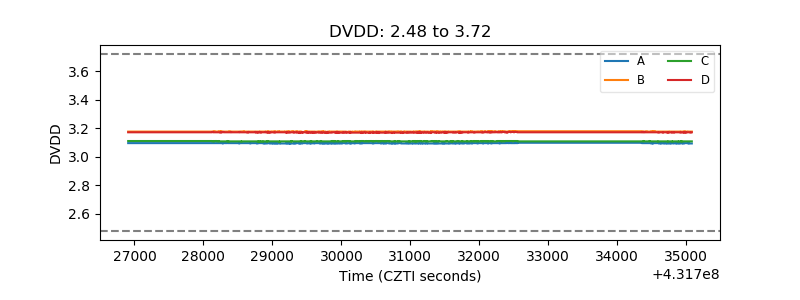 |
| Temperature 1 | 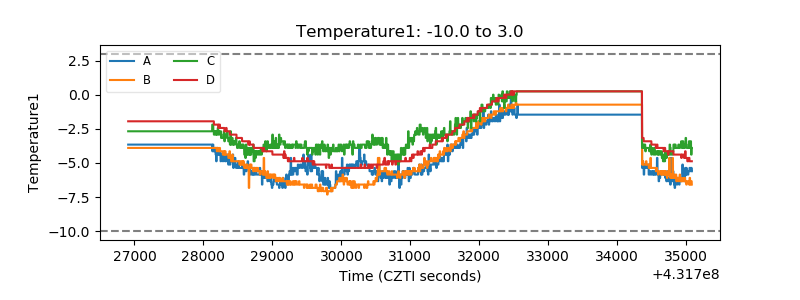 |
| Veto HV Monitor | 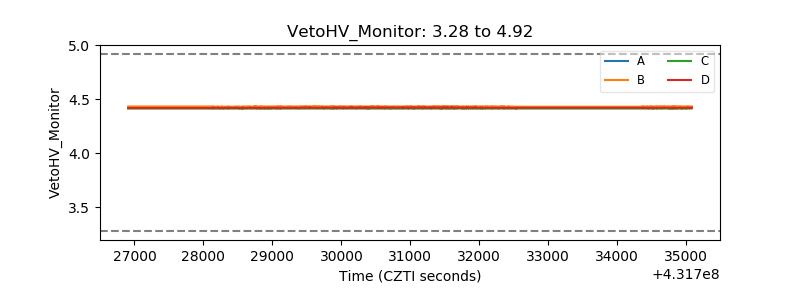 |
| Veto LLD | 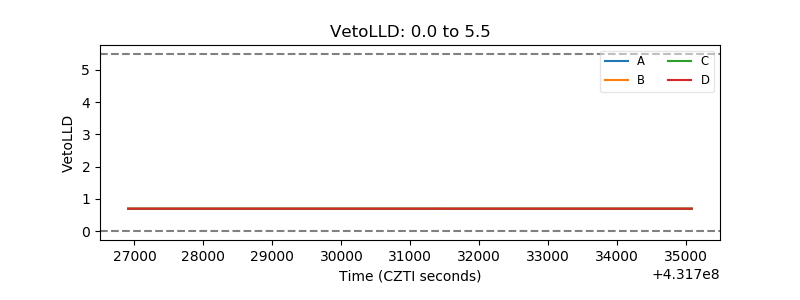 |
| Alpha Counter | 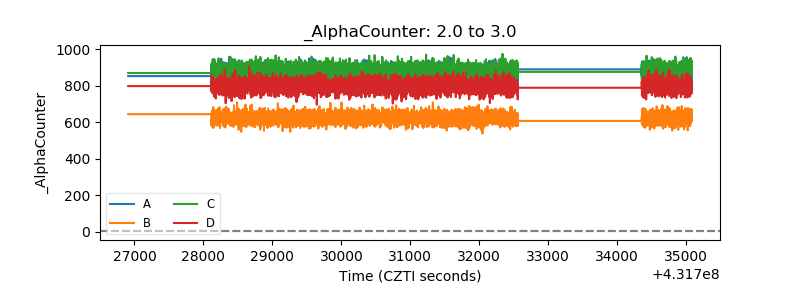 |
| _CPM_Rate | 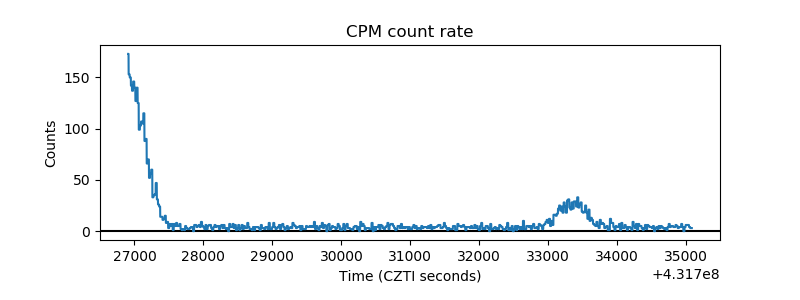 |
| CZT Counter | 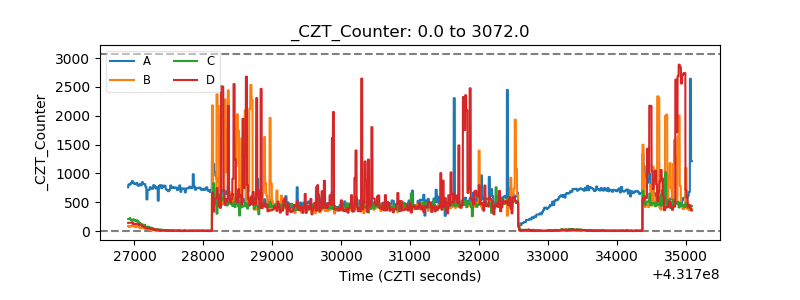 |
| +2.5 Volts monitor | 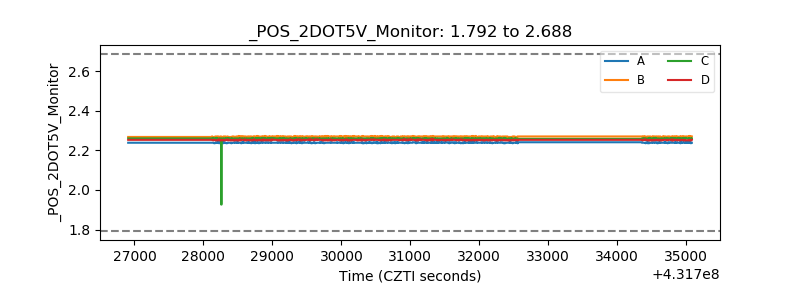 |
| +5 Volts monitor | 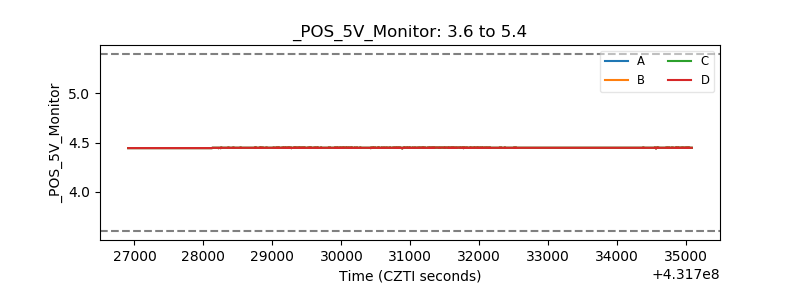 |
| _ROLL_ROT | 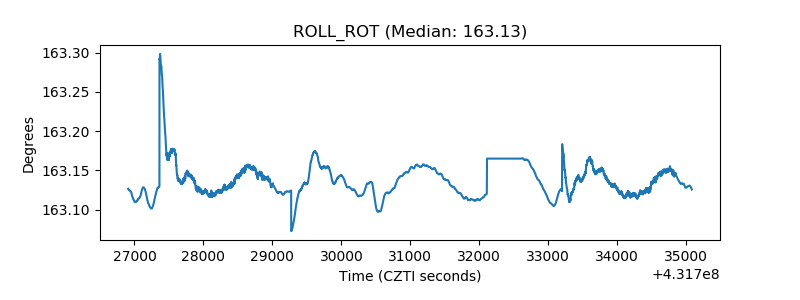 |
| _Roll_DEC | 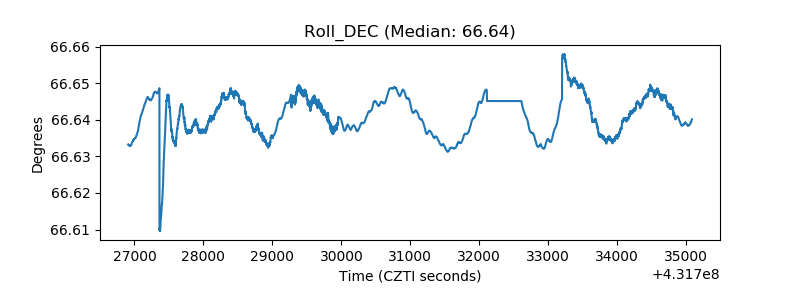 |
| _Roll_RA | 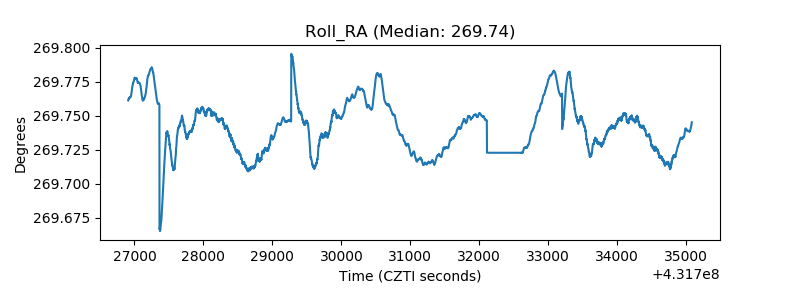 |
| Veto Counter |  |