| Param | Original file | Final file |
|---|---|---|
| Filename | modeM0/AS1A09_036T05_9000005832_42942cztM0_level2.fits | modeM0/AS1A09_036T05_9000005832_42942cztM0_level2_quad_clean.evt |
| Size (bytes) | 524,255,040 | 77,382,720 |
| Size | 500.0 MB | 73.8 MB |
| Events in quadrant A | 8,149,950 | 312,860 |
| Events in quadrant B | 4,270,564 | 548,533 |
| Events in quadrant C | 2,503,402 | 582,628 |
| Events in quadrant D | 4,053,904 | 513,880 |
| Mode M0 | |||
|---|---|---|---|
| Quadrant | BADHDUFLAG | Total packets | Discarded packets |
| A | 0 | 27966 | 2 |
| B | 0 | 16536 | 2 |
| C | 0 | 11131 | 2 |
| D | 0 | 16018 | 2 |
| Mode M9 | |||
|---|---|---|---|
| Quadrant | BADHDUFLAG | Total packets | Discarded packets |
| A | 0 | 31 | 0 |
| B | 0 | 32 | 0 |
| C | 0 | 32 | 0 |
| D | 0 | 32 | 0 |
| Mode SS | |||
|---|---|---|---|
| Quadrant | BADHDUFLAG | Total packets | Discarded packets |
| A | 0 | 112 | 0 |
| B | 0 | 112 | 0 |
| C | 0 | 112 | 0 |
| D | 0 | 112 | 0 |
| Quadrant | Total seconds | Saturated seconds | Saturation percentage |
|---|---|---|---|
| A | 5501 | 2787 | 50.663516% |
| B | 5501 | 608 | 11.052536% |
| C | 5501 | 6 | 0.109071% |
| D | 5501 | 403 | 7.325941% |
Noise dominated data is calculated using 1-second bins in cleaned event files. If a bin has >2000 counts, and if more than 50% of those come from <1% of pixels, then it is considered to be noise-dominated and hence unusable.
| Quadrant | # 1 sec bins | Bins with >0 counts | Bins with >2000 counts | High rate bins dominated by noise | Noise dominated (total time) | Noise dominated (detector-on time) | Marked lightcurve |
|---|---|---|---|---|---|---|---|
| A | 6994 | 5501 | 2146 | 2146 | 30.68% | 39.01% | 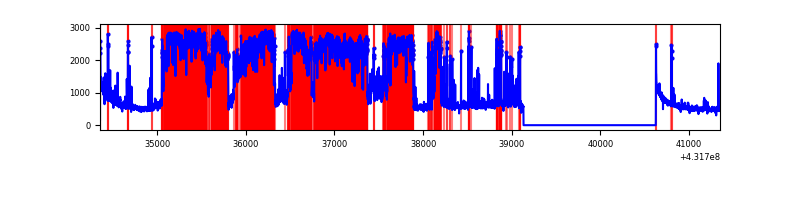 |
| B | 6993 | 5500 | 520 | 520 | 7.44% | 9.45% | 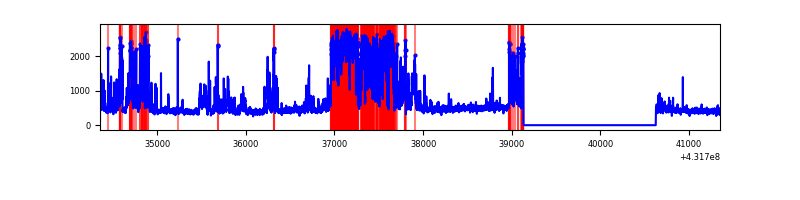 |
| C | 6993 | 5501 | 0 | 0 | 0.00% | 0.00% | 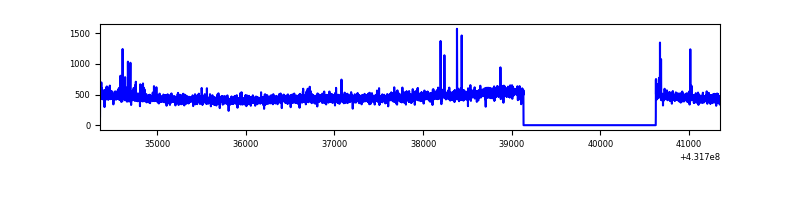 |
| D | 6993 | 5500 | 409 | 409 | 5.85% | 7.44% | 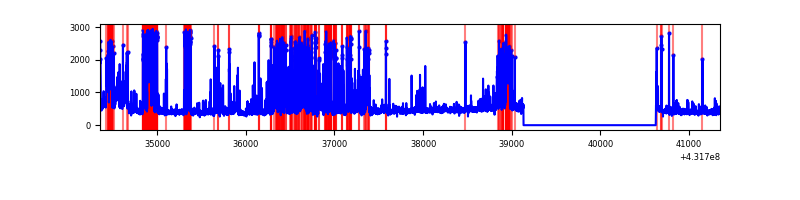 |
Top three noisy pixels from each quadrant. If the there are fewer than three noisy pixels in the level2.evt file, extra rows are filled as -1
| Pixel properties | Quadrant properties | ||||||
|---|---|---|---|---|---|---|---|
| Quadrant | DetID | PixID | Counts | Sigma | Mean | Median | Sigma |
| A | 15 | 237 | 6294066 | 86401.04 | 347 | 339 | 72.8 |
| A | 10 | 83 | 439185 | 6024.53 | 347 | 339 | 72.8 |
| A | 15 | 222 | 40516 | 551.55 | 347 | 339 | 72.8 |
| B | 4 | 81 | 2024180 | 18714.42 | 559 | 543 | 108.1 |
| B | 15 | 32 | 16840 | 150.71 | 559 | 543 | 108.1 |
| B | 4 | 171 | 14498 | 129.05 | 559 | 543 | 108.1 |
| C | 15 | 214 | 239802 | 1767.07 | 572 | 574 | 135.4 |
| C | 14 | 254 | 23348 | 168.22 | 572 | 574 | 135.4 |
| C | 12 | 249 | 8102 | 55.61 | 572 | 574 | 135.4 |
| D | 2 | 249 | 799455 | 5895.23 | 555 | 538 | 135.5 |
| D | 1 | 52 | 717637 | 5291.49 | 555 | 538 | 135.5 |
| D | 10 | 118 | 165284 | 1215.67 | 555 | 538 | 135.5 |
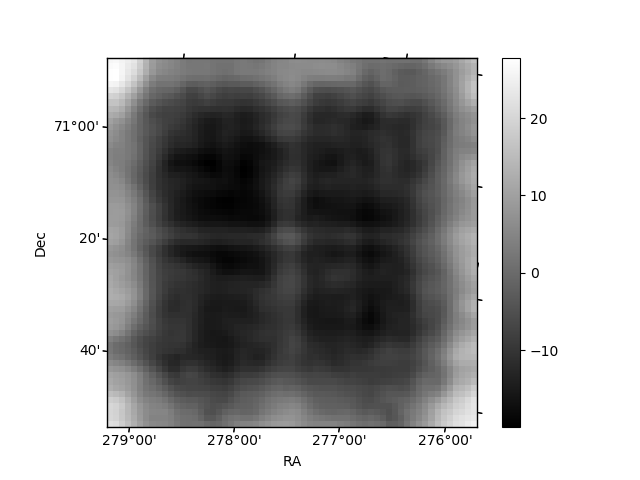
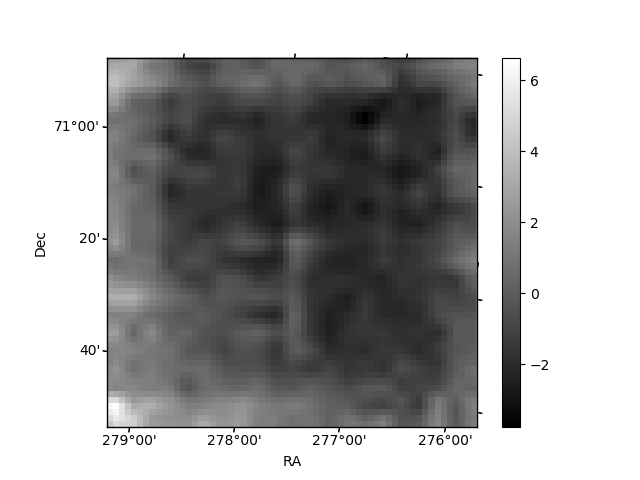
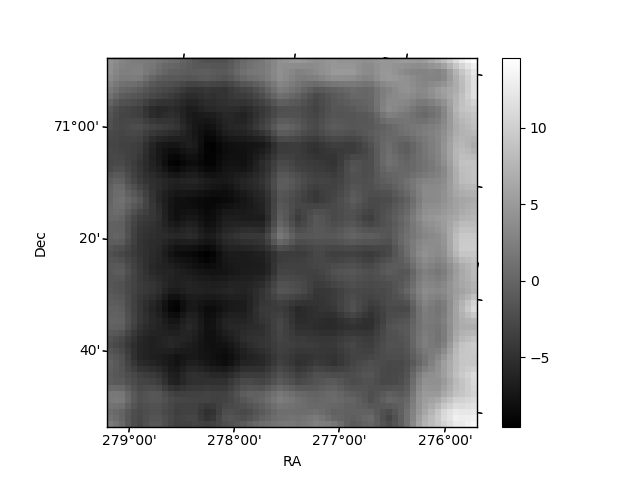
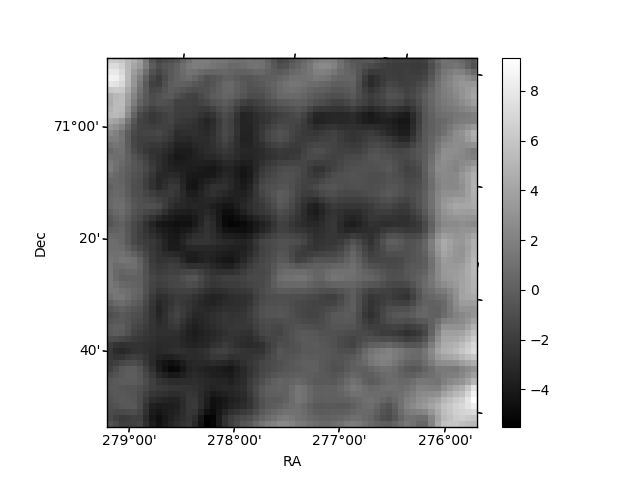
Histogram calculated using DETX and DETY for each event in the final _common_clean file
| Quadrant A | 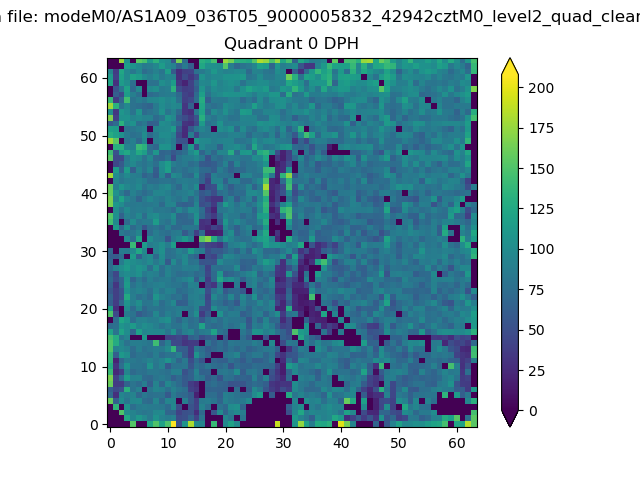 |
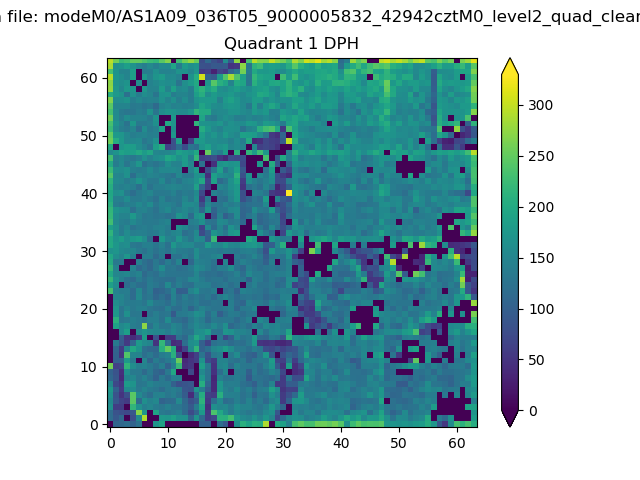 |
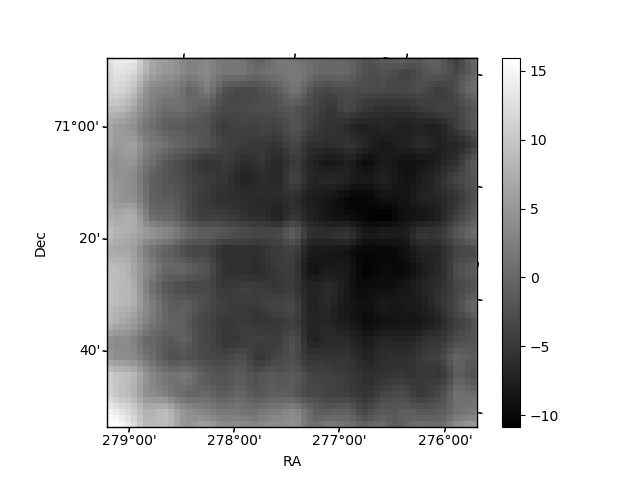
Quadrant B |
|---|---|---|---|
| Quadrant D | 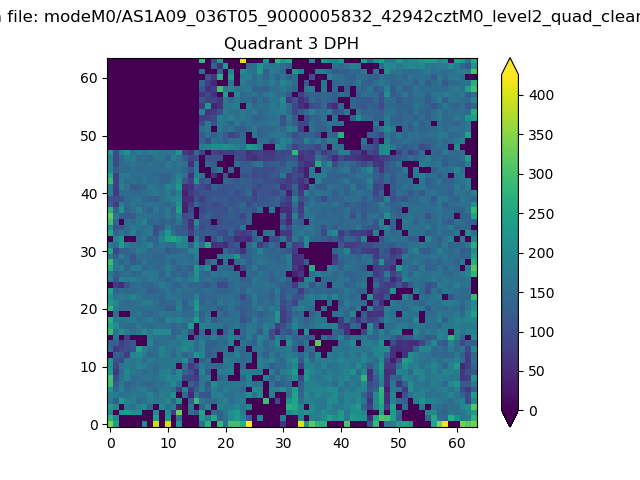 |
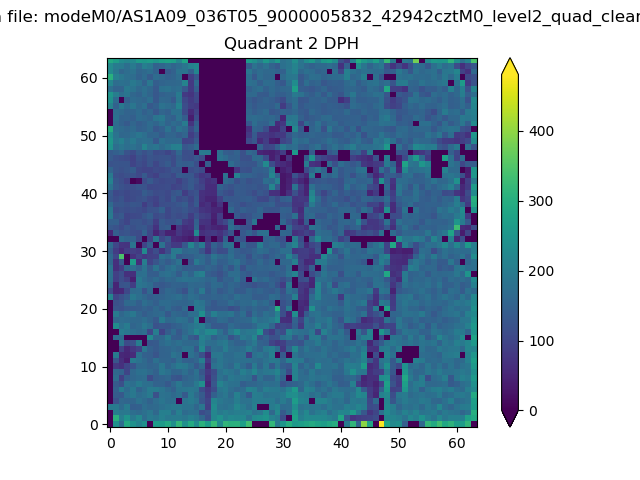 |
Quadrant C |
| Plot type | Count rate plots | Images |
|---|---|---|
| Comparison with Poisson distribution Blue bars denote a histogram of data divided into 1 sec bins. Red curve is a Poisson curve with rate = median count rate of data. |
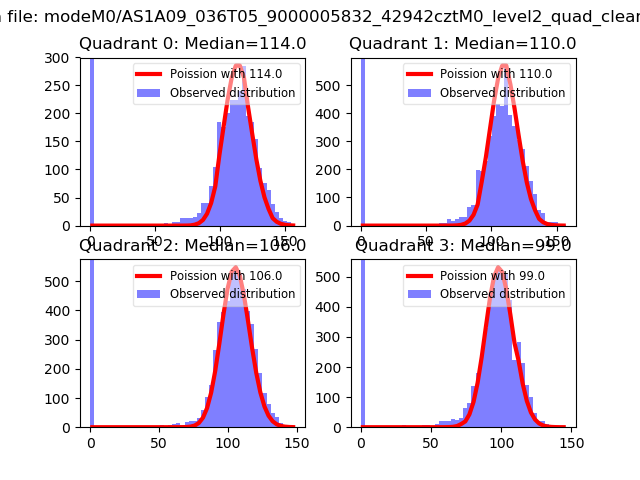 |
 |
| Quadrant-wise count rates Data is divided into 100 sec bins |
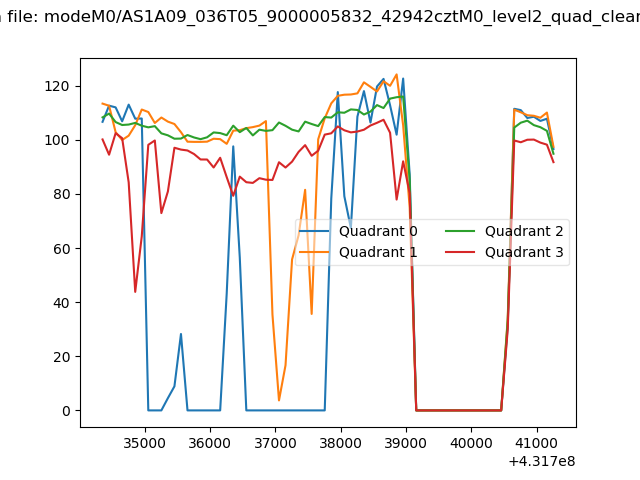 |
|
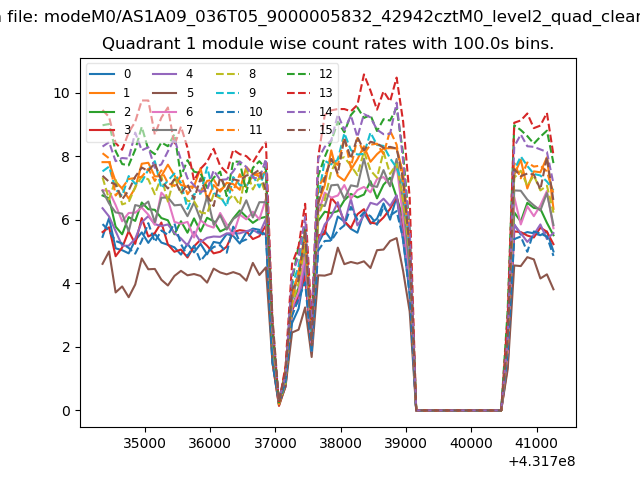
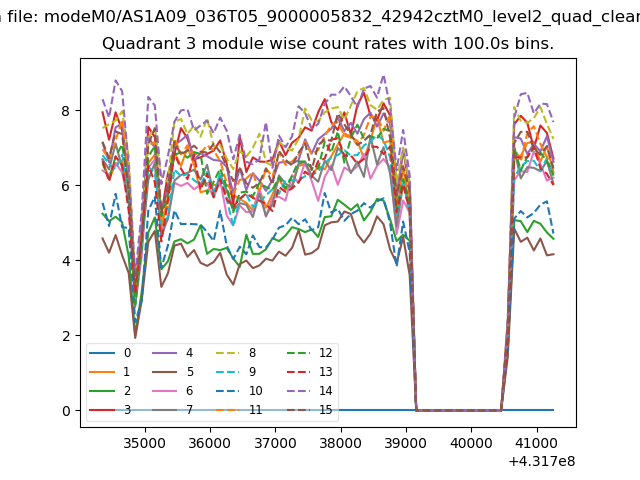
| Module-wise count rates for Quadrant A Data is divided into 100 sec bins |
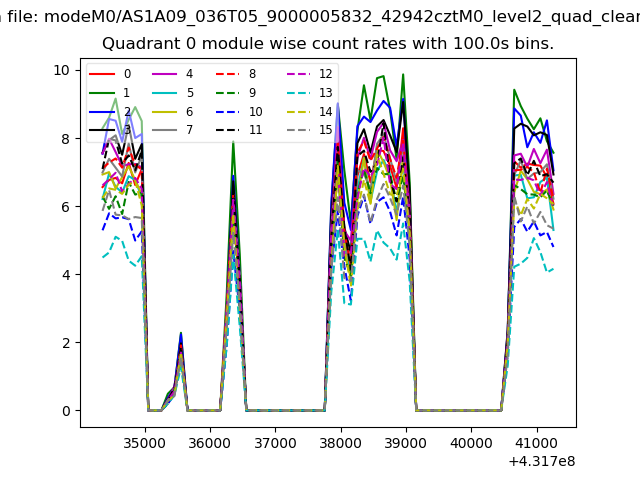 |
 |
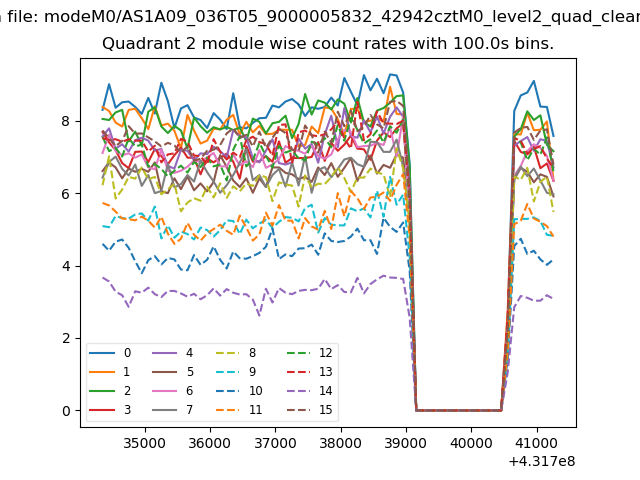
| Module-wise count rates for Quadrant B Data is divided into 100 sec bins |
 |
 |
| Module-wise count rates for Quadrant C Data is divided into 100 sec bins |
 |
 |
| Module-wise count rates for Quadrant D Data is divided into 100 sec bins |
 |
 |
| Parameter | Plot |
|---|---|
| CZT HV Monitor |  |
| D_VDD | 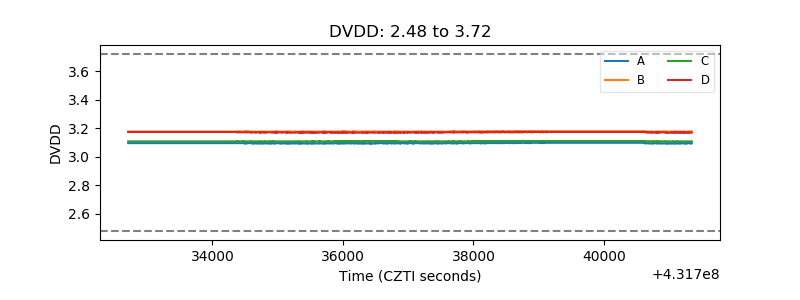 |
| Temperature 1 | 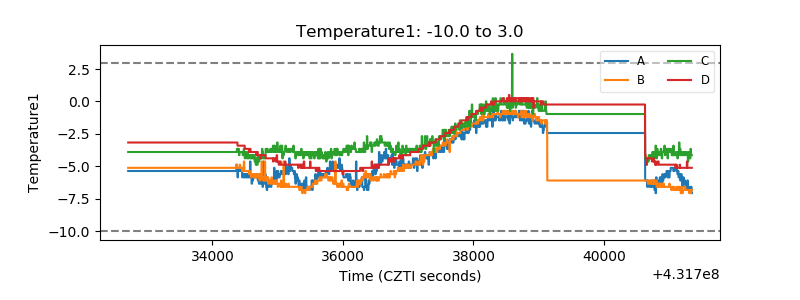 |
| Veto HV Monitor | 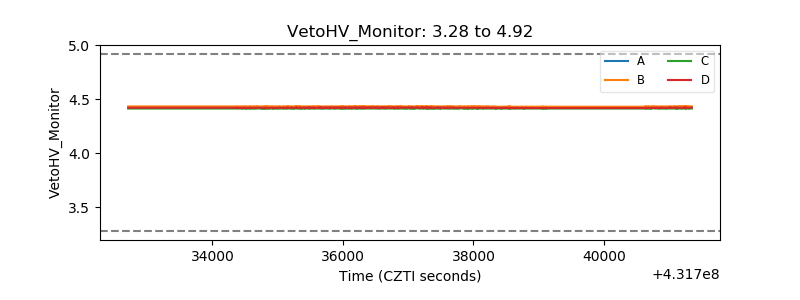 |
| Veto LLD | 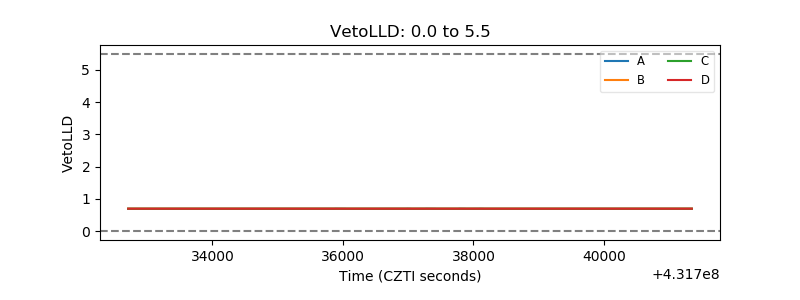 |
| Alpha Counter | 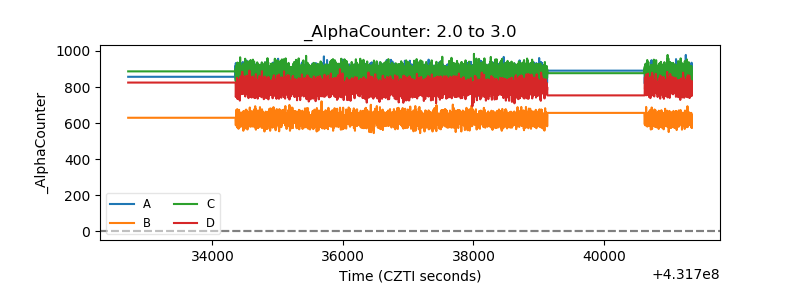 |
| _CPM_Rate | 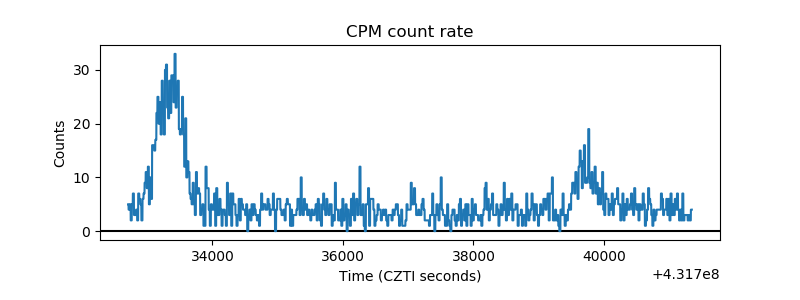 |
| CZT Counter | 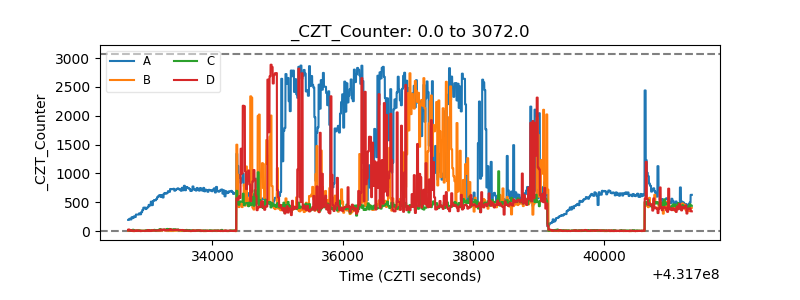 |
| +2.5 Volts monitor | 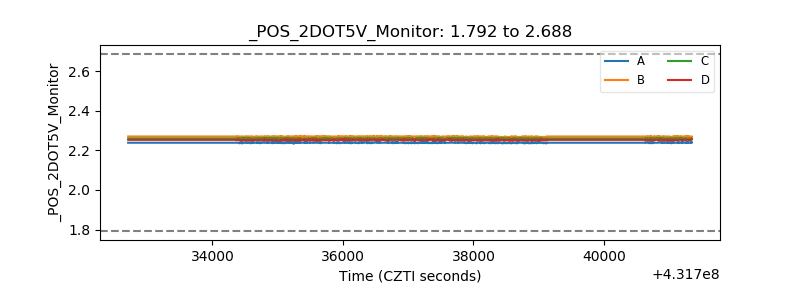 |
| +5 Volts monitor | 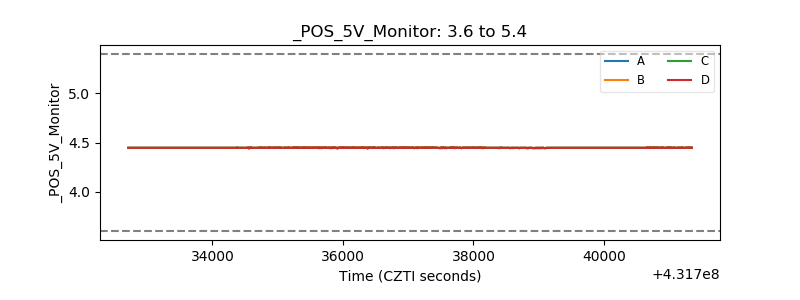 |
| _ROLL_ROT | 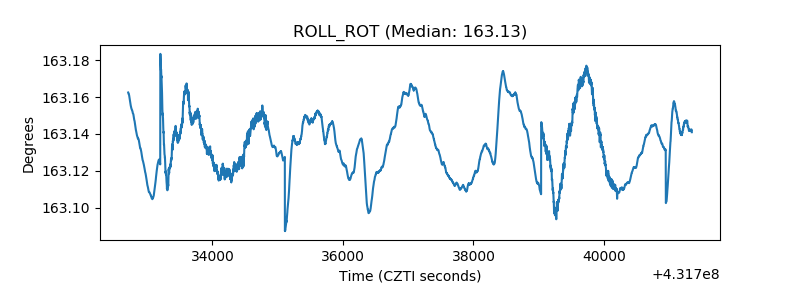 |
| _Roll_DEC | 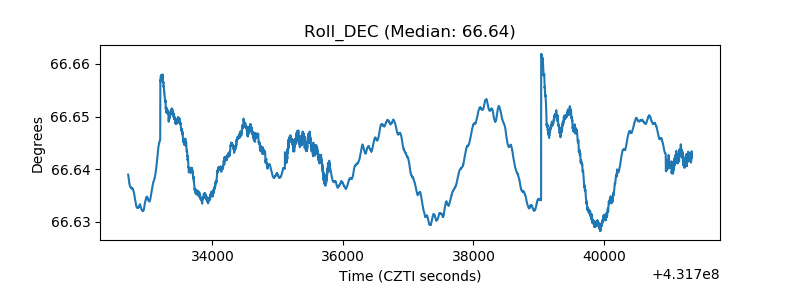 |
| _Roll_RA | 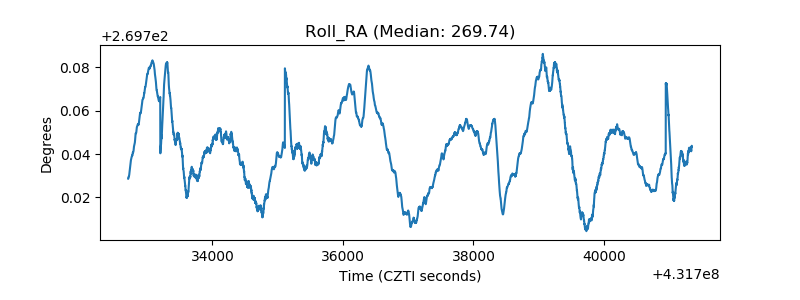 |
| Veto Counter | 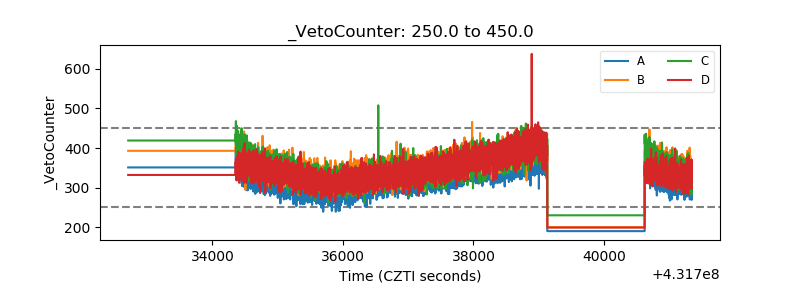 |