| Param | Original file | Final file |
|---|---|---|
| Filename | modeM0/AS1A09_036T05_9000005832_42943cztM0_level2.fits | modeM0/AS1A09_036T05_9000005832_42943cztM0_level2_quad_clean.evt |
| Size (bytes) | 123,376,320 | 32,163,840 |
| Size | 117.7 MB | 30.7 MB |
| Events in quadrant A | 1,236,162 | 210,288 |
| Events in quadrant B | 1,150,669 | 212,106 |
| Events in quadrant C | 908,915 | 211,790 |
| Events in quadrant D | 1,111,562 | 193,540 |
| Mode M0 | |||
|---|---|---|---|
| Quadrant | BADHDUFLAG | Total packets | Discarded packets |
| A | 0 | 5022 | 1 |
| B | 0 | 4910 | 1 |
| C | 0 | 4078 | 1 |
| D | 0 | 4866 | 1 |
| Mode M9 | |||
|---|---|---|---|
| Quadrant | BADHDUFLAG | Total packets | Discarded packets |
| A | 0 | 15 | 0 |
| B | 0 | 15 | 0 |
| C | 0 | 15 | 0 |
| D | 0 | 15 | 0 |
| Mode SS | |||
|---|---|---|---|
| Quadrant | BADHDUFLAG | Total packets | Discarded packets |
| A | 0 | 42 | 0 |
| B | 0 | 42 | 0 |
| C | 0 | 42 | 0 |
| D | 0 | 42 | 0 |
| Quadrant | Total seconds | Saturated seconds | Saturation percentage |
|---|---|---|---|
| A | 2015 | 42 | 2.084367% |
| B | 2016 | 74 | 3.670635% |
| C | 2016 | 4 | 0.198413% |
| D | 2016 | 70 | 3.472222% |
Noise dominated data is calculated using 1-second bins in cleaned event files. If a bin has >2000 counts, and if more than 50% of those come from <1% of pixels, then it is considered to be noise-dominated and hence unusable.
| Quadrant | # 1 sec bins | Bins with >0 counts | Bins with >2000 counts | High rate bins dominated by noise | Noise dominated (total time) | Noise dominated (detector-on time) | Marked lightcurve |
|---|---|---|---|---|---|---|---|
| A | 3508 | 2015 | 40 | 40 | 1.14% | 1.99% | 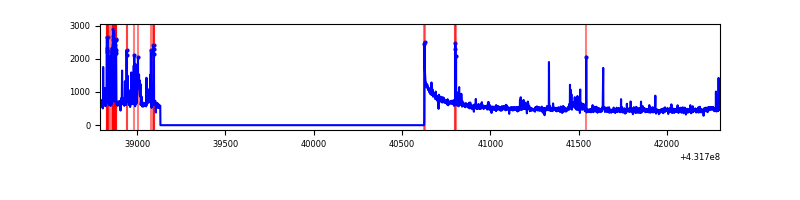 |
| B | 3508 | 2015 | 36 | 36 | 1.03% | 1.79% |  |
| C | 3508 | 2016 | 0 | 0 | 0.00% | 0.00% | 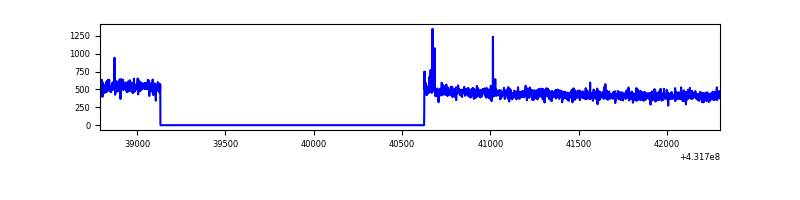 |
| D | 3508 | 2015 | 47 | 47 | 1.34% | 2.33% | 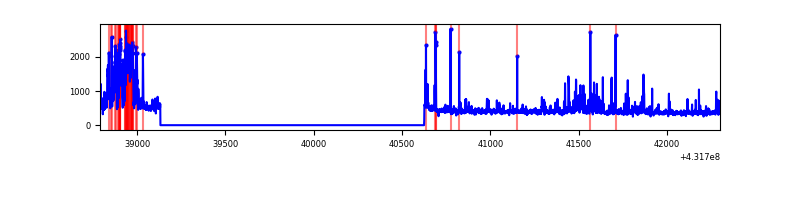 |
Top three noisy pixels from each quadrant. If the there are fewer than three noisy pixels in the level2.evt file, extra rows are filled as -1
| Pixel properties | Quadrant properties | ||||||
|---|---|---|---|---|---|---|---|
| Quadrant | DetID | PixID | Counts | Sigma | Mean | Median | Sigma |
| A | 10 | 83 | 243805 | 5505.03 | 205 | 200 | 44.3 |
| A | 15 | 237 | 140550 | 3171.65 | 205 | 200 | 44.3 |
| A | 15 | 222 | 44098 | 992.01 | 205 | 200 | 44.3 |
| B | 4 | 81 | 309085 | 7353.86 | 207 | 201 | 42.0 |
| B | 15 | 32 | 14533 | 341.21 | 207 | 201 | 42.0 |
| B | 4 | 171 | 8138 | 188.96 | 207 | 201 | 42.0 |
| C | 15 | 214 | 90828 | 1792.82 | 207 | 208 | 50.5 |
| C | 14 | 254 | 5746 | 109.56 | 207 | 208 | 50.5 |
| C | 13 | 61 | 1360 | 22.79 | 207 | 208 | 50.5 |
| D | 10 | 118 | 164735 | 3207.54 | 202 | 196 | 51.3 |
| D | 1 | 52 | 59295 | 1152.08 | 202 | 196 | 51.3 |
| D | 12 | 6 | 40820 | 791.93 | 202 | 196 | 51.3 |
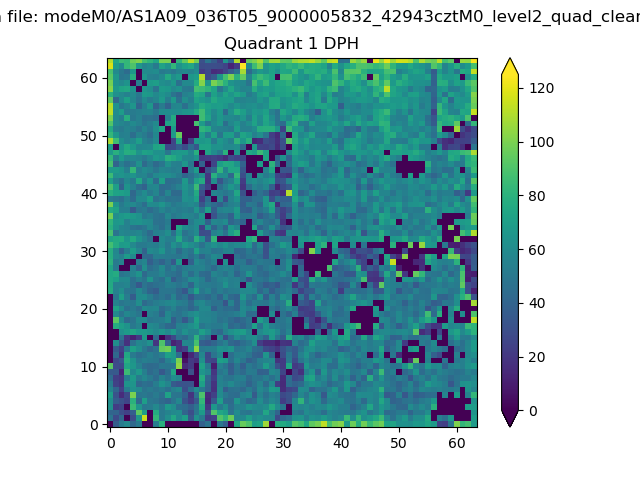
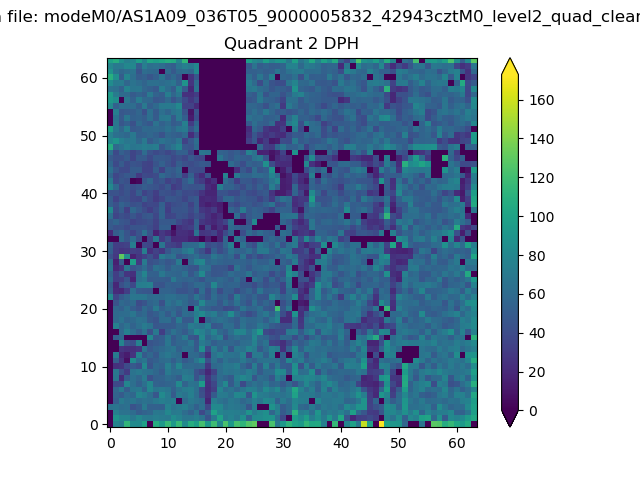
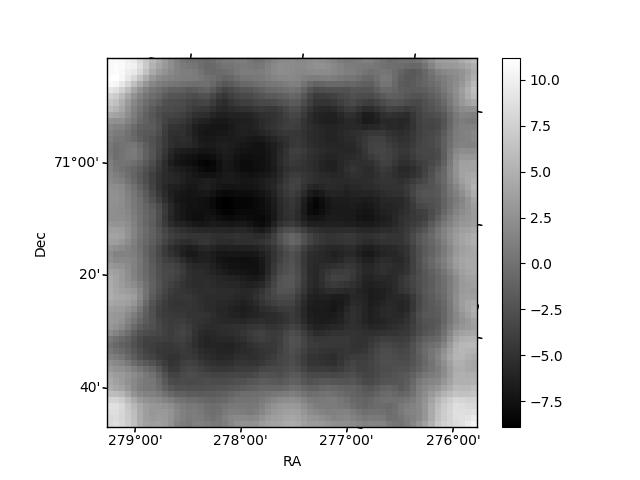
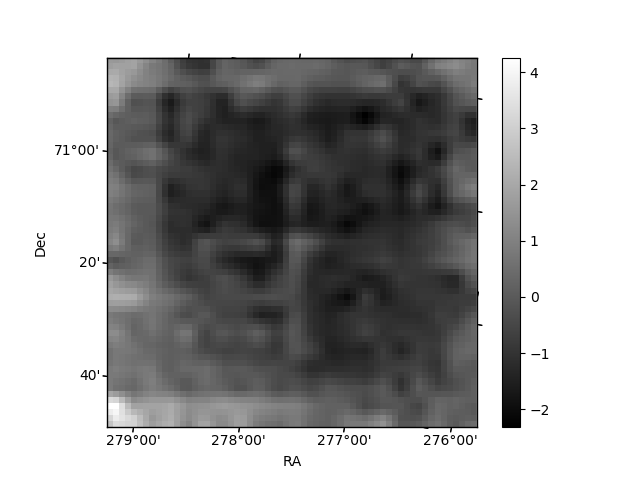
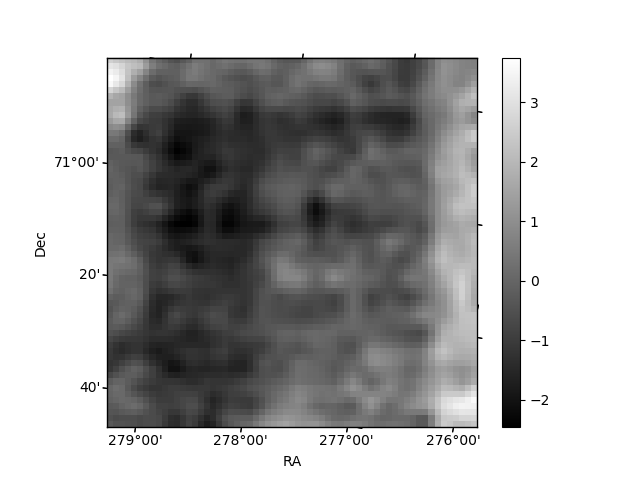
Histogram calculated using DETX and DETY for each event in the final _common_clean file
| Quadrant A | 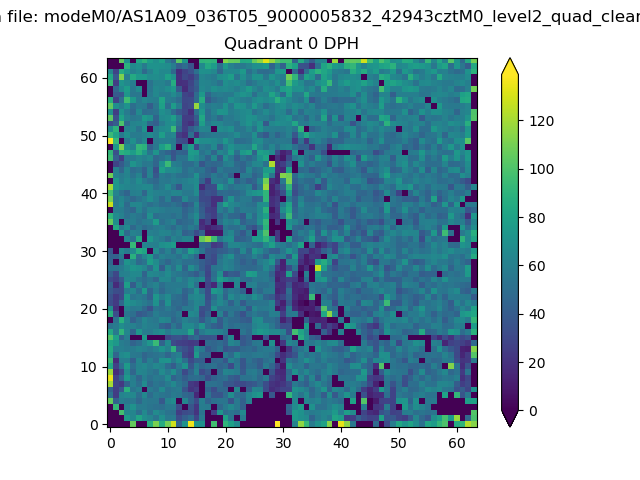 |
 |
Quadrant B |
|---|---|---|---|
| Quadrant D | 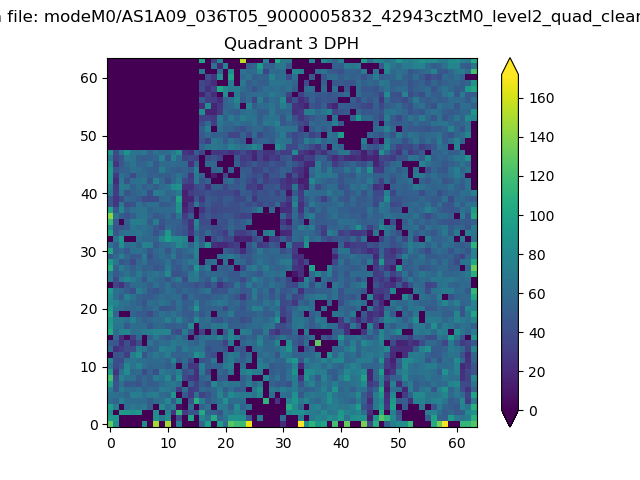 |
 |
Quadrant C |
| Plot type | Count rate plots | Images |
|---|---|---|
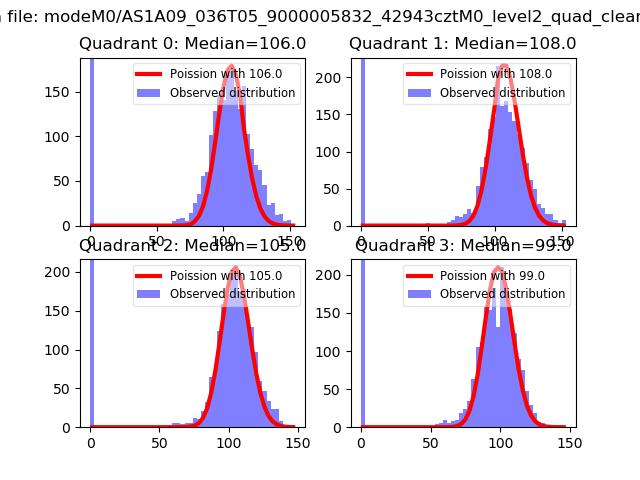
| Comparison with Poisson distribution Blue bars denote a histogram of data divided into 1 sec bins. Red curve is a Poisson curve with rate = median count rate of data. |
 |
 |
| Quadrant-wise count rates Data is divided into 100 sec bins |
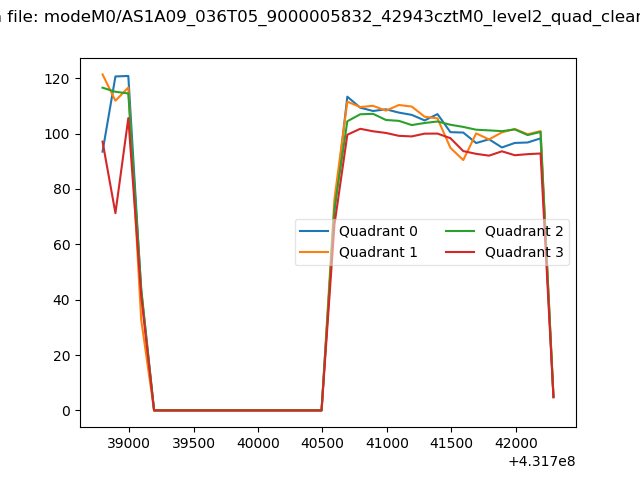 |
|
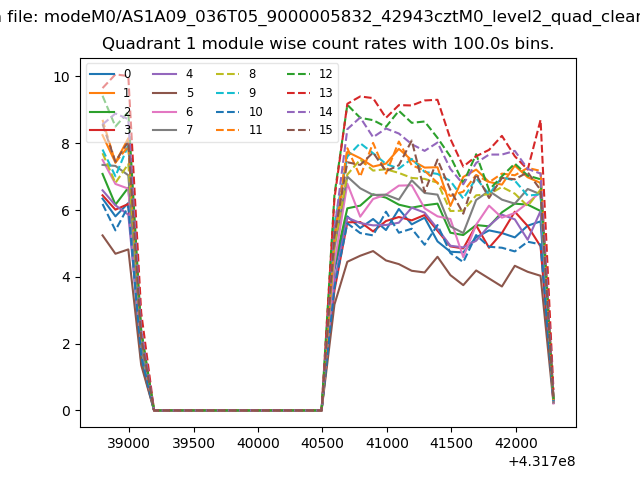
| Module-wise count rates for Quadrant A Data is divided into 100 sec bins |
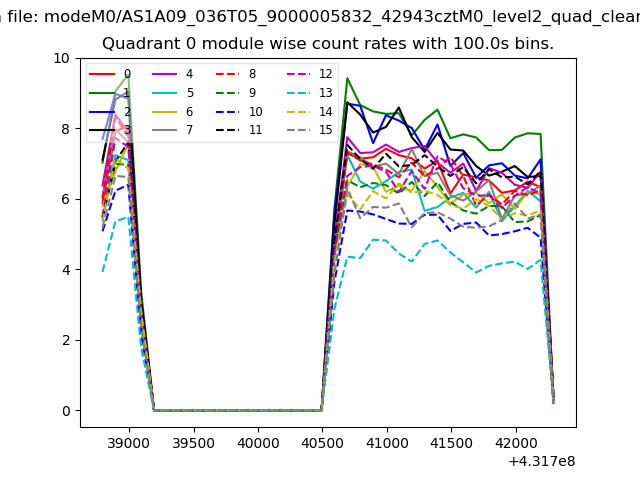 |
 |
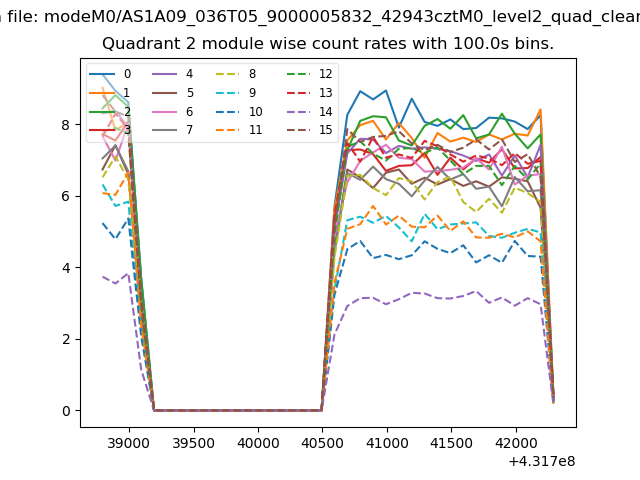
| Module-wise count rates for Quadrant B Data is divided into 100 sec bins |
 |
 |
| Module-wise count rates for Quadrant C Data is divided into 100 sec bins |
 |
 |
| Module-wise count rates for Quadrant D Data is divided into 100 sec bins |
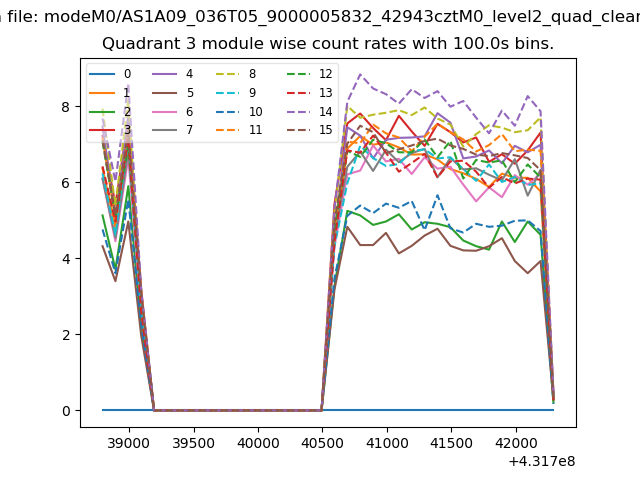 |
 |
| Parameter | Plot |
|---|---|
| CZT HV Monitor | 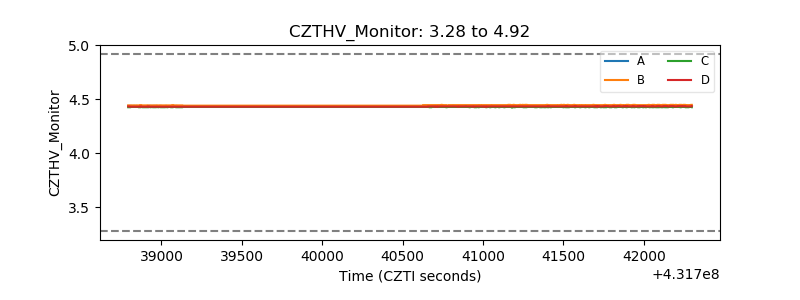 |
| D_VDD | 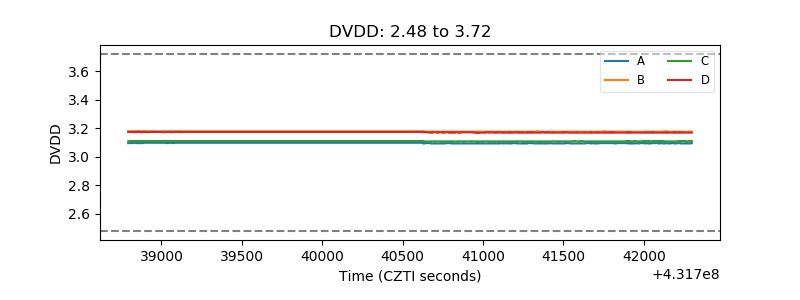 |
| Temperature 1 | 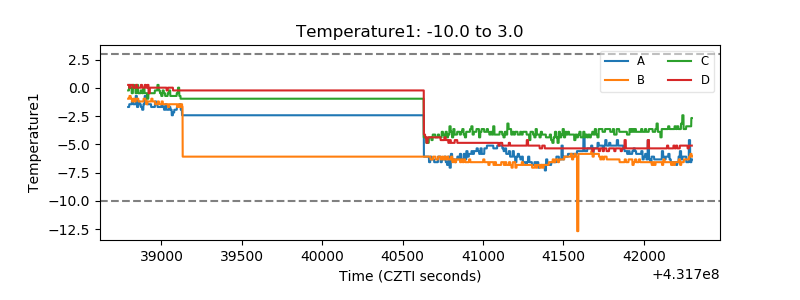 |
| Veto HV Monitor | 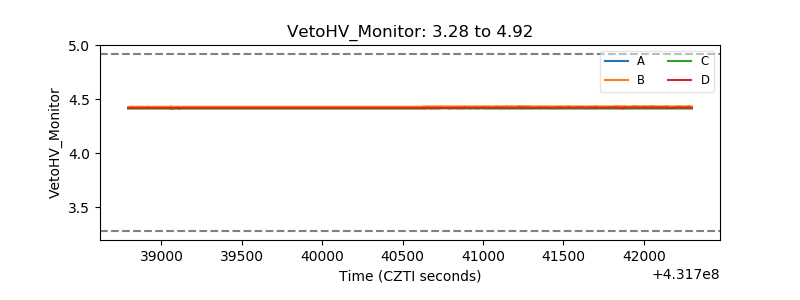 |
| Veto LLD | 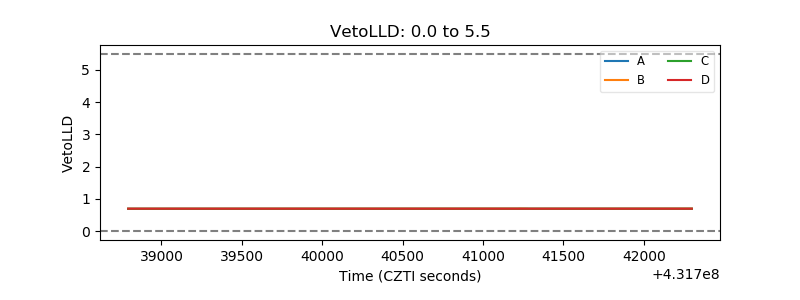 |
| Alpha Counter | 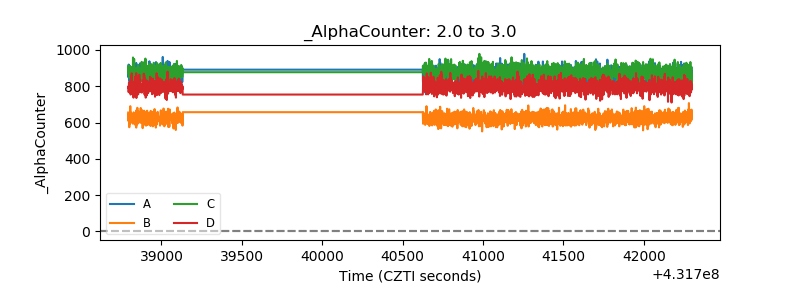 |
| _CPM_Rate | 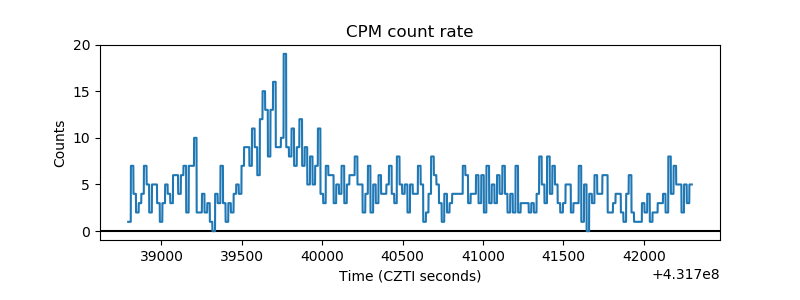 |
| CZT Counter | 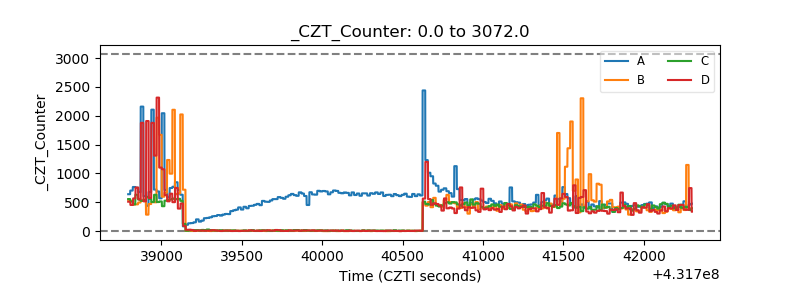 |
| +2.5 Volts monitor | 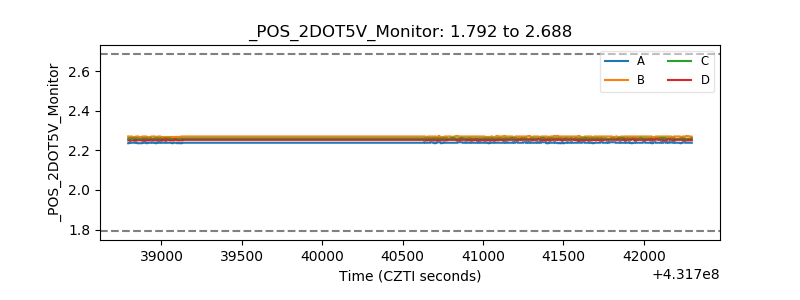 |
| +5 Volts monitor | 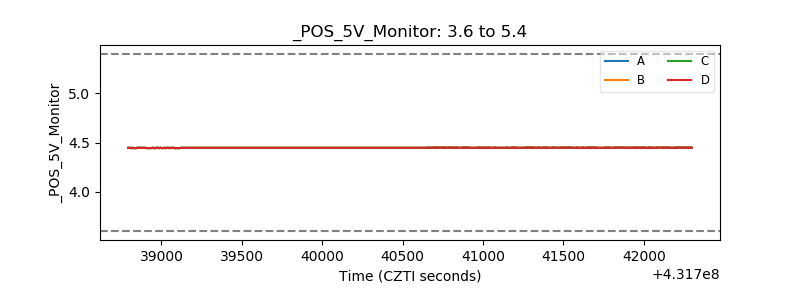 |
| _ROLL_ROT | 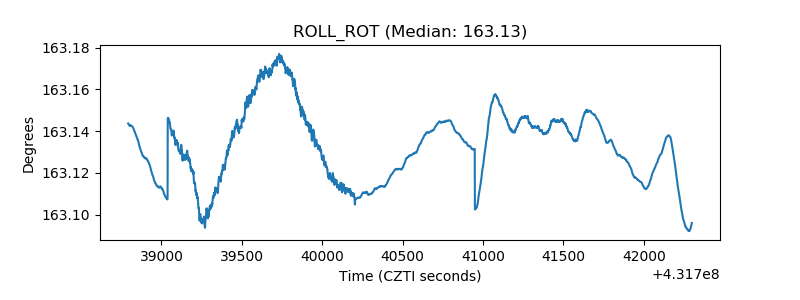 |
| _Roll_DEC | 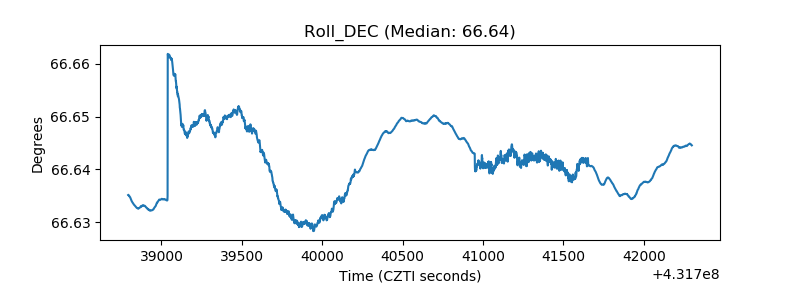 |
| _Roll_RA | 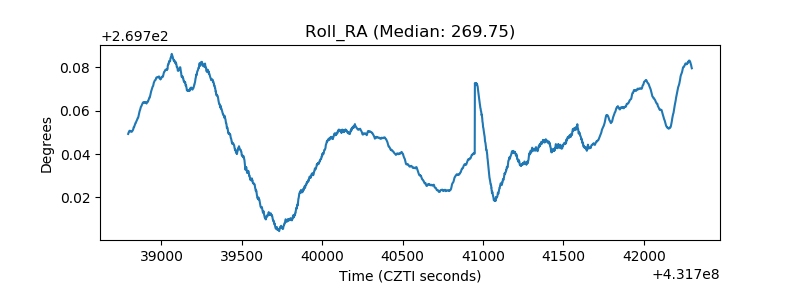 |
| Veto Counter | 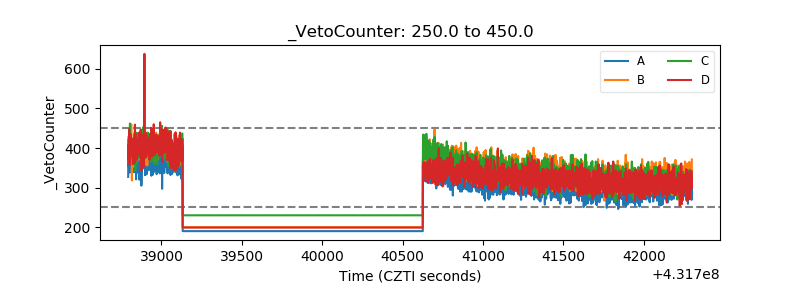 |