| Param | Original file | Final file |
|---|---|---|
| Filename | modeM0/AS1T05_143T01_9000005834_42943cztM0_level2.fits | modeM0/AS1T05_143T01_9000005834_42943cztM0_level2_quad_clean.evt |
| Size (bytes) | 226,152,000 | 62,513,280 |
| Size | 215.7 MB | 59.6 MB |
| Events in quadrant A | 2,521,646 | 413,739 |
| Events in quadrant B | 1,744,254 | 431,666 |
| Events in quadrant C | 1,784,964 | 404,448 |
| Events in quadrant D | 2,023,370 | 374,559 |
| Mode SS | |||
|---|---|---|---|
| Quadrant | BADHDUFLAG | Total packets | Discarded packets |
| A | 0 | 78 | 0 |
| B | 0 | 78 | 0 |
| C | 0 | 78 | 0 |
| D | 0 | 78 | 0 |
| Mode M0 | |||
|---|---|---|---|
| Quadrant | BADHDUFLAG | Total packets | Discarded packets |
| A | 0 | 10068 | 1 |
| B | 0 | 7813 | 1 |
| C | 0 | 7691 | 3 |
| D | 0 | 8676 | 1 |
| Mode M9 | |||
|---|---|---|---|
| Quadrant | BADHDUFLAG | Total packets | Discarded packets |
| A | 0 | 13 | 0 |
| B | 0 | 13 | 0 |
| C | 0 | 13 | 0 |
| D | 0 | 13 | 0 |
| Quadrant | Total seconds | Saturated seconds | Saturation percentage |
|---|---|---|---|
| A | 3799 | 92 | 2.421690% |
| B | 3799 | 6 | 0.157936% |
| C | 3798 | 2 | 0.052659% |
| D | 3798 | 31 | 0.816219% |
Noise dominated data is calculated using 1-second bins in cleaned event files. If a bin has >2000 counts, and if more than 50% of those come from <1% of pixels, then it is considered to be noise-dominated and hence unusable.
| Quadrant | # 1 sec bins | Bins with >0 counts | Bins with >2000 counts | High rate bins dominated by noise | Noise dominated (total time) | Noise dominated (detector-on time) | Marked lightcurve |
|---|---|---|---|---|---|---|---|
| A | 5110 | 3798 | 75 | 75 | 1.47% | 1.97% | 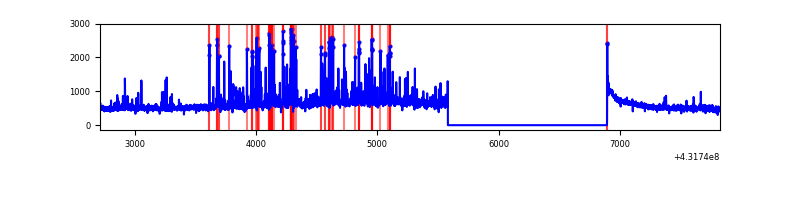 |
| B | 5110 | 3798 | 1 | 1 | 0.02% | 0.03% | 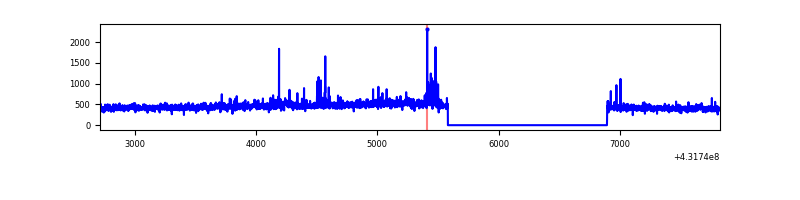 |
| C | 5109 | 3797 | 0 | 0 | 0.00% | 0.00% | 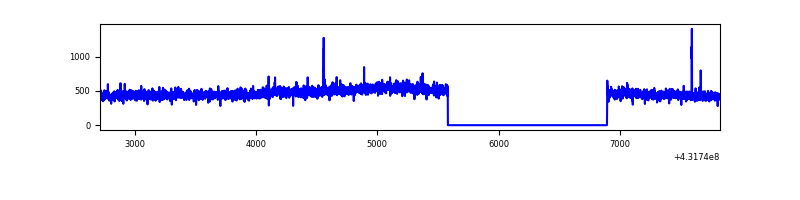 |
| D | 5109 | 3797 | 32 | 32 | 0.63% | 0.84% | 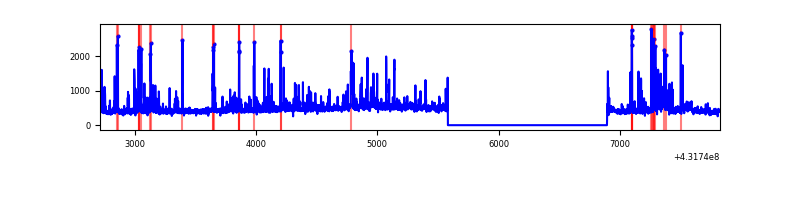 |
Top three noisy pixels from each quadrant. If the there are fewer than three noisy pixels in the level2.evt file, extra rows are filled as -1
| Pixel properties | Quadrant properties | ||||||
|---|---|---|---|---|---|---|---|
| Quadrant | DetID | PixID | Counts | Sigma | Mean | Median | Sigma |
| A | 10 | 83 | 389935 | 4457.51 | 421 | 411 | 87.4 |
| A | 15 | 222 | 248559 | 2839.68 | 421 | 411 | 87.4 |
| A | 15 | 237 | 213966 | 2443.81 | 421 | 411 | 87.4 |
| B | 4 | 81 | 33469 | 398.99 | 421 | 409 | 82.9 |
| B | 15 | 85 | 18618 | 219.76 | 421 | 409 | 82.9 |
| B | 12 | 111 | 10275 | 119.07 | 421 | 409 | 82.9 |
| C | 15 | 214 | 166936 | 1722.81 | 412 | 413 | 96.7 |
| C | 14 | 254 | 4943 | 46.87 | 412 | 413 | 96.7 |
| C | 15 | 111 | 3309 | 29.96 | 412 | 413 | 96.7 |
| D | 2 | 249 | 102361 | 1001.63 | 413 | 400 | 101.8 |
| D | 1 | 52 | 93756 | 917.1 | 413 | 400 | 101.8 |
| D | 12 | 6 | 64074 | 625.51 | 413 | 400 | 101.8 |
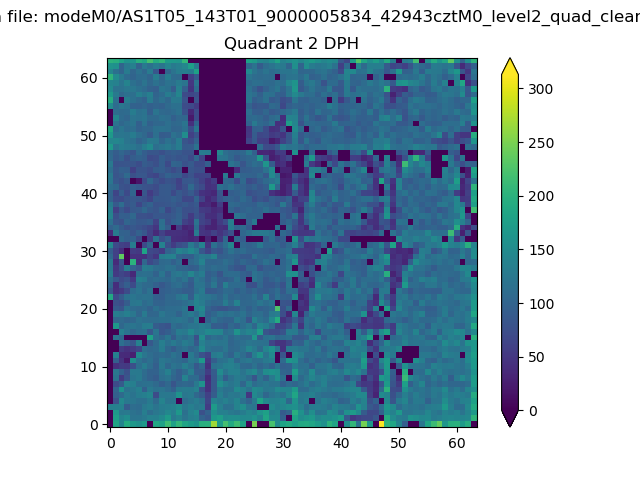
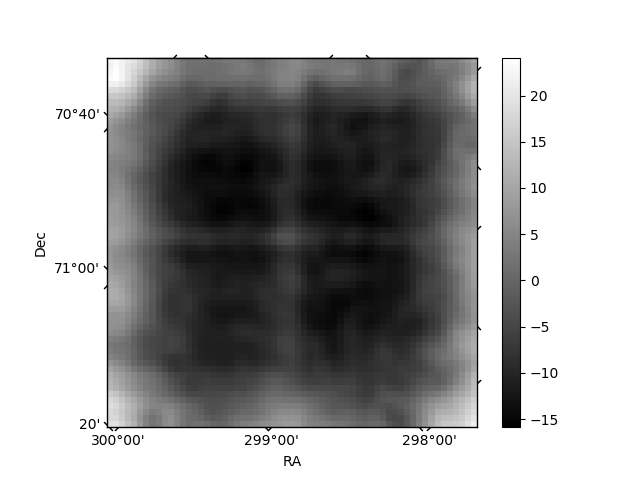
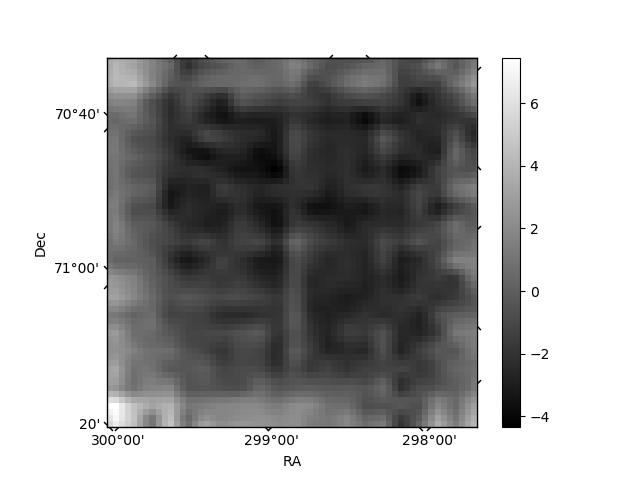
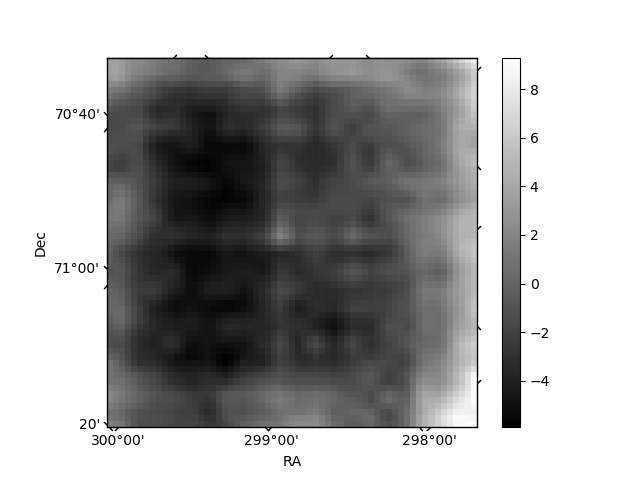
Histogram calculated using DETX and DETY for each event in the final _common_clean file
| Quadrant A | 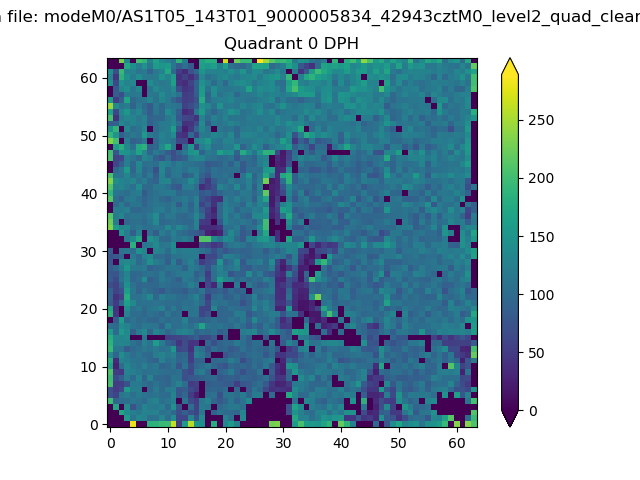 |
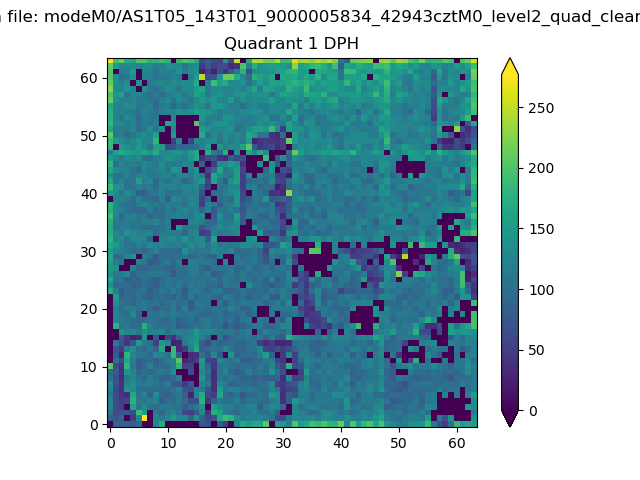 |
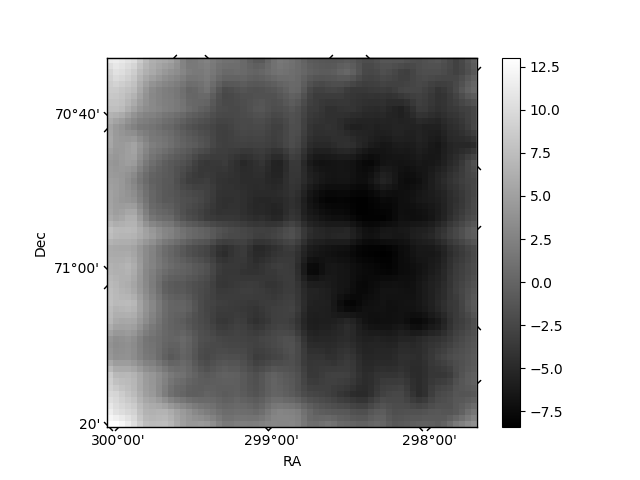
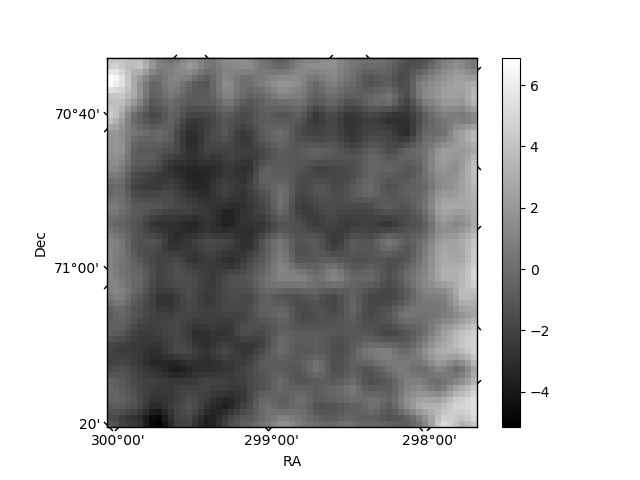
Quadrant B |
|---|---|---|---|
| Quadrant D | 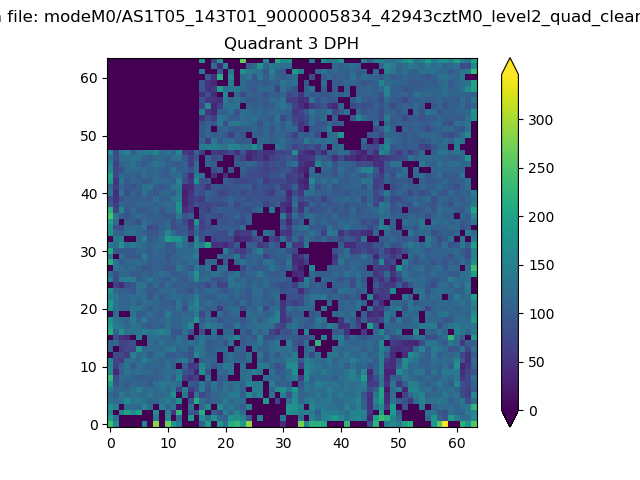 |
 |
Quadrant C |
| Plot type | Count rate plots | Images |
|---|---|---|
| Comparison with Poisson distribution Blue bars denote a histogram of data divided into 1 sec bins. Red curve is a Poisson curve with rate = median count rate of data. |
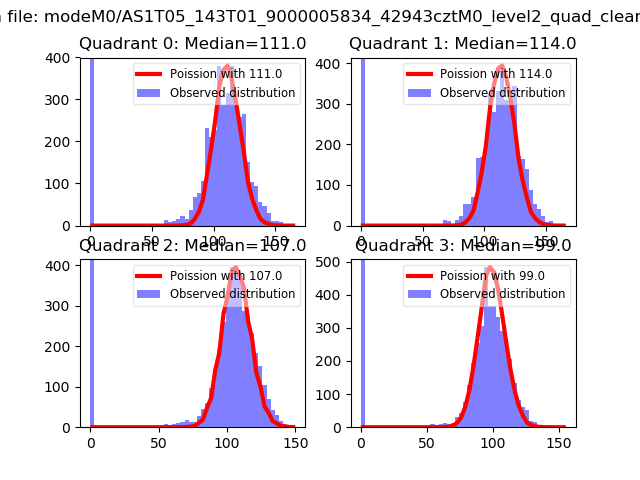 |
 |
| Quadrant-wise count rates Data is divided into 100 sec bins |
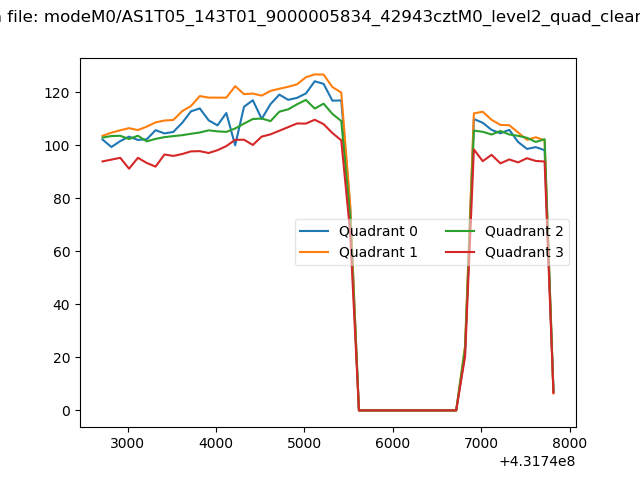 |
|
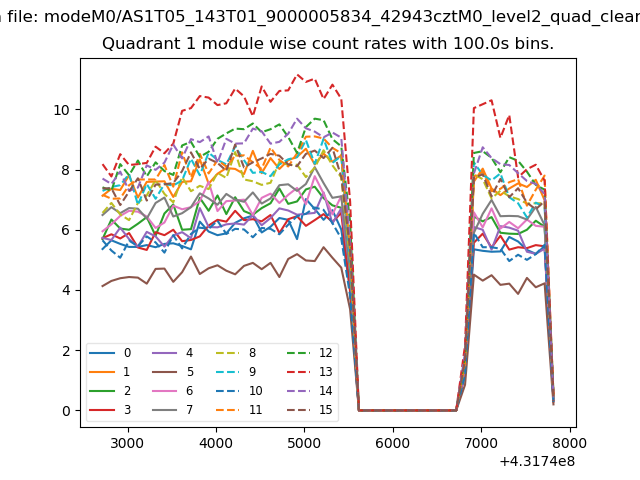
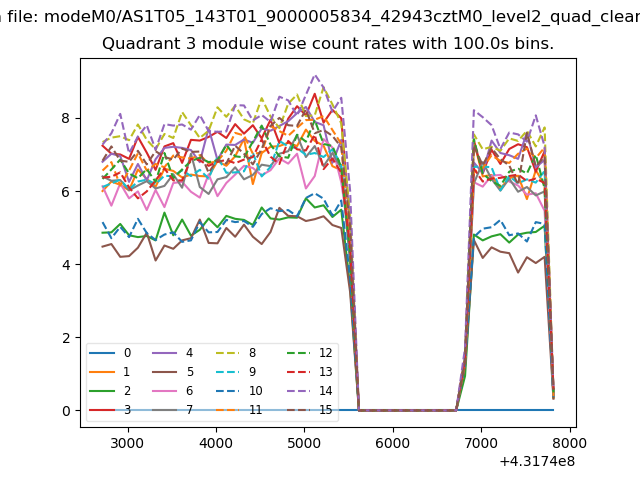
| Module-wise count rates for Quadrant A Data is divided into 100 sec bins |
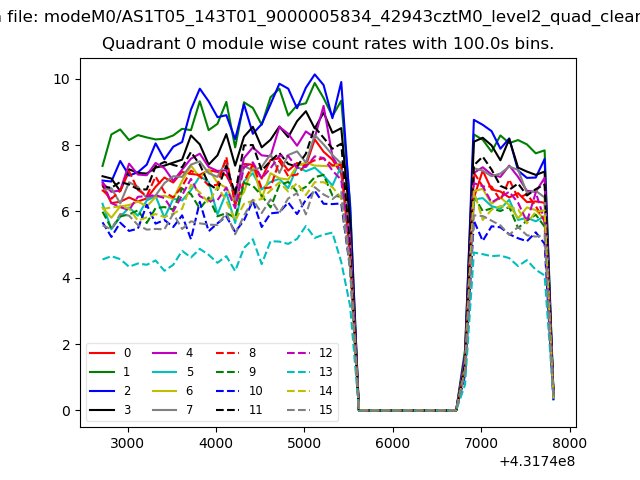 |
 |
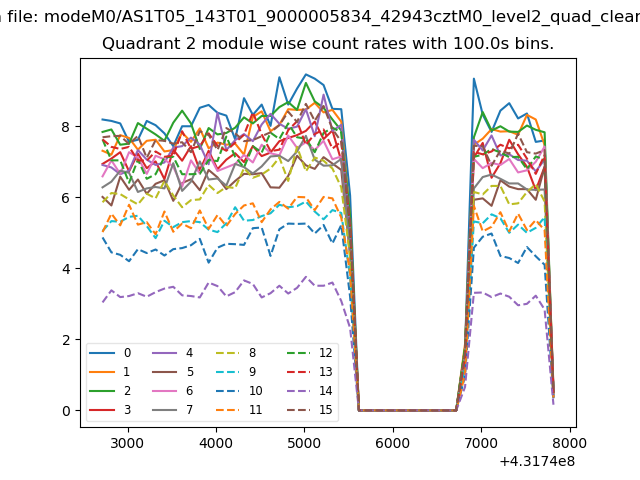
| Module-wise count rates for Quadrant B Data is divided into 100 sec bins |
 |
 |
| Module-wise count rates for Quadrant C Data is divided into 100 sec bins |
 |
 |
| Module-wise count rates for Quadrant D Data is divided into 100 sec bins |
 |
 |
| Parameter | Plot |
|---|---|
| CZT HV Monitor | 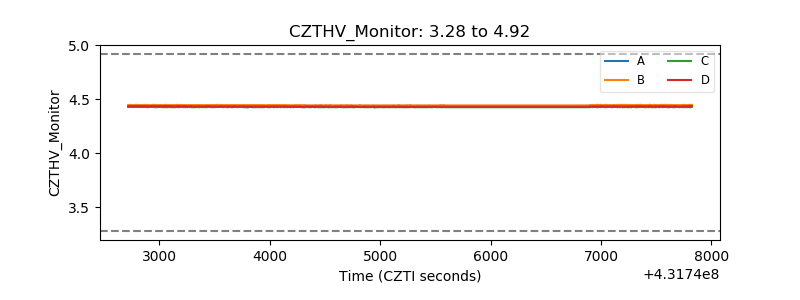 |
| D_VDD | 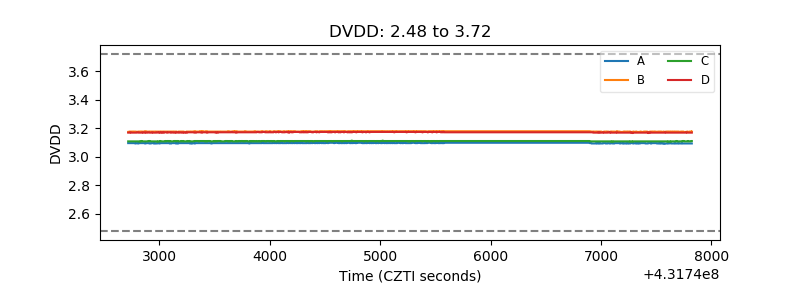 |
| Temperature 1 | 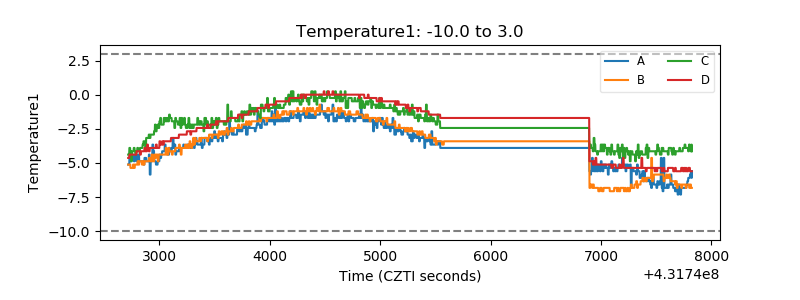 |
| Veto HV Monitor | 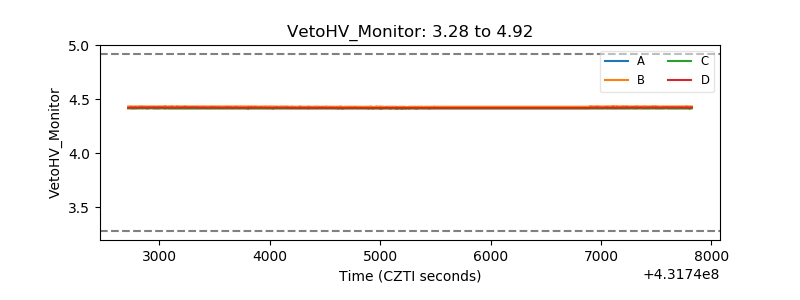 |
| Veto LLD |  |
| Alpha Counter | 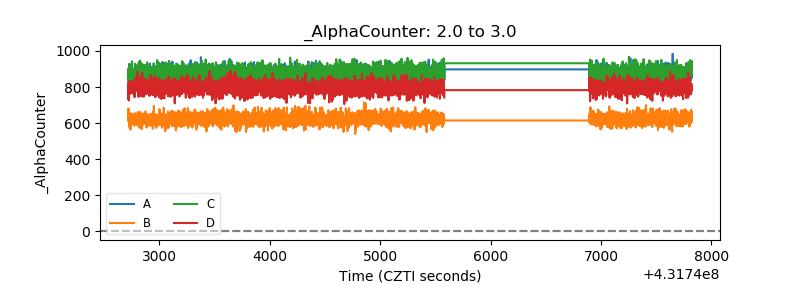 |
| _CPM_Rate | 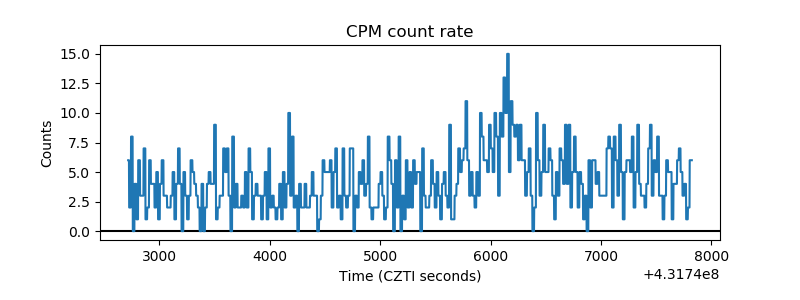 |
| CZT Counter | 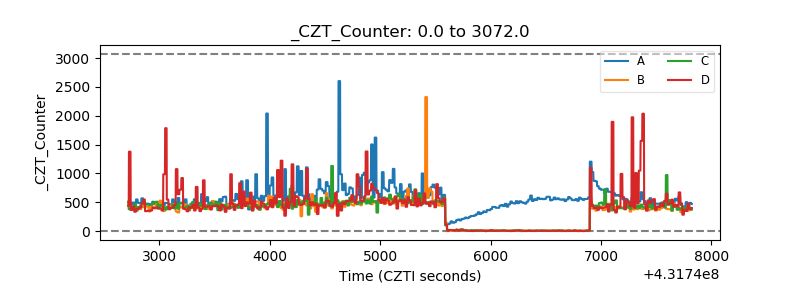 |
| +2.5 Volts monitor | 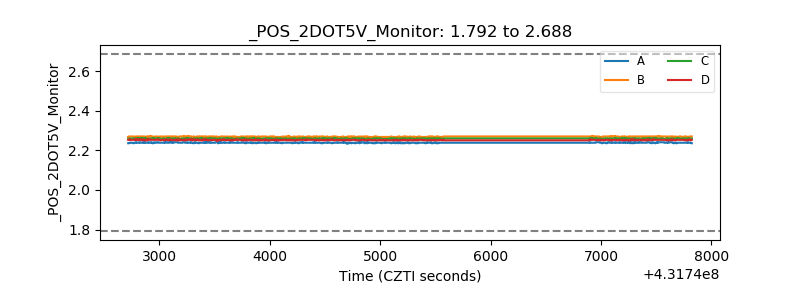 |
| +5 Volts monitor | 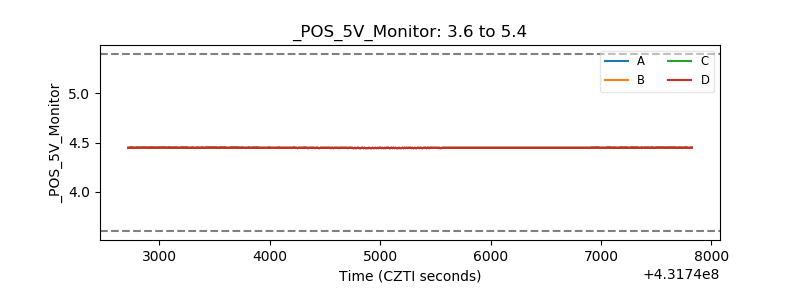 |
| _ROLL_ROT | 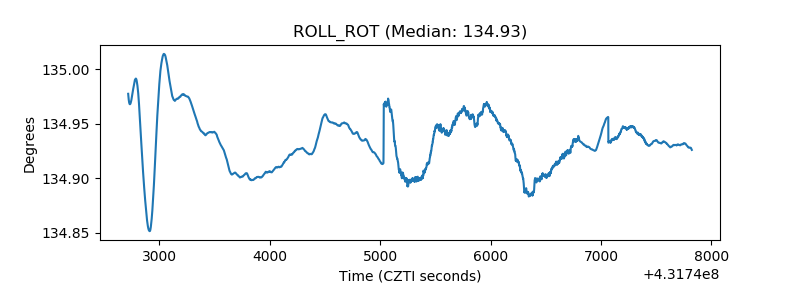 |
| _Roll_DEC | 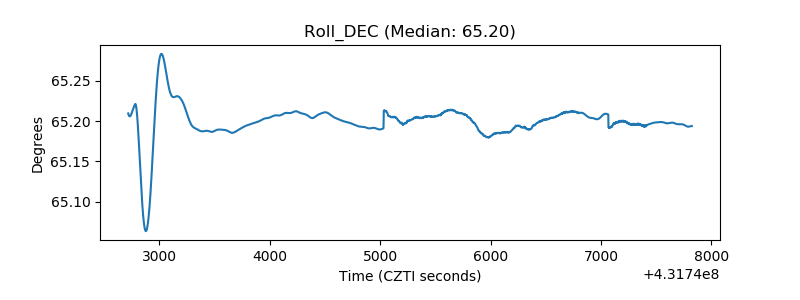 |
| _Roll_RA | 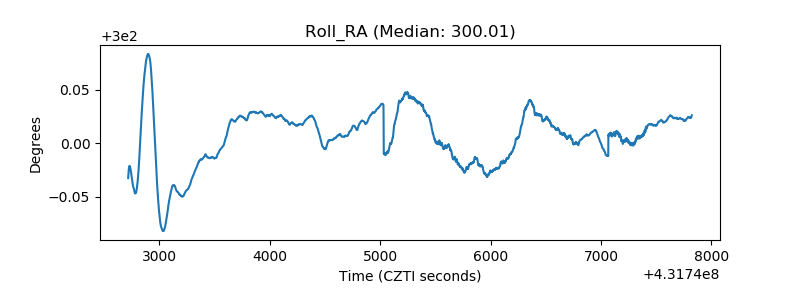 |
| Veto Counter | 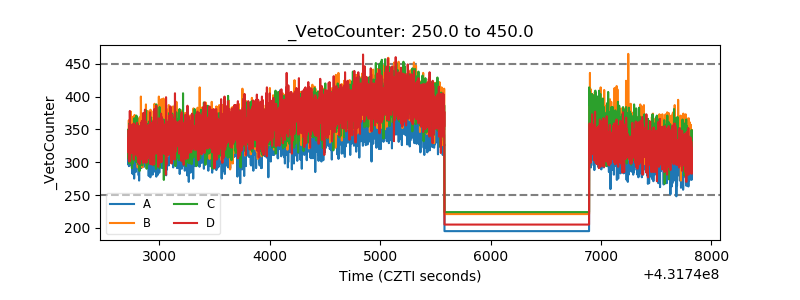 |